Technical Analysis Of The Markets


Current Position of the Market
SPX: Long-term trend – Bullish but correcting within that long-term bull market trend.
Intermediate trend – bearish correction which could retrace as low as 2200 before it is complete
Analysis of the short-term trend is done on a daily basis with the help of hourly charts. It is an important adjunct to the analysis of daily and weekly charts which discusses the course of longer market trends.
Consolidating In A Downtrend
Market Overview
Since it made a low at 2604 on 10/29, SPX has been rallying in a choppy, volatile uptrend which should continue for a while longer before the primary trend resumes. This is made even more likely because we are entering a seasonally bullish period which produces the Christmas rally. The initial counter-trend rally found resistance on 11/07 after retracing .618 of the initial decline. This was followed by a retracement down to 2671 last Thursday, before rebounding into Friday. What lies ahead is more of the same over the near term. The last phase of the decline into the 2604 low was extremely volatile and created many near-term price reversals which, on the P&F chart, formed a base which can produce a move to at least 2840 and perhaps higher to 2860-80. The index may be in the process of forming another, higher congestion area which would confirm the projection established at the lower level. That would require trading in a range over the near term before breaking out of it on the upside and reaching the higher target while completing the B wave. The current minor uptrend could move a little higher (2760 ?) before retracing.
Larger moves and how they progress are best observed on the weekly chart, so this is what we will analyze next.
Chart Analysis (The charts that are shown below are courtesy of QCharts)
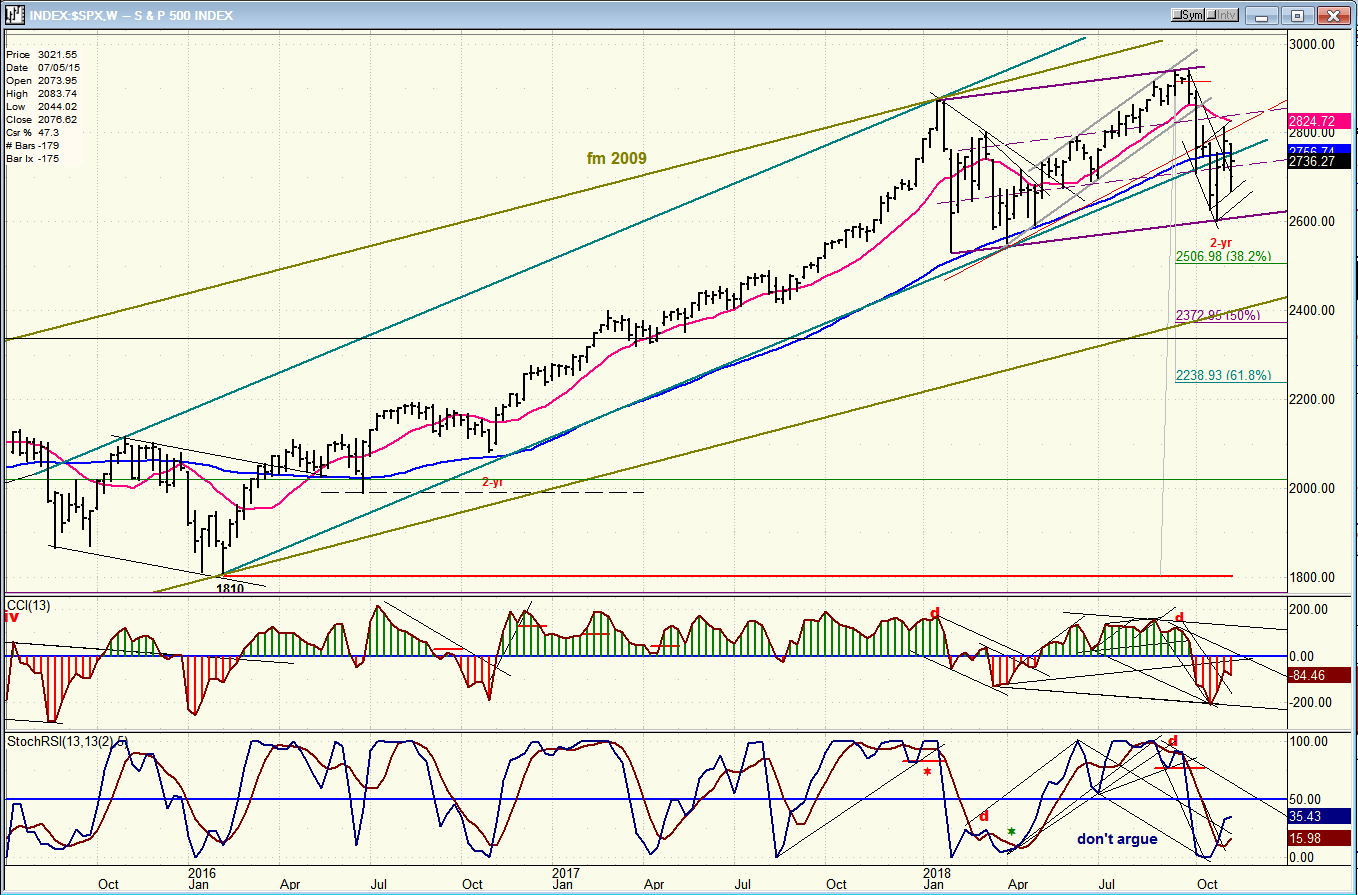
SPX weekly chart
The 337-point decline from 2941 to 2604 stopped well above the January low of 2533. Are we premature in declaring this a bear market? We are presumably correcting the uptrend from 2810 to 2941. A mere .382 retracement, which is usually the minimum amount allotted to a corrective move, would take this decline to 2506. If we had stopped there and resumed the long-term uptrend, would this have been enough of a correction to be called a bear market? Of course, we could instead keep on going, eventually ending up with a .618 retracement to 2239. Would a total decline of 700 points be more worthy of a bear market? The term “bear market” refers to a severe correction within the existing trend, but it does not tell us anything about what its extent should be. It is for the analyst to determine how long it will last and when it will come to an end.
Fortunately, we have some reliable indicators which do not leave us totally in the dark. We were able to calculate very closely the extent of the initial down phase. We can use the same methodology to gauge the next phases of the decline, and also get an idea of when the decline will be coming to an end by watching for the oscillator patterns that warn of an approaching reversal. Currently, these tell us that we are not there yet and this is why we should expect the correction to continue after this “bear market” rally is over!
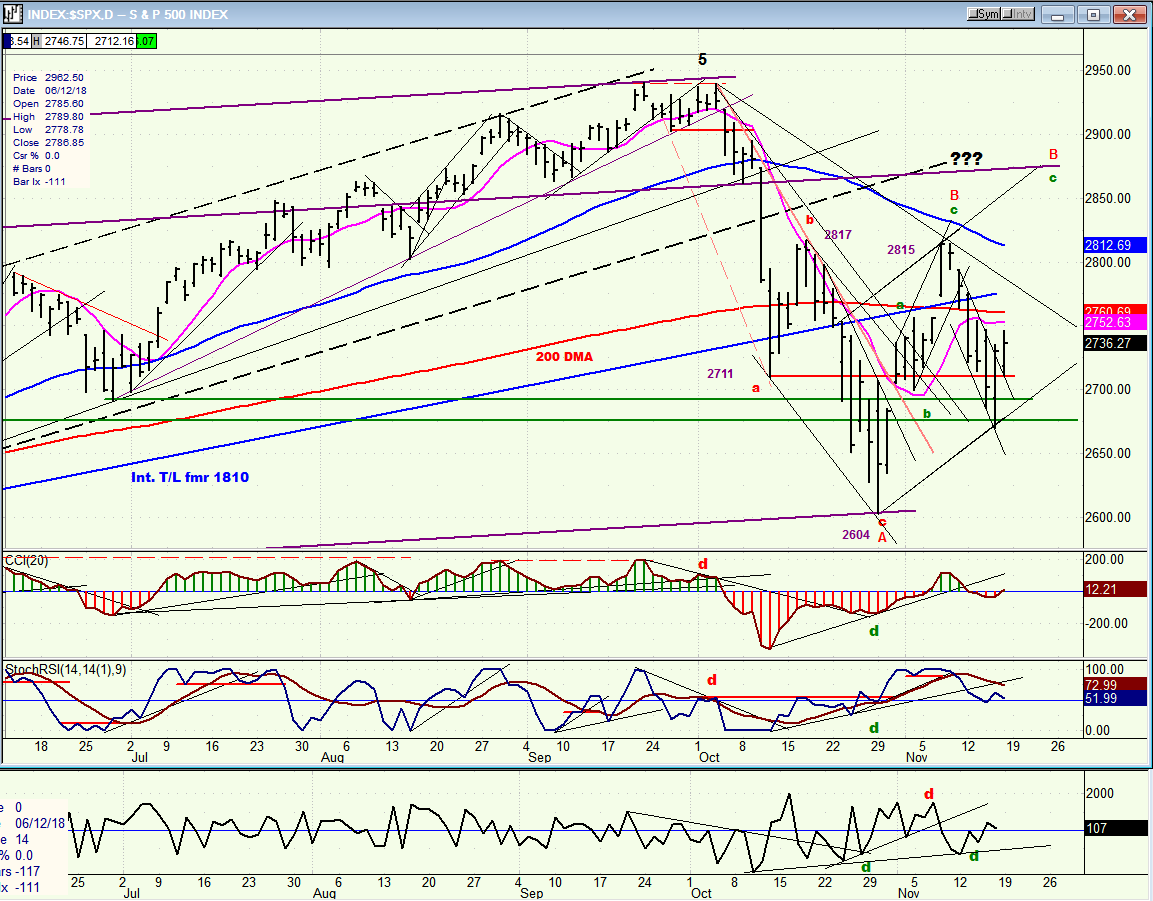
SPX daily chart
The initial decline of 337 points had an a-b-c structure and was labeled wave A. The pattern that followed was a 3-wave structure which could have spanned the entire length of wave B; in which case we would already be in wave C. I have my doubts that this is correct! I think that the top of wave B is still ahead of us, as we will find out over the next few weeks.
The rally from 2670 on Thursday has already retraced 50% of the decline from 2815. And, since it does not looked finished, I think it can continue to about 2760 which would be a .618 retracement of that distance. Depending on what follows, we can make a better assessment of whether the B wave is already in place. But since we usually have a December Christmas rally, odds are that it is still ahead.
The oscillators are currently neutral, but the market tone suggests that another minor decline is likely before the Santa rally.
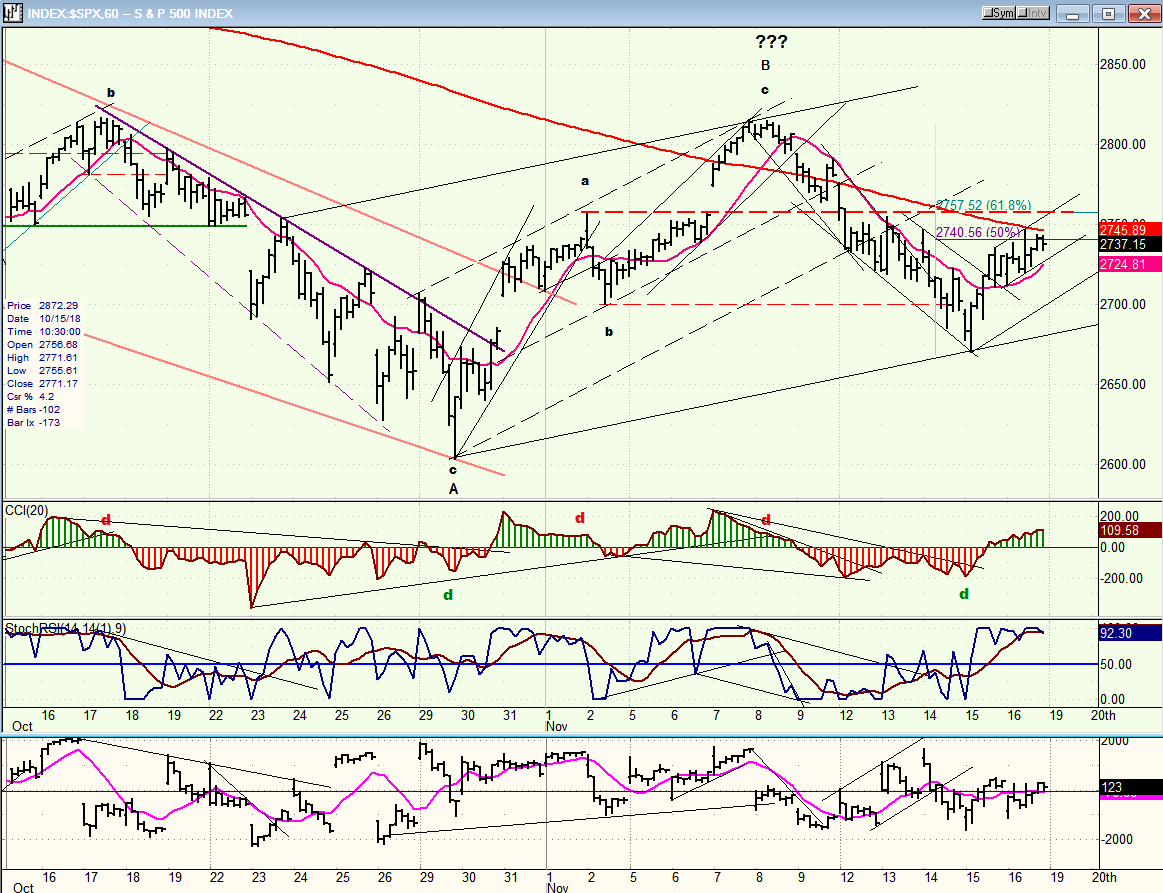
SPX hourly chart
The hourly chart shows that the index is in a sluggish uptrend which, as of Friday, had retraced 50% of the decline from 2815. Since the oscillators are still in an uptrend, and because there is still no negative divergence in the CCI, it could push a little higher to about 2760. However, the poor performance of the A/Ds suggests that we could just as well reverse from where we are.
The uptrend from 2604 is still contained within a fairly shallow rising channel and, as long as the index remains within that channel, it is expected to move higher. A move out of the channel would risk going for a new low right away; but with the bullish December period ahead of us, we should look for SPX to retest 2815 and possibly to go higher before we resume the longer term decline.
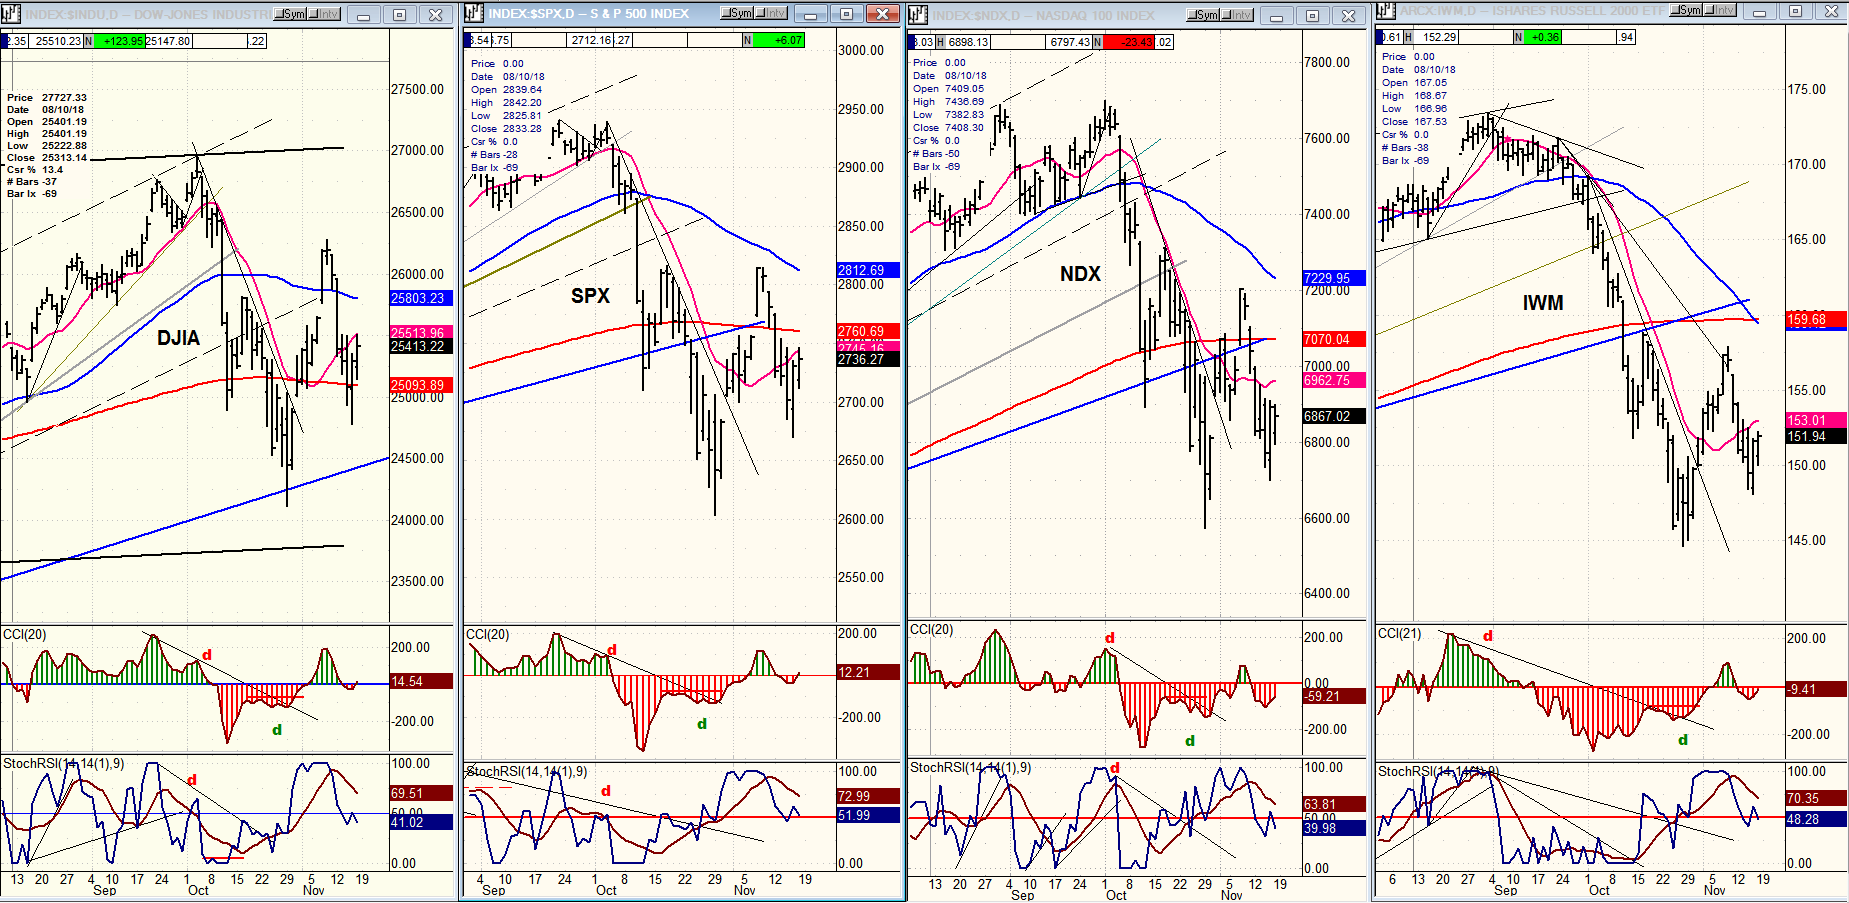
DJIA, SPX, NDX, IWM (daily)
No change in the relative strength order of these four indexes. Even though IWM remains weaker overall, it has been trading pretty much in line with the others since the SPX 2604 low. I take that to mean that nothing much different will take place in trading behavior over the short-term. But should the IWM visibly depart from the others, it should signal that a change is about to take place in the market.
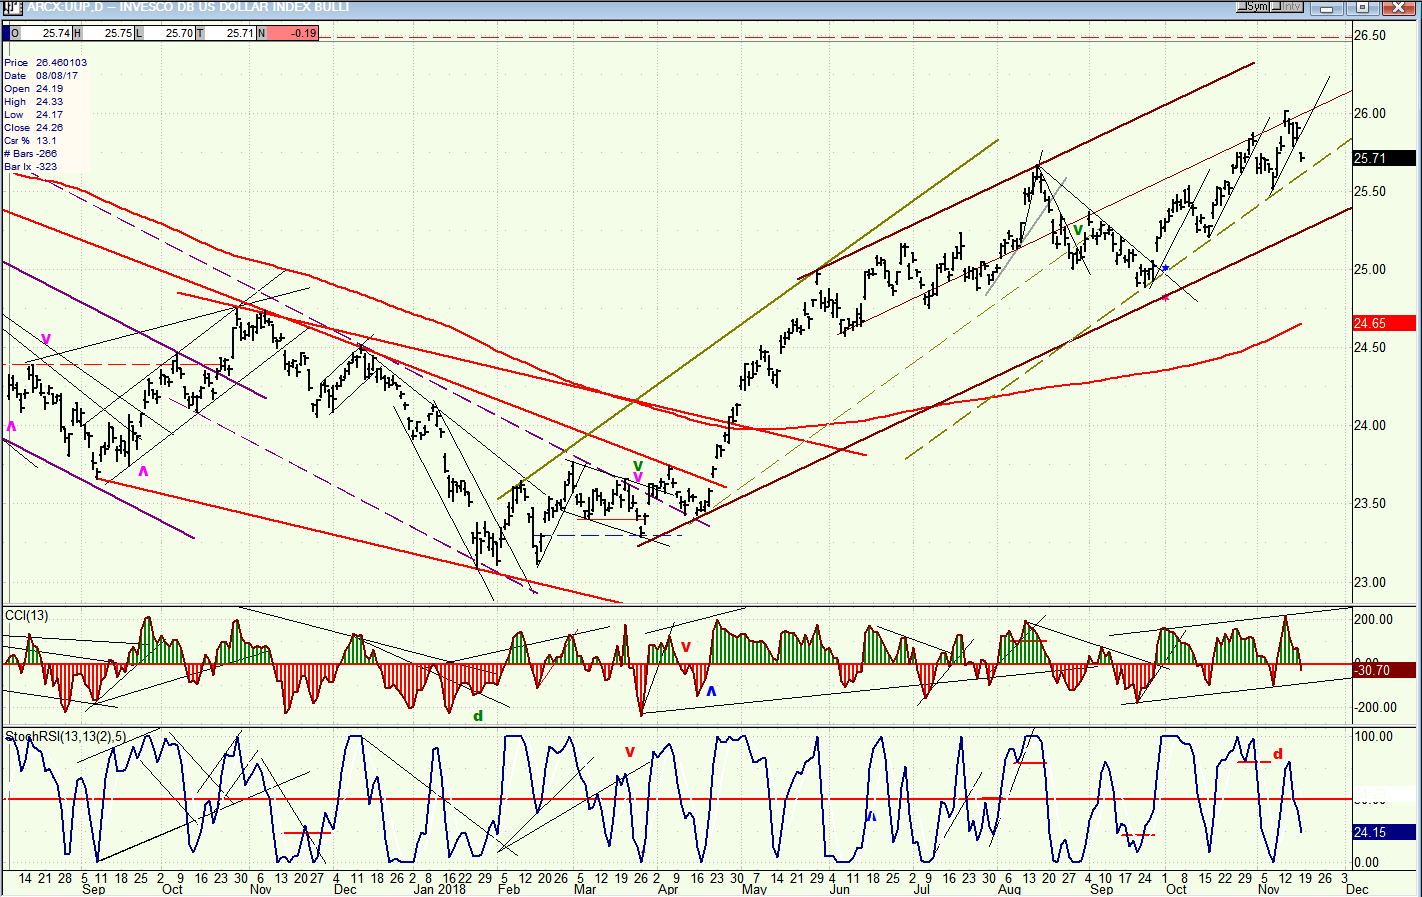
UUP (dollar ETF) daily
UUP made a new high last week but appears to be settling into an intermediate/long-term channel in which price has started to lose momentum, which may keep it confined to the lower half of its channel as it finishes the move which could still reach 26.50 before it starts a significant correction. On Friday, the indicators went slightly negative after divergence appeared in the lower one. This could mean that more price consolidation is directly ahead.
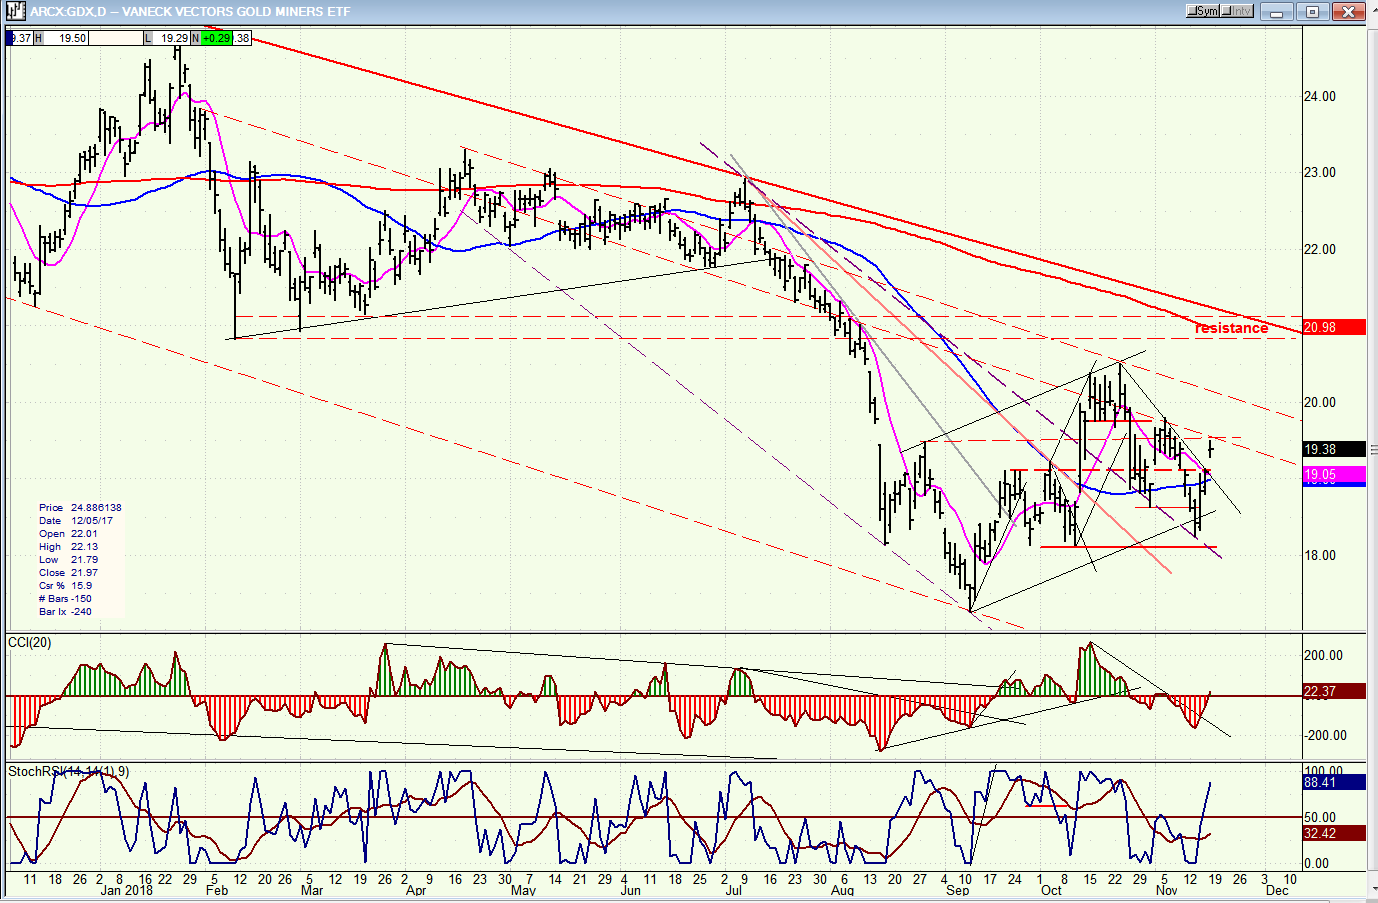
GDX (Gold miners ETF) daily
GDX will be spared further weakness if UUP begins to correct. Since its indicators are exactly the inverse of UUP’s, GDX is probably ready to extend its move of the last couple of days, with the resistance band (above) as its near-term target. That would be a move to 21-21.50 short-term. However, GDX has steadily expanded its base and has now enough of a count to eventually get to about 25.00.
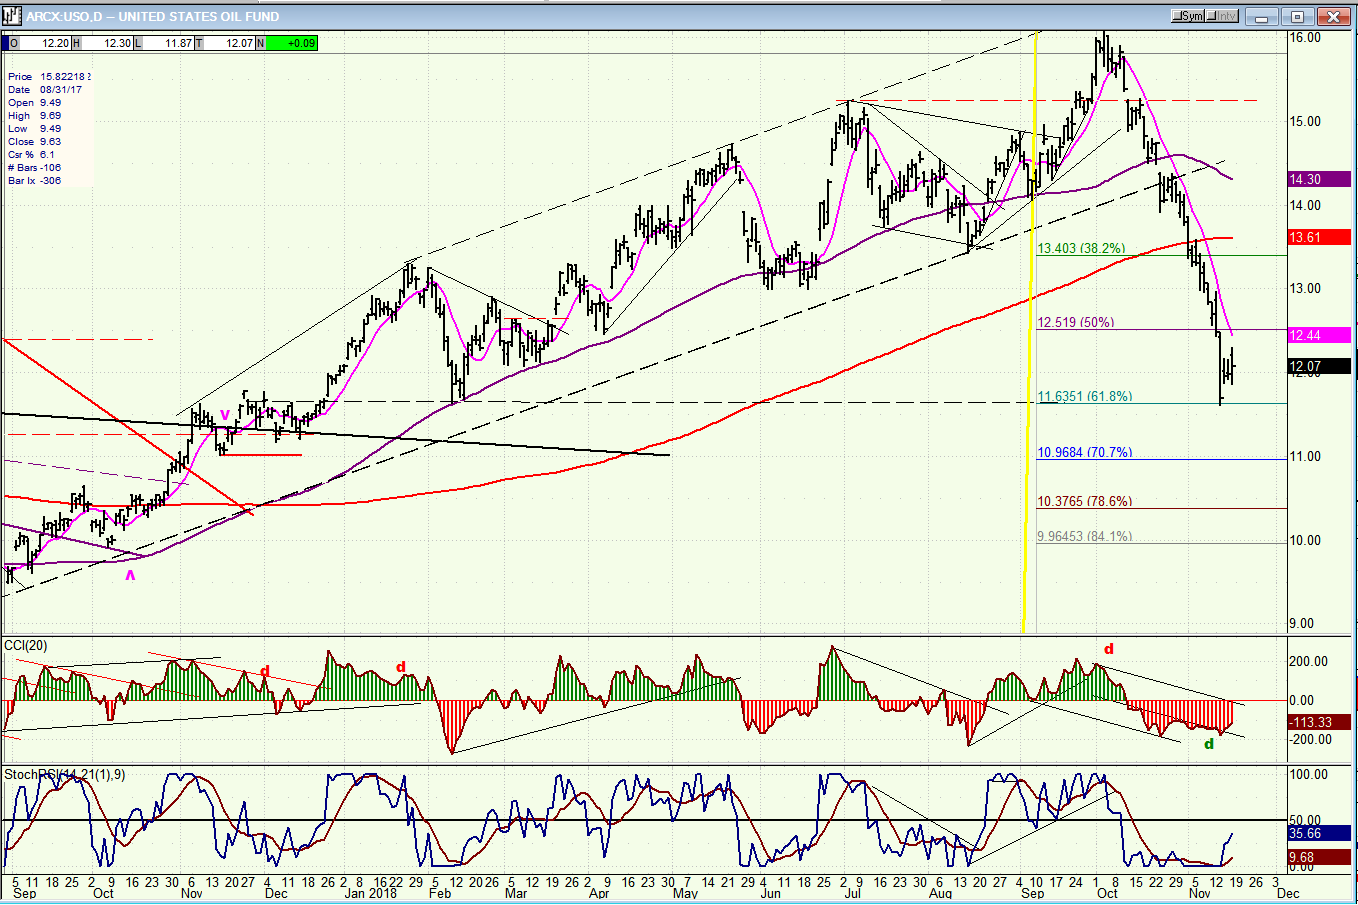
USO (United States Oil Fund) daily
USO is beginning to find support after a steep correction from a 16.24 high that was made just six weeks ago. Since it has retraced .618 of its former advance and essentially met a P&F target, it could start building a base in this area and quickly rally to about 13.00 before long.
Summary
The best way to describe SPX’s position is that it is making a consolidation in an intermediate downtrend which will resume when that consolidation is over. Since we are entering a seasonally bullish period, the upper range of this consolidation could reach 2860-80 before the primary trend resumes.
FREE TRIAL SUBSCRIPTON
With a trial subscription, you will have access to the same information that is given to paid subscribers, but for a limited time period. I think you will find that knowing how far a move can carry is one of the most useful benefits of this service, whether you are a trader or an investor -- especially when this price target is confirmed by reliable indicators which give advance warning of a market top or bottom. Furthermore, cycle analysis adds the all- important time element to the above price projections.
For a FREE 4-week trial, further subscription options, payment plans, and for general information, I encourage you to visit my website at www.marketurningpoints.com.
The above comments about the financial markets are based purely on what I consider to be sound technical analysis principles. They represent my own opinion and are not meant to be construed as trading or investment advice, but are offered as an analytical point of view which might be of interest to those who follow stock market cycles and technical analysis.
*********

When Andre Gratian was a stock broker years ago, a friend introduced him to technical analysis of the market. Consequently, it is not an exaggeration to say that Andre fell in love with this approach! Ever since then, it has become an increasingly important part of his professional life. Gratian has studied the works of Wyckoff, Edwards & Magee, Edward J. Dewey (cycles) and many others. However, one of my most profitable undertaking has probably been to study Point & Figure charting, which he finds invaluable in analyzing stocks and indices. If he were restricted to one methodology, this is the one that he would choose. This well-rounded background has given him what he feels to be a special insight into the stock market, facilitating the recognition of meaningful patterns and the ‘turning points’ in all trends, whether they be short or long term. Andre feels very comfortable discussing the stock market and passing on meaningful information to others. His subscribers include individuals and money managers throughout the world. Moreover, his Newsletters are currently published on several financial sites, here and abroad.


