Technical Analysis Of The Markets


Current Position of the Market
SPX: Long-term trend – Final long-term phase on the way? How much longer is the question.
Intermediate trend – The trend which started at 2722 is ready for a pause
Analysis of the short-term trend is done on a daily basis with the help of hourly charts. It is an important adjunct to the analysis of daily and weekly charts which discusses the course of longer market trends.
Ready For A Pause!
Market Overview
The last time the SPX showed negative divergence in its daily indicators was when it reached 2860. That warning resulted in a 75-point correction which lasted about a week. On Friday, SPX made a new high at 2910 and closed at 2907. Even more pronounced negative divergence is showing on the same indicators after Friday’s close. This is clearly another warning that we should expect another short-term correction if that divergence is not erased immediately by a continuation of Friday’s blip – a response to positive economic numbers from China and favorable bank earnings. But that does not seem likely and we should be prepared for a short-term correction of roughly the same magnitude as the last time. After that, there could be another extension of the trend, perhaps to a new all-time high .
Chart Analysis (The charts that are shown below are courtesy of QCharts)
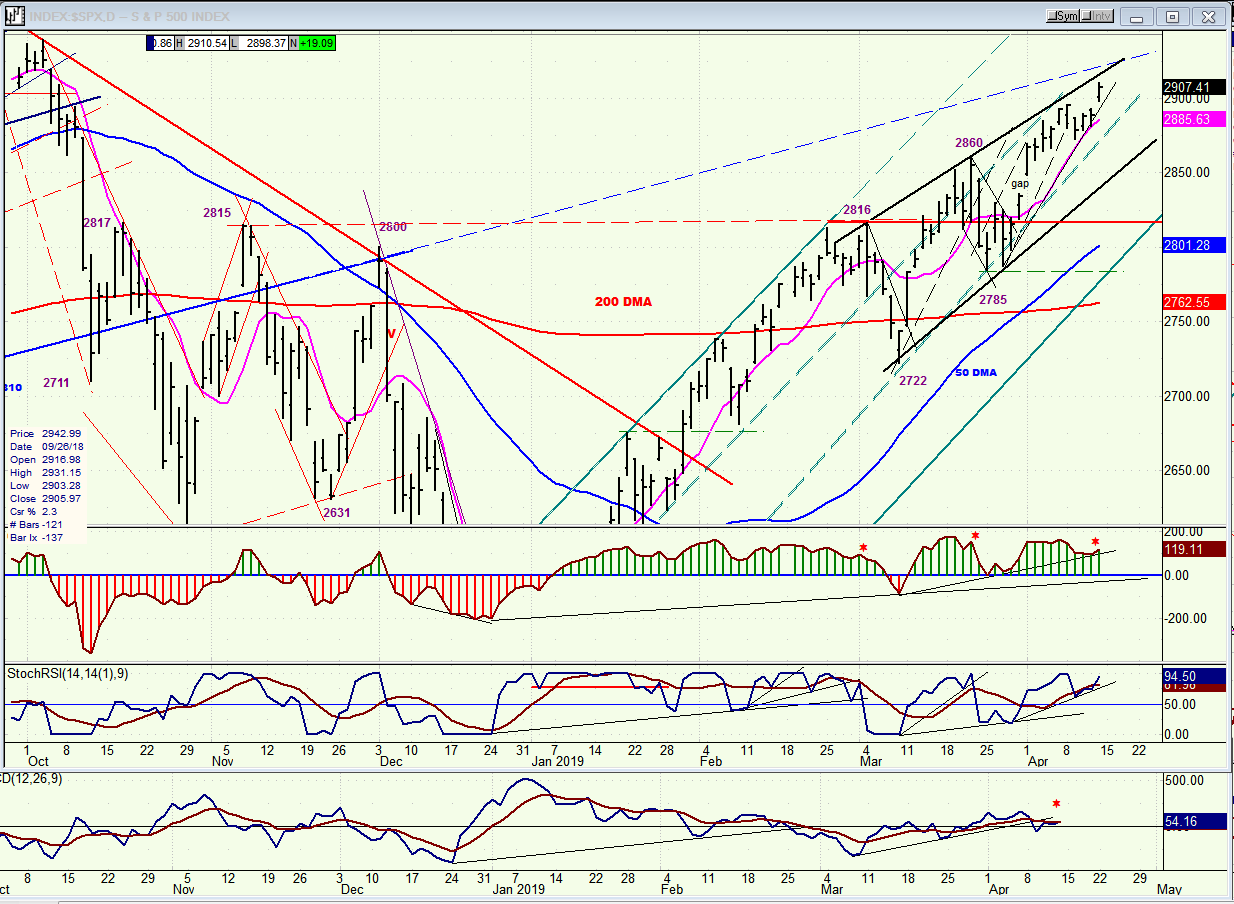
SPX daily chart
Last week, I mentioned that we could be making an ending diagonal. However, with a new high on Friday, that labeling is no longer appropriate, although the market action will not change all that much since whatever the scenario, a pull-back similar to that of three weeks ago is due and should be followed by one higher short-term high before a more significant correction occurs.
I already mentioned the similarity of the oscillator patterns. The current one is showing even more pronounced divergence than the last, but that will not necessarily bring about a larger correction. We can probably estimate that the pull-back in price will take it through the heavy trend line, fill the gap that was formed by the break-away start of the uptrend which is now concluding, and come to rest in the vicinity of the horizontal red line between 2815 and 2820 where there is good support. After a couple of day’s bounce in this area, we should be ready for the final phase of the move which started at 2346. When that phase is complete, we should be on guard for the deepest retracement since the beginning of that entire uptrend.
SPX hourly chart
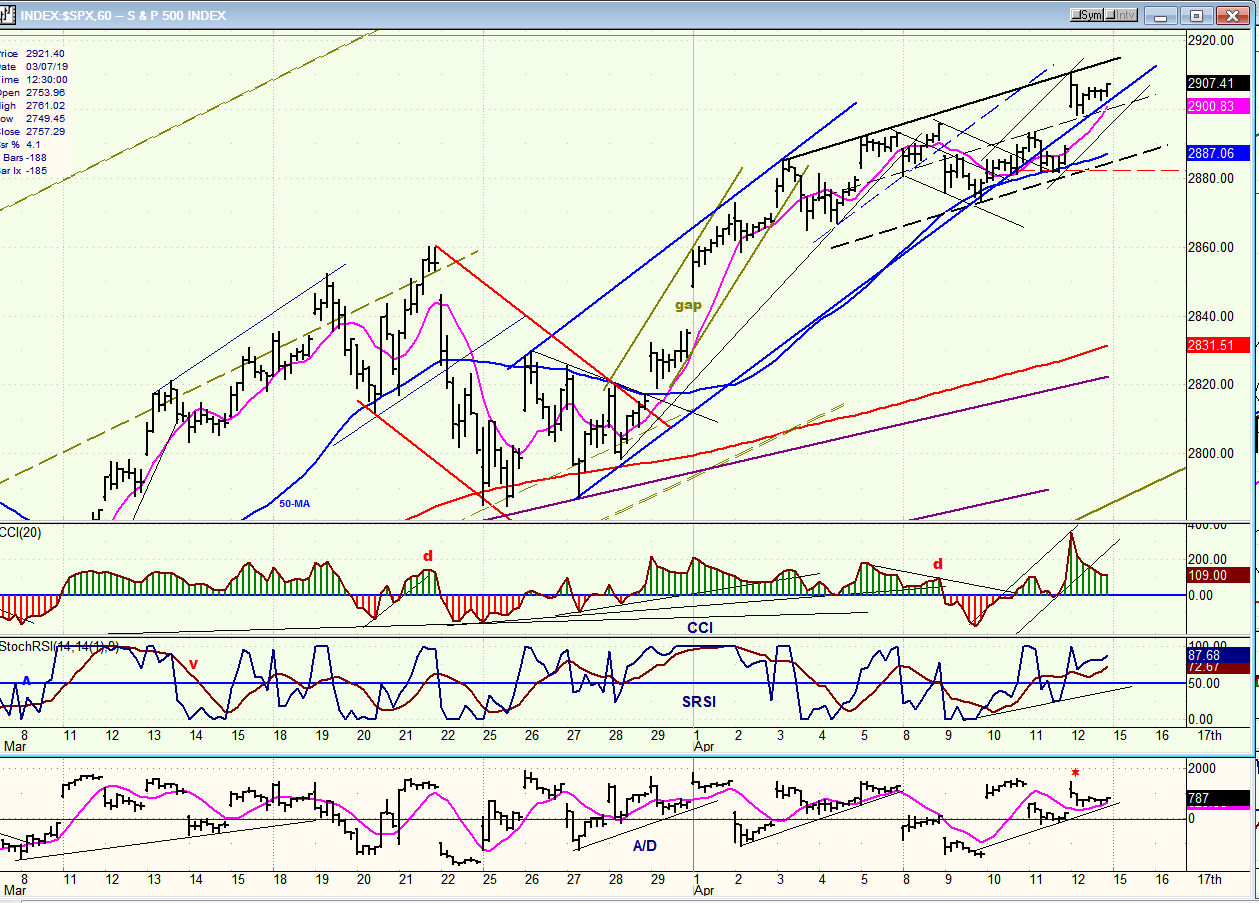
The uptrend from the 2806 level formed a well-defined channel which contained prices until the lower line was finally broken around 2885. One could have assumed that a correction was starting when that occurred, but prices held above the 50-hr MA, not once but twice, and that paid off for the bulls since the market reacted to a positive catalyst on Friday morning and pushed to a new high. Note, however, that the high of the day came in the first hour and during the rest of the session, profit-takers kept trading in a narrow range.
Friday’s action pushed the index back inside the channel line and, unless it pulls sharply away from it on Monday morning, the next penetration of that line will most likely mark the start of the anticipated correction. The final confirmation that the correction has started will be when prices drop below the blue 50-hr MA and all three oscillators go negative.
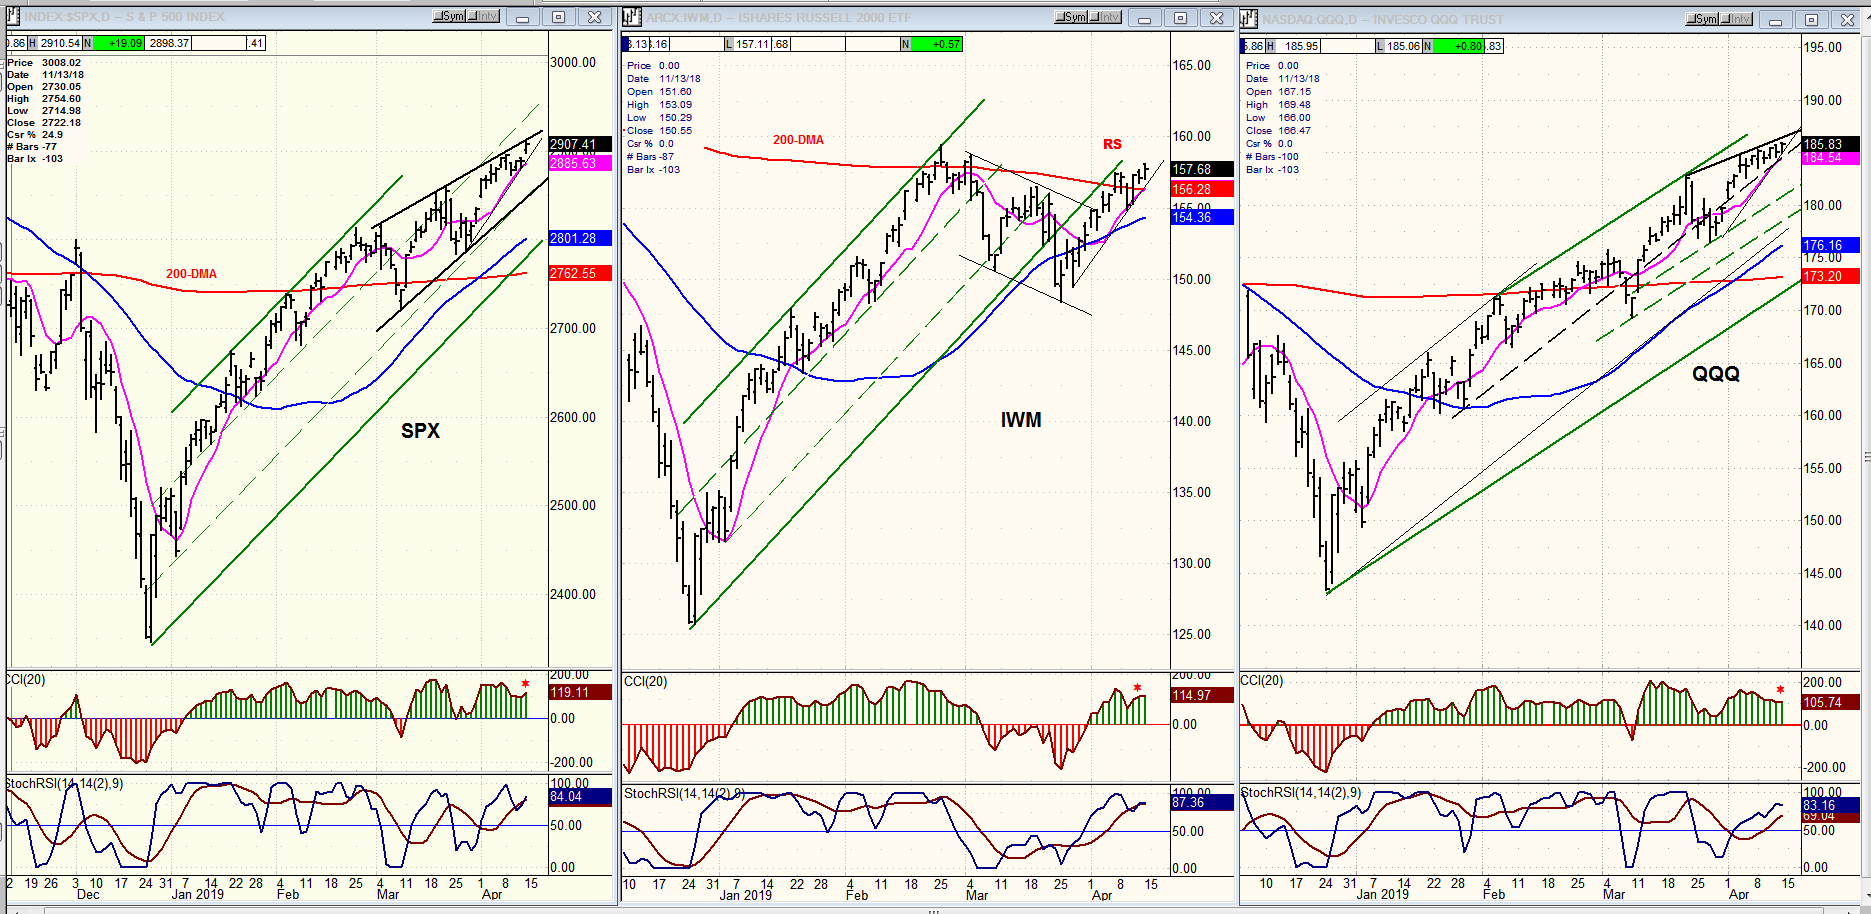
SPX, IWM, NDX (dly)
Viewed from one perspective, IWM is weaker than the other indices. Both SPX and QQQ have moved well past their early March highs, but IWM remains below it. Is that a sign of longer-term weakness developing in the stock market? Or is IWM simply progressing with a different structure? I guess we’ll just have to wait until we see what happens after the next correction -- not the minor one which can start as early as next week, but the larger one which comes after that. Perhaps IWM will resist the weakness better, and lead the market higher afterwards. We’ll just have to see! For now, there is no question that IWM is underperforming, and so is DJIA by the way! This may be telling us that we are closer to a major top than most expect.
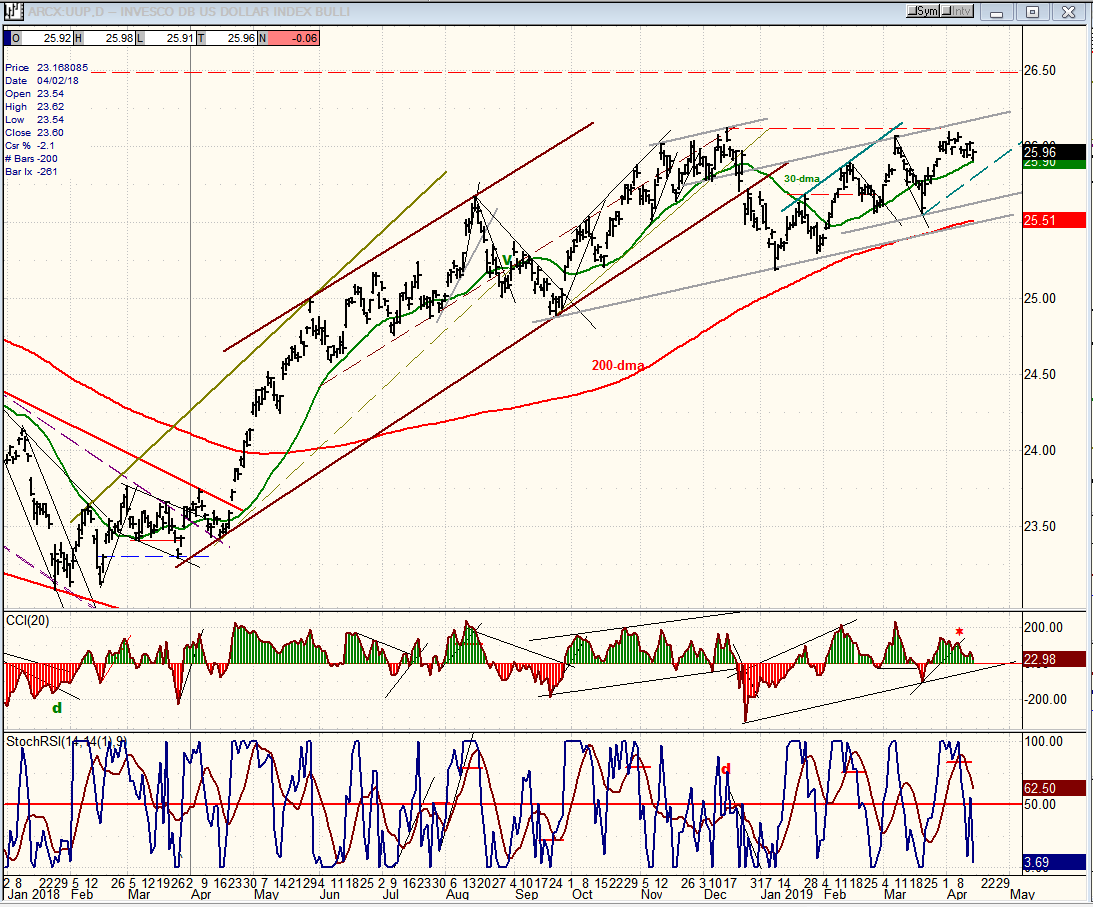
UUP (Dollar ETF) (daily)
After a year of rising prices, UUP has decelerated in a sideways pattern which is now 3-months long and which itself, appears to be decelerating. The latest short-term peak has brought negative divergence to its CCI, while the early SRSI has already given a preliminary sell signal. This means that a correction down to the 200-dma may be about to start. The last dip held above the 30-dma. Breaking below it would be a sign that a short-term correction (at least) is underway.
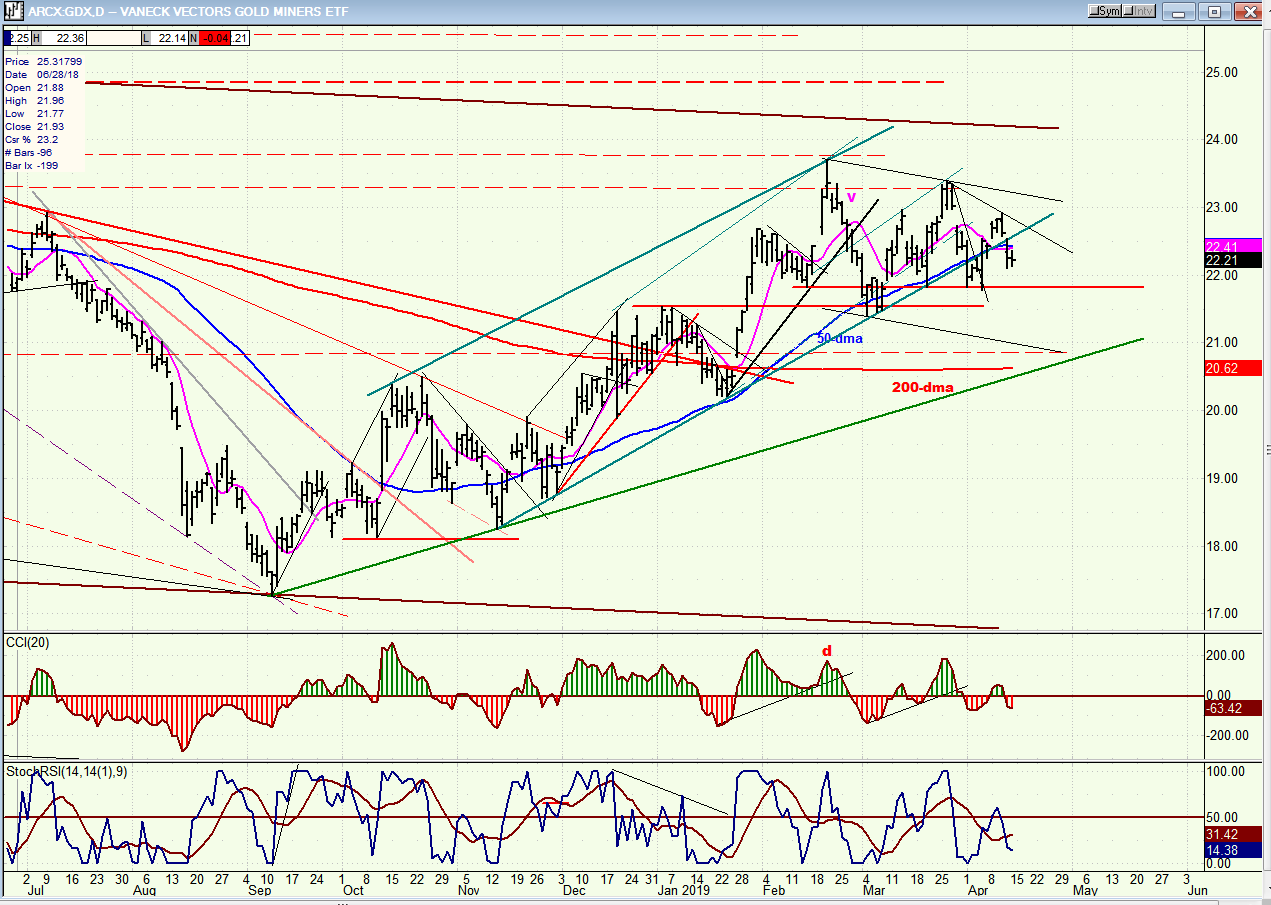
GDX (Gold miners ETF) (daily)
After a steady rise from 17 to 24, GDX has been making a shallow consolidation formation which may be a triangle. If so, and if this is the e-wave of the triangle, GDX is just about ready to push to 25-26 right away. A short-term pull-back in UUP could be the trigger.
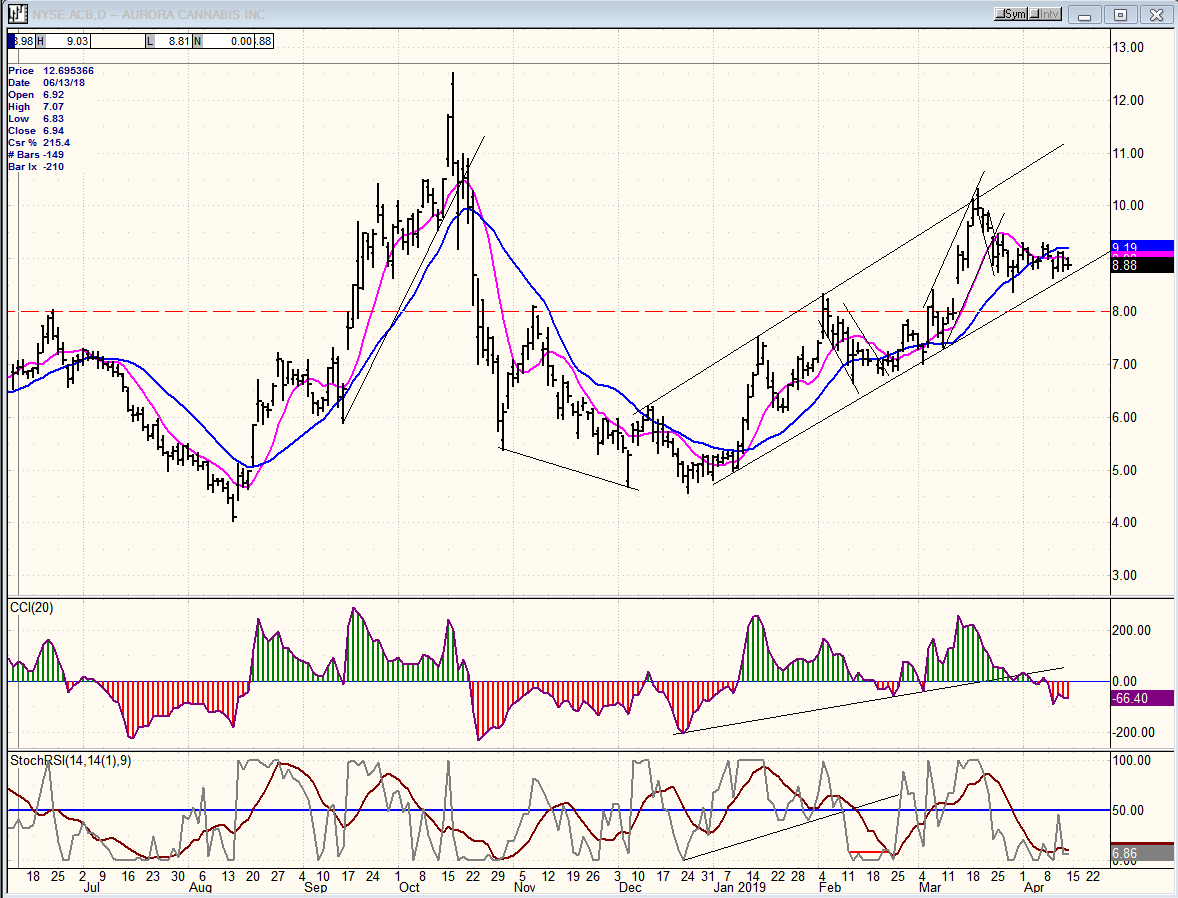
ACB (Aurora Cannabis) (daily)
ACB continues to also make a shallow consolidation, but may have to wait until the market has corrected before it can push higher; unless it is moved by news before that. It has a base which is capable of taking it to about 14.00 for the remainder of this uptrend.
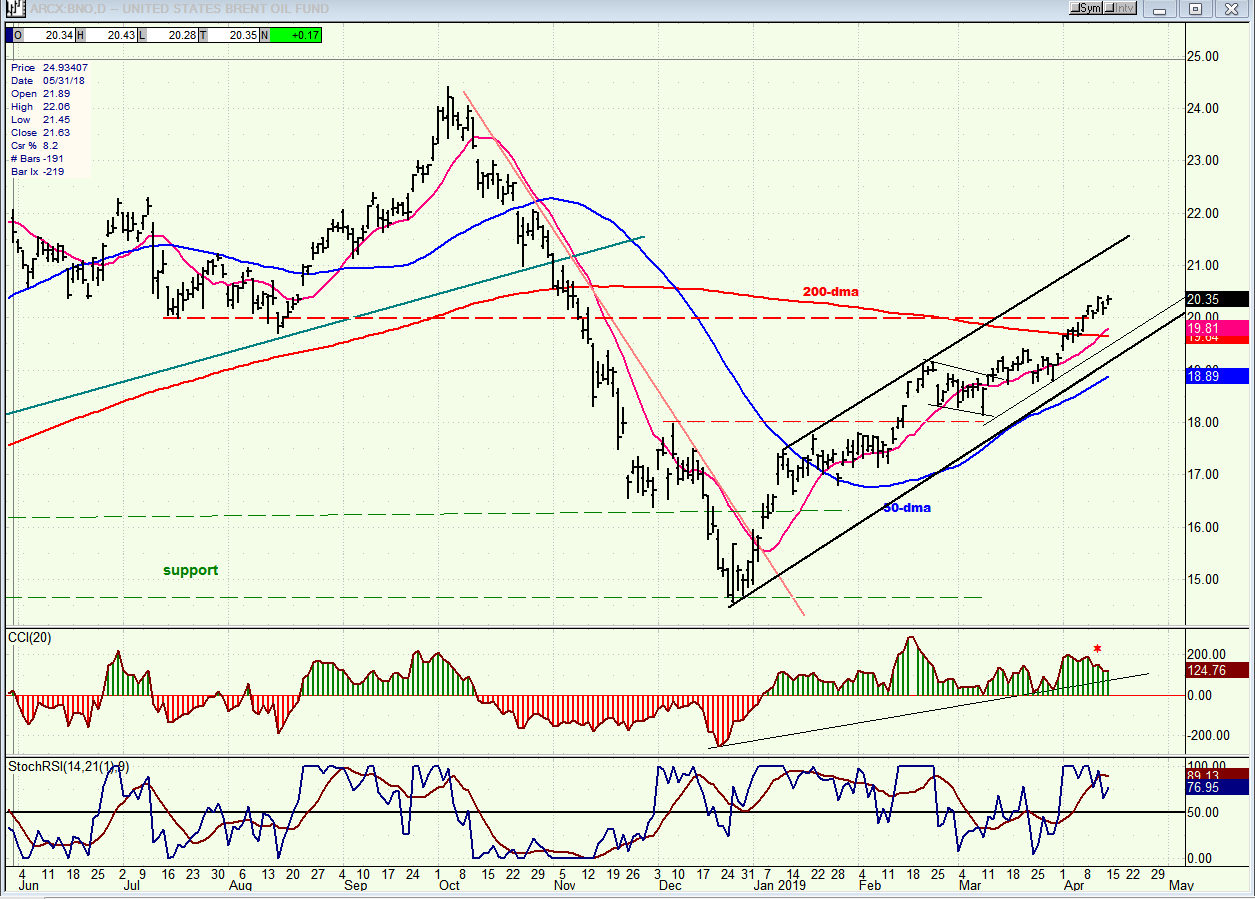
BNO (United States Brent Oil Fund) (daily)
BNO has extended its move deeper into resistance, but the negative divergence which is forming in its oscillators is telling us that a short-term reversal can come at any time.
Summary
Even though an ending diagonal is no longer the preferred structure, future market action is expected to conform to expectations that we have arrived at a short-term top and are ready for a correction.
FREE TRIAL SUBSCRIPTON
With a trial subscription, you will have access to the same information that is given to paid subscribers, but for a limited time period. I think you will find that knowing how far a move can carry is one of the most useful benefits of this service, whether you are a trader or an investor -- especially when this price target is confirmed by reliable indicators which give advance warning of a market top or bottom. Furthermore, cycle analysis adds the all- important time element to the above price projections.
For a FREE 4-week trial, further subscription options, payment plans, and for general information, I encourage you to visit my website at www.marketurningpoints.com.
The above comments about the financial markets are based purely on what I consider to be sound technical analysis principles. They represent my own opinion and are not meant to be construed as trading or investment advice, but are offered as an analytical point of view which might be of interest to those who follow stock market cycles and technical analysis.

When Andre Gratian was a stock broker years ago, a friend introduced him to technical analysis of the market. Consequently, it is not an exaggeration to say that Andre fell in love with this approach! Ever since then, it has become an increasingly important part of his professional life. Gratian has studied the works of Wyckoff, Edwards & Magee, Edward J. Dewey (cycles) and many others. However, one of my most profitable undertaking has probably been to study Point & Figure charting, which he finds invaluable in analyzing stocks and indices. If he were restricted to one methodology, this is the one that he would choose. This well-rounded background has given him what he feels to be a special insight into the stock market, facilitating the recognition of meaningful patterns and the ‘turning points’ in all trends, whether they be short or long term. Andre feels very comfortable discussing the stock market and passing on meaningful information to others. His subscribers include individuals and money managers throughout the world. Moreover, his Newsletters are currently published on several financial sites, here and abroad.


