Yes, Gold REALLY Is Getting Ahead of Itself
 share
share
 share
share
 share
share
 share
share
 share
share

Good grief, Squire, how did that WestPalmBeacher get in here?
“He didn’t, mmb, it’s just some kinda AI infiltration…”
Well, we simply must get on to our Amsteg security team. Honestly…
To Gold: With specific respect to this week’s title, our missive from back on 06 September, (the 14th anniversary of 2011’s All-Time Intraday Gold High at 1923), was queryingly entitled “Is Gold (Again) Getting Ahead of Itself?” The key word therein is “Again”. Because prior, we’d originally postulated about Gold having gotten ahead of itself away back on 01 October 2011 (Update No. 98), price having settled that Friday (30 September 2011) at 1627 and thus already -15% from the 1923 record high of just four weeks earlier.
But annoyingly, such postulation was far more prescient than that for which we planned: come 03 December 2015 — yes four years hence — Gold’s fallout from 1923 to 1045 completed an all-in correction of -45%.
“Oh no, mmb, yer not sayin’ this is gonna happen all over again … are you?”
Calme-toi, Squire. ‘Tis not gonna happen all over again, for there’s a big difference between  “Now and Then” –[BeaTles, ’23]:
- “Then”, during that massive decline, Gold was discarded as a yield-less, storagely-expensive, debasively-irrelevant relic. The 1045 bottom was -57% below its Fair Value that day of 2450.
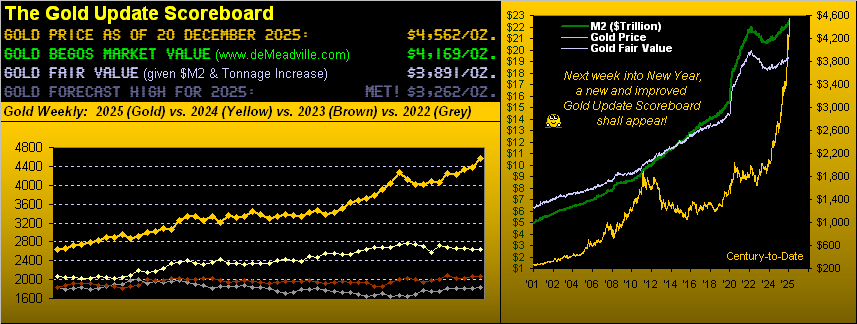
- “Now”, having settled yesterday (Friday) at a record-high close of 4562, ’tis a +337% increase over the past 10 years, 2025 finding everyone having suddenly become a Gold expert, in turn morphing the precious metals into “meme” stocks as we’ve on occasion quipped since this past spring (seasonally and pricewise).
‘Tis been great for Gold, en route bringing Silver up to far more realistic pricing. But the recent overshoot of Fair Value is significant. By such metric, Gold at 4562 is now +17% above its 3891 Fair Value, whilst Silver at 79.68 is +42% above its 56.06 Fair Value. And you know, and we know, and given everybody from Bangor ME to Honolulu and right ’round the world instantly having become a Gold expert knows: the yellow metal since Nixon’s nixing of the Gold Standard (15 August 1971) has been priced sub-par relative to its Fair Value. But today, ’tis priced at that stated +17% premium. And “reversion to the mean” we ‘spect shall be seen.
Regardless of Gold’s mis-valuation, the market is never wrong: today’s 4562 level is the truth. Price’s primary driver these last 54 years is dollar debasement, offset to an extent by the increase in Gold’s supply.
Course, there is additional conventional wisdom to justify still-higher Gold: “Oh, the world is working toward war!”, they say; “Oh, the banks are going to fail!”, they say; “Oh, the fiats are finished!”, they say. And duly legitimate notions they all are. But at the end of the day, when such Gold-gyrating stimuli fall from the FinMedia fray, ’tis inevitably Dollar debasement that leads Gold’s upward way.
Thus — courtesy of the “Reverse Engineering Dept.” — we query:
“What ought be today’s level of the liquid U.S. Money Supply (“M2″) to justify 4562 Gold?”
M2 today is $22.5T and Gold’s Fair Value is 3891. So with a rough “back of the napkin” pencil scribbling — without regard for the ongoing increase in Gold’s tonnage — simple arithmetic proportion puts M2 up to $26.4T such as to be aligned with 4562 Gold today. For those of you scoring at home, that implies a +$3.9T M2 increase.
“And how long will that take, mmb?”
Squire, upon it all going wrong in the financial world, it could happen in a heartbeat. Regular readers of The Gold Update know of the “Look Ma! No Money!” crash wherein liquidation of the S&P 500’s current market capitalization of $61.5T would be readily supported by “only” $22.5T of M2. Your broker then remits to you an “I.O.U.”, stock trading ceases, and everyone “owed dough ” waits for the Federal Reserve to “print” and (in that vacuum) distribute the +$39T difference. Gold in turn would rapidly race up into the five figures.
That stated, following the Fed’s last series of rate hikes — which rightly rebased the Dollar in reducing M2 from $22.0T in April of 2022 to $20.6T come October 2023 — the money supply since has steadily returned to debasing, indeed at a regressed trending rate of +$15.7B per week.
Thus: at that pace from today’s M2 level of $22.5T to the $26.4T level supportive of Gold now at 4562 would take 250 weeks, i.e. some five years! But wait, it gets worse: account along the way for an increase in the Gold supply (typically some +2,770 tonnes per year) and empirically, it would take even longer for Gold to rightly be at today’s 4562. Yes, Gold REALLY has gotten ahead of itself; but far be it from us to stand in the way of the “bigger fish to fry” global financial stability concerns.
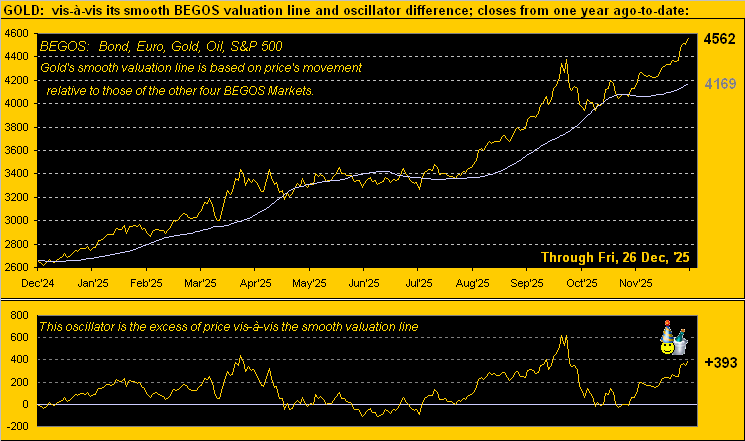
So relax: hardly are we bearish on Gold. We love what’s happening! But — the current “metals mania” aside — as we oft caution given Gold is a major liquid market, price shan’t ascend in a straight line, let alone move lower as such. And for the present being priced some +17% above Fair Value, Gold too is +9.4% (+393 points) above its BEGOS Market Value of now 4169:
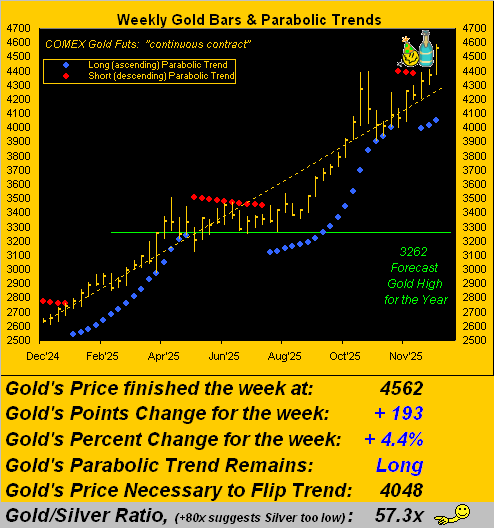
Nevertheless, the year-over-year weekly bars and parabolic trends picture remains nearly perfect. Price’s expected weekly trading range is now a whopping 181 points, which is good news: the ensuing week’s “flip-to-Short” level (4048) is an “out-of-range” -514 points below here. So barring a sudden, substantive selling spate of the precious metals, Gold’s current parabolic Long trend likely has a minimum of three more weeks to run. One indeed wonders: “5000 for New Year?” With three trading days remaining in 2025, we don’t think so, albeit manias clearly get moved with madness (such as the S&P 500 since COVID). Here’s Gold’s marvelous move, our green-line “conservative” forecast 3262 high being left far behind:
Speaking of stocks, let’s next go to the record-high S&P 500 astride (or otherwise) the Economic Barometer. And this past week’s “blow-out” Baro metric was the (in arrears) initial read of Q3 Gross Domestic Product: the +4.3% annualized pace was the swiftest since the +4.9% finalized read for Q3 in 2023. The FinMedia are defining the GDP’s pace as “hot”, yet they’ve a prediction contest as to “how many Fed cuts there’ll be next year”. Rate “cuts” in a “hot” economy? On goes this Investing Age of Stoopid, even as the Conference Board’s Consumer Confidence Index fell in December for the fifth consecutive month. Are you confident? What about the Econ Baro’s 36 missing metrics? Or the “potential” for the next StateSide “shutdown” in a month’s time? How’s that “live” S&P 500 price/earnings ratio of 55.7x gonna work out for ya? And “they” call Gold “yield-less”? Indeed, “…ignorance is bliss…” –[Tom Gray, 1742]:
Now for our two-panel display of Gold, featuring its daily bars on the left from three months ago-to-date, and on the right the 10-day Market Profile. Mind the baby blues dots of regression trend consistency, for upon their falling below the +80% axis likely brings still lower prices. By the Profile, the nearest volume-dominant support level is 4518 as labeled:

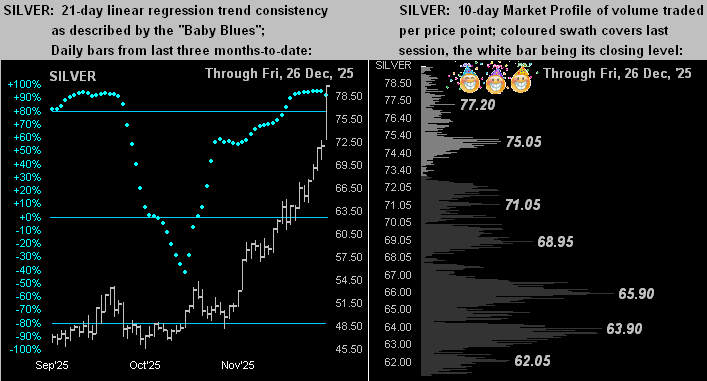
And next is the same display for Silver. ‘Tis marvelous that — by the Gold/Silver ratio — the white metal finally has caught up to a reasonable valuation vis-à-vis Gold. Such G/S ratio (as earlier depicted in Gold’s weekly bars graphic) is now 57.3x, its lowest reading since 11 April 2013; the century-to-date evolving mean of the ratio is 69.4x. ‘Course by the noted +42% deviation above Fair Value, ’tis fair to say Sweet Sister Silver has overshot herself. Yet as we similarly mused for Gold: “100 for New Year?” Oh such hype is palpable! However, from here at 79.68, such “milestone” (understatement) is “only” another +25.5% higher.
“But has that ever happened before in just three days, mmb?”
Very nearly so, Squire! For the three-day stint within the thrashing of 2008’s “Black Swan” turbulence: after 16 September, come 19 September, Silver had gained as much as 24.2%. Either way, here’s Silver’s stance at present, (practically through the top of her two panels):
And now into New Year we go, the record-high precious metals miraculously “Going to a Go-Go” –[The Miracles, ’65]. As teased in the opening Gold Scoreboard, we’re revamping its look and expanding its summary of what we deem as critical “need-to-know” info on Gold, Silver, and too, the S&P 500: thus you’ll have a tidy summary at the top every Saturday. Indeed next Saturday shall be our month/quarter/year-end edition of The Gold Update (plus one trading day in January), including our Gold forecast high for 2026. So don’t give it a miss, as miracles do happen!

A Safe and Happy New Year to Everybody!
…m…
www.TheGoldUpdate.com
www.deMeadville.com
and now on “X”: @deMeadvillePro
********
share
share
share
share
share

Mark Mead Baillie has had an extensive business career beginning in banking and financial services for two years with Banque Nationale de Paris to corporate research for three years at Barclays Bank and then for six years as an analyst and corporate lender with Société Générale.
For the last 22 years he has expanded his financial expertise by creating his own financial services company, de Meadville International, which comprehensively follows his BEGOS complex of markets (Bond/Euro/Gold/Oil/S&P) and the trading of the futures therein. He is recognized within the financial community of demonstrating creative technical skills that surpass industry standards toward making highly informed market assessments and his work is featured in Merrill Lynch Wealth Management client presentations. He has adapted such skills into becoming the popular author each week of the prolific “The Gold Update” and is known in the financial website community as “mmb” and “deMeadville”.
Mr. Baillie holds a BS in Business from the University of Southern California and an MBA in Finance from Golden Gate University.


