Technical Analysis Of The Markets


Current Position of the Market
SPX: Long-term trend – Final long-term phase on the way? How much longer, is the question.
Intermediate trend – The trend which started at 2346 could be close to making a final high (as a B-wave?) before another significant correction begins.
Analysis of the short-term trend is done on a daily basis with the help of hourly charts. It is an important adjunct to the analysis of daily and weekly charts which discusses the course of longer market trends.
Failed Attempt
Market Overview
The last newsletter focused on the warning issued by Erik Hadik (Insiide Track) that market cycles were coming together to reproduce another version of the September-December sudden and sharp market correction which was brutal but short-lived. Since then, the market (in general) has recovered the lost ground completely, and some of the major indexes have even made new all-time highs, SPX being one of them. No doubt, Erik sees something on the near-term horizon that could have a negative effect on stocks. Whether or not it will come to pass is another question! But could last week’s quick 55-point drop presage what comes next – as early as in the next couple of weeks? The selling spell was due to a negative reaction to the FOMC report but was quickly offset by a positive jobs report.
Some top Elliott Wave Theory analysts are also cautious, seeing the near-completion of a structure which should be followed by a sharp correction, perhaps even the end of a B-wave from 2346 in the low 3000’s (SPX), followed by a devastating C-wave. In that sense, last week’s correction may have been the set-up required for the final phase of the structure to get underway.
With top-notch analysts of two different analytic media forecasting the same near-term outcome for the stock market, it is best not to react to this warning with a big yawn!
Chart Analysis (The charts that are shown below are courtesy of QCharts)
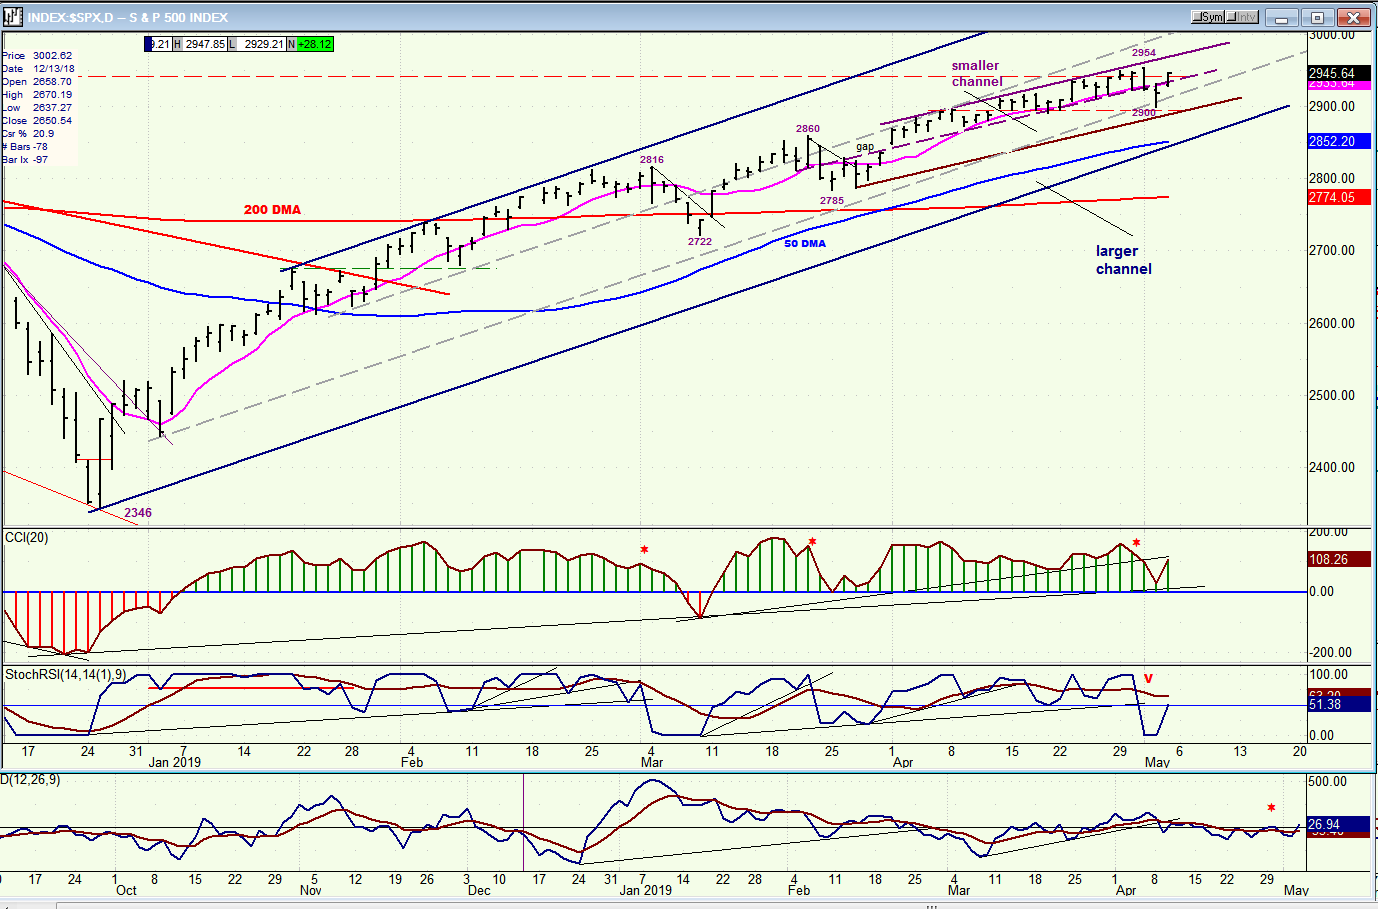
SPX daily chart
Let’s start with channel analysis. Prices have travelled within an intermediate-term channel since the December low. Within this larger channel, there is a smaller channel which is angling toward the larger channel’s lower trendline. Last week, for the first time in over a month the center line of that smaller channel was violated, but the next day the index bounced back above it and, as of Friday’s close, there was still no sign that the uptrend was is in jeopardy
Before it can reverse, the index will first need to close outside of the smaller channel, and then outside of the larger channel. This is not likely until higher prices are seen, and there is plenty of time for that to occur since the cycles are not expected to peak until the middle of the month. In last week’s letter, I mentioned that, on a purely technical basis, I did not see any sign of an imminent reversal, and I can repeat this assertion this week. The daily oscillators did weaken somewhat but, with Friday’s price recovery, a mid-week dip was quickly neutralized.
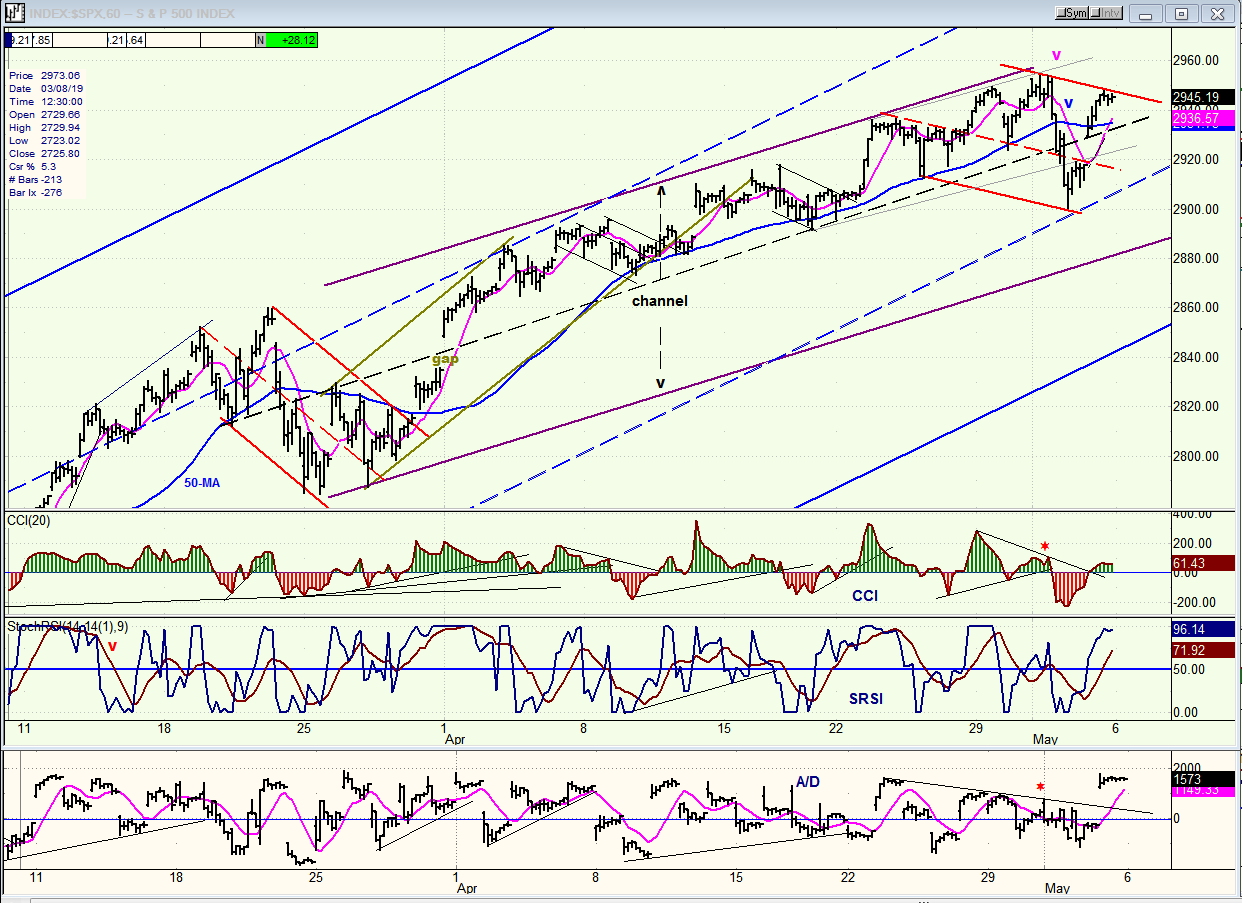
SPX hourly chart
The hourly chart gives us a detailed view of the small channel, but before we get to it, I want to point out something else. To simplify the analysis, price channels can usually be divided into two or three fairly equal sections. On this chart we have an example of both. Parallels to the main channel lines have been drawn from valid anchor points (this is the basis for the Andrew’s Pitchfork methodology). The large channel has been separated into three sections and the smaller one into two. These parallels act as boundaries to price movement within the channel. In this case, we can see that prices respected the upper dashed parallel in early April, and last Thursday, the lower dashed parallel contained the short-term decline. This is even more visible in the case of the smaller channel where prices remained contained in its upper half for about six weeks. Normally, prices will gradually progress from the upper channel division to the lower until they move outside of the channel completely and a reversal takes place. This is what we must wait for to signal a reversal.
As brief as it was, the penetration by the index into the lower portion of the small channel is an early sign of weakness. If prices fail to break out of the red consolidation channel right away and they pull back one more time below the dashed middle line, it will be a sign of increasing weakness. This pull-back may be facilitated by the fact that two minor cycles are expected to make their lows next week. By the end of the week, if we are back in an uptrend, we can now monitor how much more progress we make on the upside, and how long it takes for the bears to retake control.
Once again, we were warned of last week’s correction by negative divergence in the oscillators when the index made its high, but there was no such warning at the subsequent low.
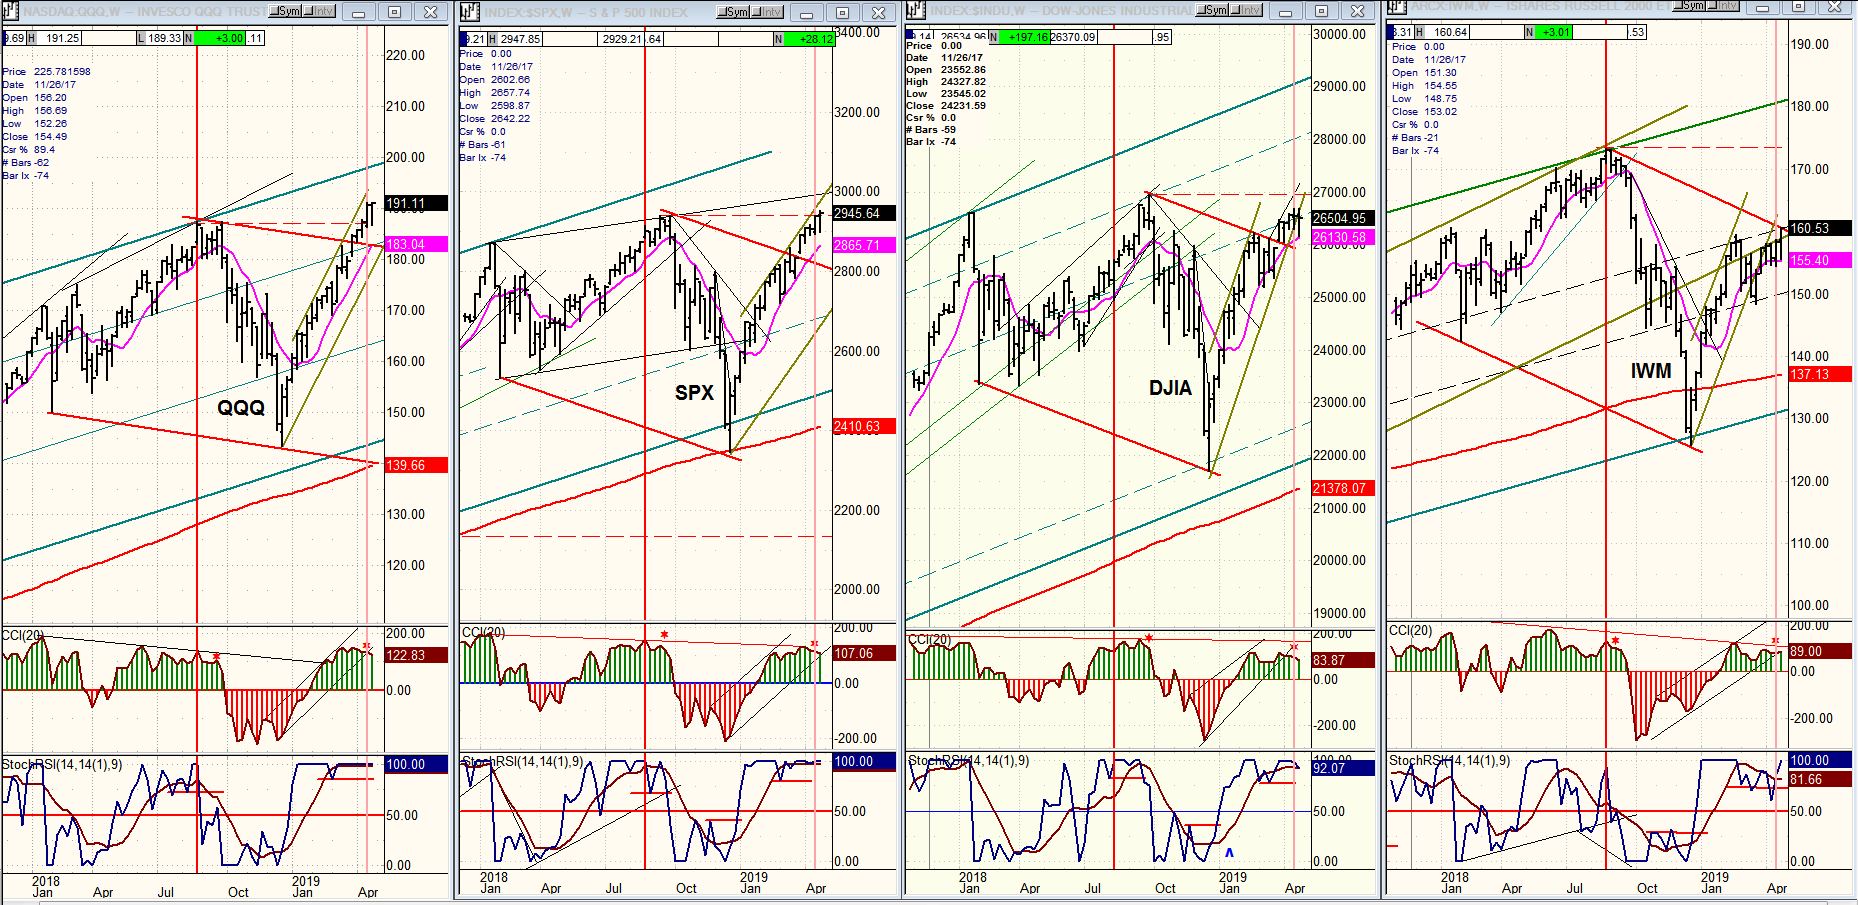
QQQ, SPX, DJIA, IWM (weekly)
I’m going to stick to the weekly charts of the four indexes that were shown last week. The same ranking prevails at the weekly level, but IWM outperformed the others at the daily level which is an indication that new highs can probably be expected.
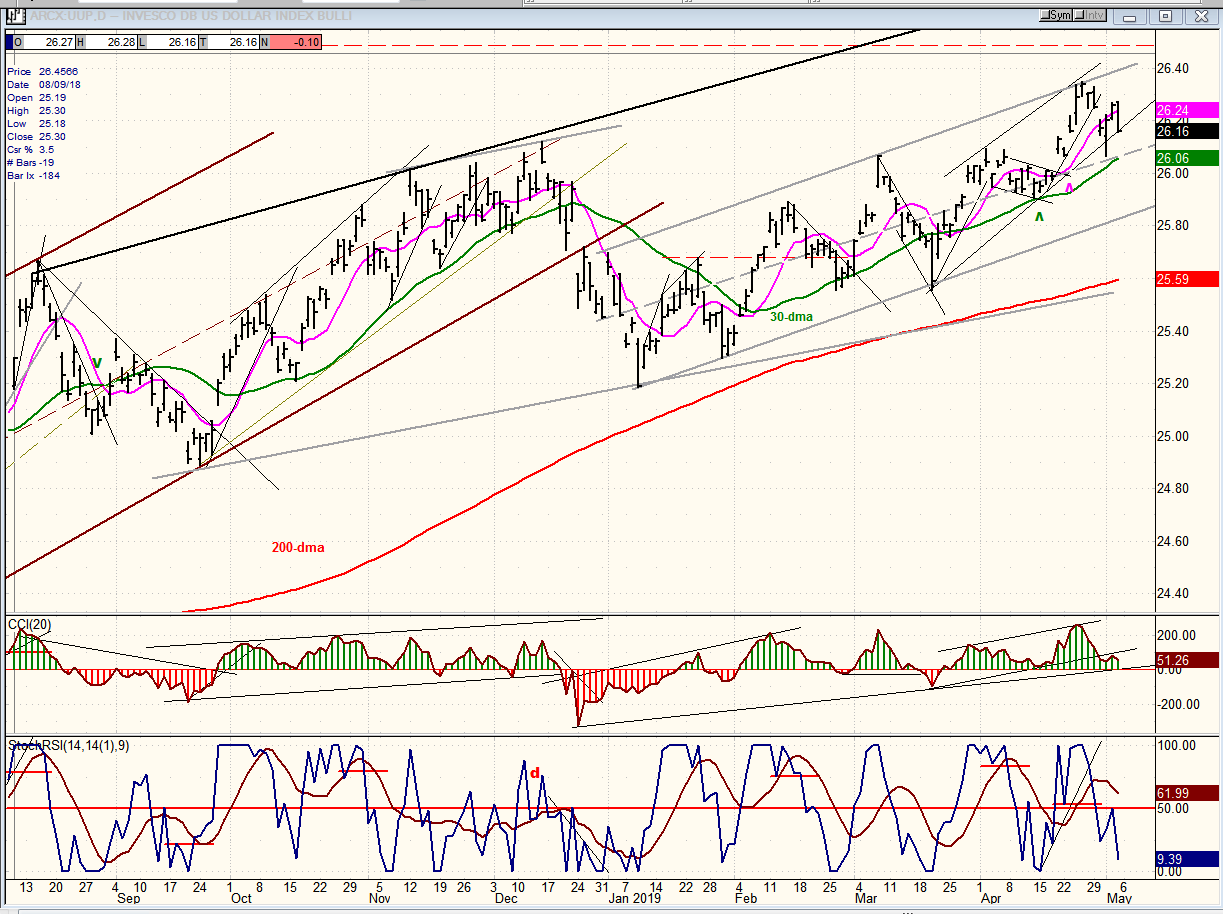
UUP (Dollar ETF) daily
UUP is in a well-established uptrend channel, but may be on its way to retest the recent low. To simplify the analysis, let’s see to see if it falls below the important green 30-dma and what that portends.
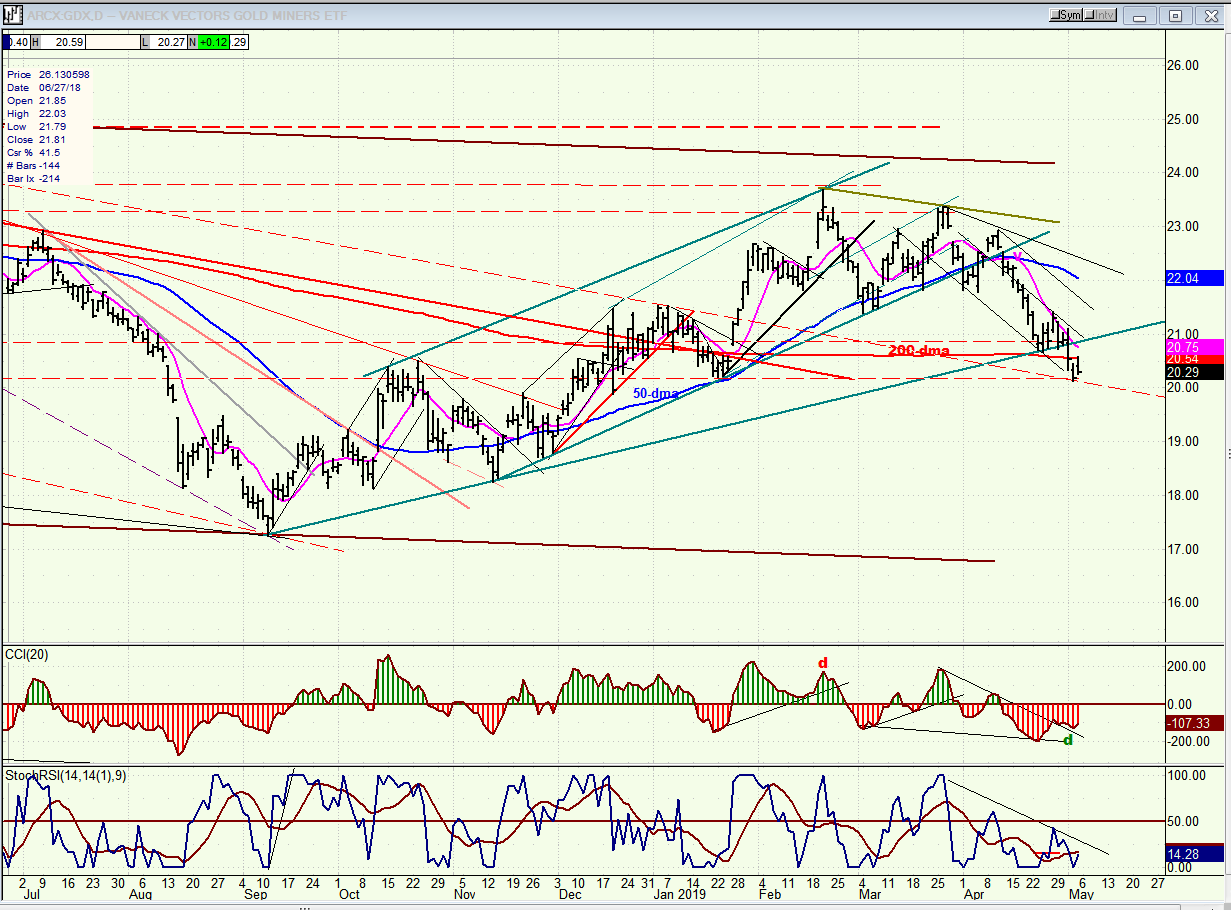
GDX (Gold miners ETF) daily
GDX broke another intermediate trend line last week and started to trade below its 200-dma. It needs to get back above both right away to prevent further technical damage. Positive divergence in the oscillator is promising.
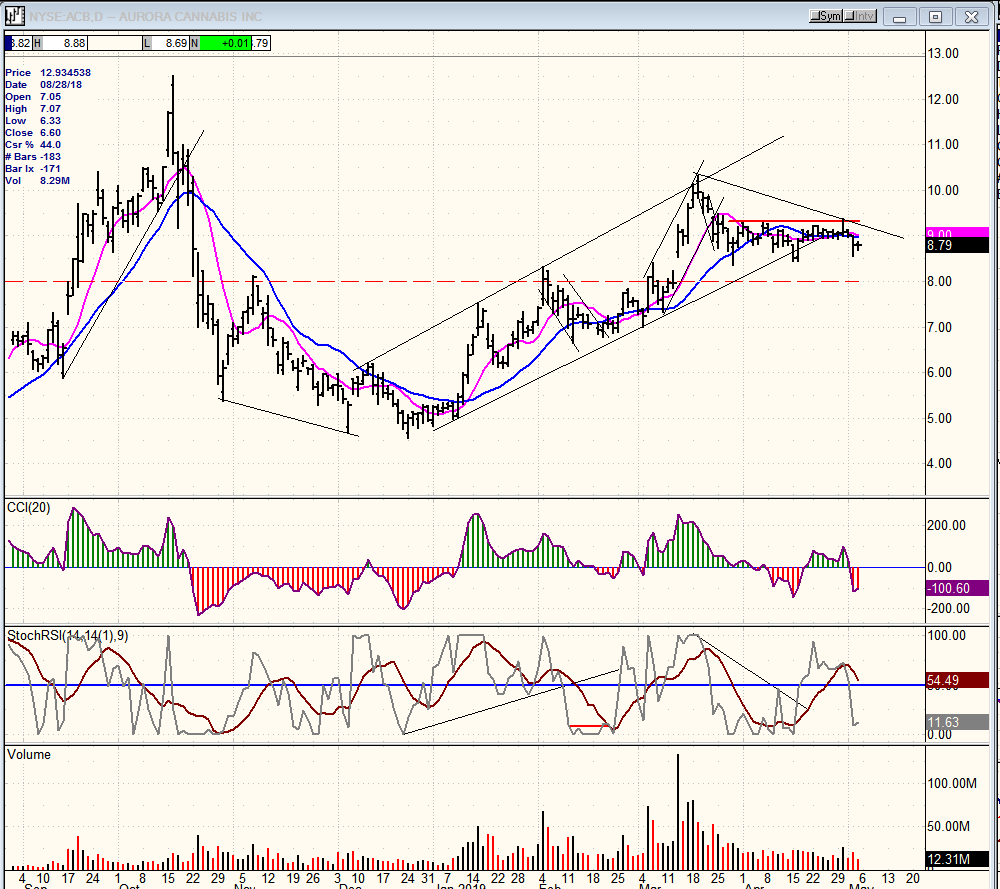
ACB (Aurora Cannabis) daily
ACB continues to trade in a narrow range, seemingly waiting for some news catalyst to move it off the dime. There are good reasons to expect a positive development to occur.
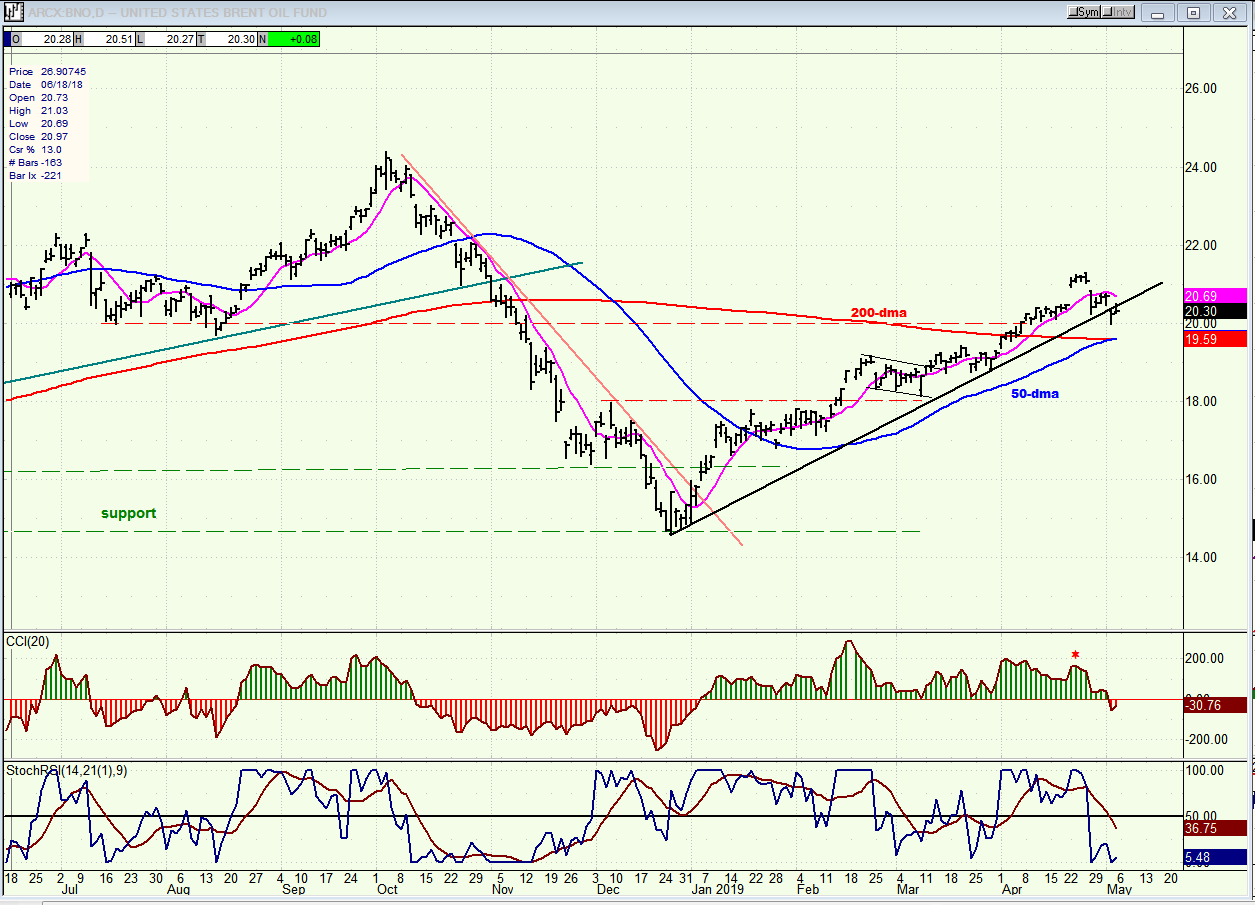
BNO (U.S. Brent oil fund) daily
BNO appears to have found a short-term top and has started to correct. There is good support at the junction of 50-dma and 200-dma (about 19.50).
Summary
Keeping in mind the credible warnings that an important top will be reached around the middle of the month, we continue to monitor the technical health of the SPX. Last week, an attempt to sell off was quickly neutralized and the uptrend from 2346 remains in good health with only minor negatives appearing.
FREE TRIAL SUBSCRIPTON
With a trial subscription, you will have access to the same information that is given to paid subscribers, but for a limited time period. I think you will find that knowing how far a move can carry is one of the most useful benefits of this service, whether you are a trader or an investor -- especially when this price target is confirmed by reliable indicators which give advance warning of a market top or bottom. Furthermore, cycle analysis adds the all- important time element to the above price projections.
For a FREE 4-week trial, further subscription options, payment plans, and for general information, I encourage you to visit my website at www.marketurningpoints.com.
The above comments about the financial markets are based purely on what I consider to be sound technical analysis principles. They represent my own opinion and are not meant to be construed as trading or investment advice, but are offered as an analytical point of view which might be of interest to those who follow stock market cycles and technical analysis.

When Andre Gratian was a stock broker years ago, a friend introduced him to technical analysis of the market. Consequently, it is not an exaggeration to say that Andre fell in love with this approach! Ever since then, it has become an increasingly important part of his professional life. Gratian has studied the works of Wyckoff, Edwards & Magee, Edward J. Dewey (cycles) and many others. However, one of my most profitable undertaking has probably been to study Point & Figure charting, which he finds invaluable in analyzing stocks and indices. If he were restricted to one methodology, this is the one that he would choose. This well-rounded background has given him what he feels to be a special insight into the stock market, facilitating the recognition of meaningful patterns and the ‘turning points’ in all trends, whether they be short or long term. Andre feels very comfortable discussing the stock market and passing on meaningful information to others. His subscribers include individuals and money managers throughout the world. Moreover, his Newsletters are currently published on several financial sites, here and abroad.
More from Gold-Eagle


