Technical Analysis Of The Markets


Current Position of the Market
SPX: Long-term trend – Final long-term phase on the way? How much longer, is the question.
Intermediate trend – The intermediate-term correction continues to unfold.
Analysis of the short-term trend is done on a daily basis with the help of hourly charts. It is an important adjunct to the analysis of daily and weekly charts which discusses the course of longer market trends.
Rally Faltering?
Market Overview
As anticipated, SPX (and the market in general) gapped open and pushed higher to 2994 last Monday, and closed at 2886. It gapped even higher to 2910 on Tuesday morning but started to retrace immediately, and closed near its low of the day. The last three days, the market traded in a narrow range, but remained slightly above Monday’s gap, unable to close it completely. The end of the week showed a basic lack of interest and little activity with a little selling in the last hour, on Friday. Friday was also marked by relative weakness in QQQ which was affected by selling in the semis. The net sum of the week’s activity was what appeared to be distribution taking place in the general market, leaving all four indexes vulnerable to a resumption of intermediate weakness if we do not see buying appear on Monday, with some follow through to the upside.
When the rally from 2346 started, the odds were pretty good that we had only completed wave A at that level, and that we were now in wave B. Last week, for the first time, the rally looked as if it were coming to an end; in other words, that wave B was nearly complete. What was lacking for completion was the distribution phase which normally occurs at the end of each rally, big or small, marking a period of equilibrium between buyers and sellers until the bears regain control and reverse the trend. This distribution shows up best on a P&F chart, and the congestion pattern is also helpful in giving us a “count” for the next downtrend, i.e. an estimate of how far down the move will carry. Since the distribution phase is still proceeding, a count will have to wait a little longer until the reversal has taken place and we have a sell signal. Hopefully, this could be completed by the end of next week -- whatever the index chooses to do in the meantime.
Technical analysis (Charts appearing below are courtesy of QCharts.)
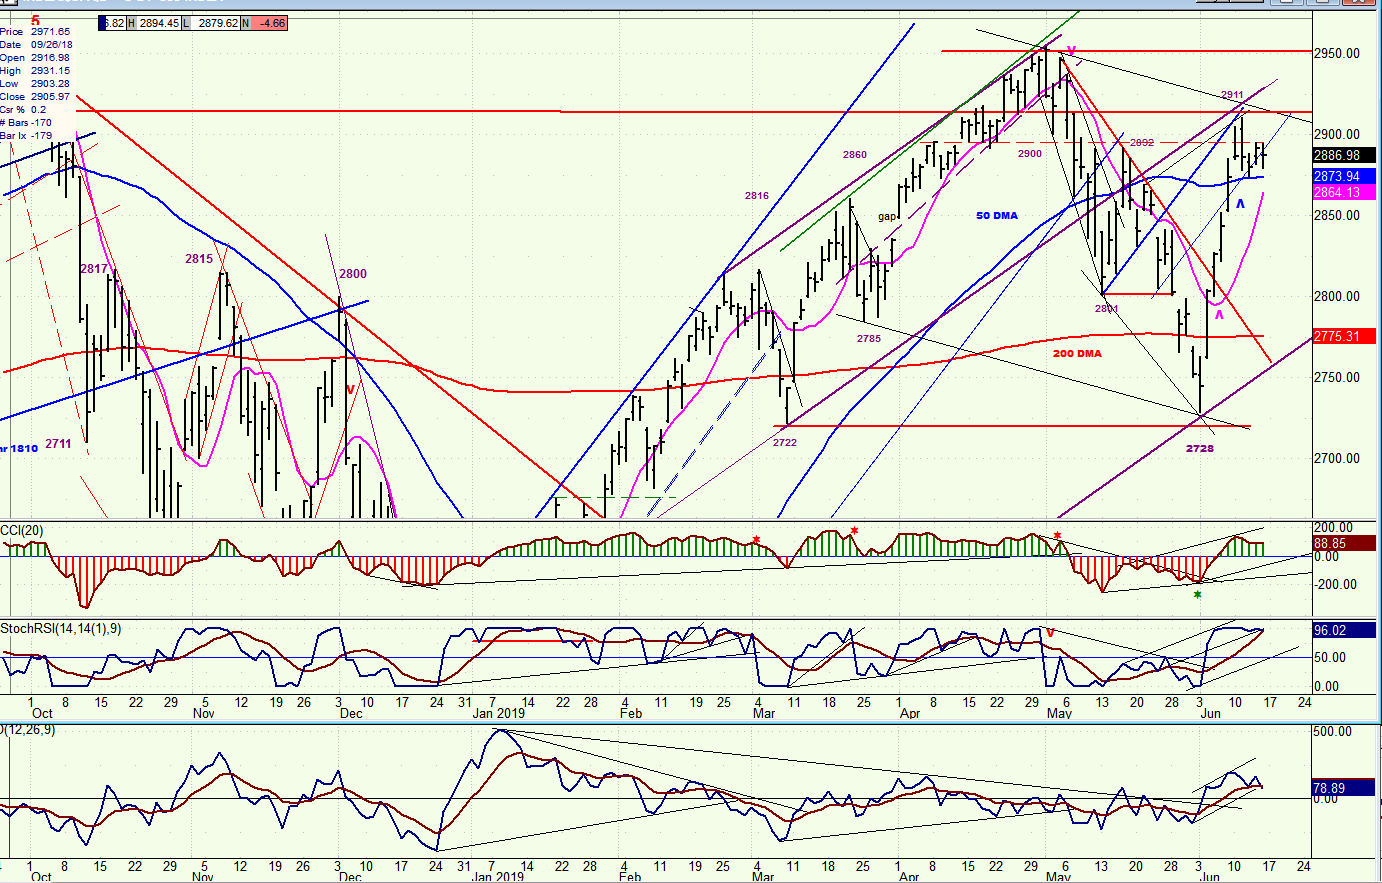
SPX daily chart
The daily SPX chart displayed below is, with the exception of adding a couple of minor trend lines, a replica of what was posted last week. At the time, the index had only moved slightly higher than its blue 50-dma, and heavy trend lines were drawn to show where prices would likely meet with resistance. This is in fact what happened, and this caused the index to retrace sharply on Tuesday, but it was contained by the 50-dma which had been surpassed three days earlier. Last week’s action has formed a small consolidation pattern which can easily turn into a rally top if the uptrend does not resume immediately.
We have arrived at a place on the chart where analysis can be kept very simple. Having found resistance at the trend lines discussed earlier, SPX can continue to move sideways until the pink 9-dma catches up with the price, and then it will have to decide if it continues to rise and stays above it, or if it starts to roll over, breaking below not only the pink, but the blue MA, which action would signal a resumption of the decline from 2911 with all its implications. By this, I mean that the best current thinking is that the December low of 2346 was only wave A of primary wave 4 of the bull market, and that we are most likely now completing wave B. Should that be the case, we are looking ahead to another steep decline which could last until mid-August/September, and which could perhaps even make a new correction low before coming to an end.
Since it is not entirely clear if the index is ready to roll over or if it needs to push a little higher first, we need to give it a little more time to decide. This should not take too long, because the larger cycles are not going to wait. By the end of next week SPX should have clarified its intentions. If it does move higher from here, there has been enough congestion created over the past few days for it reach between 2930 and 2950 while, during that time, remaining below the two resistance lines.
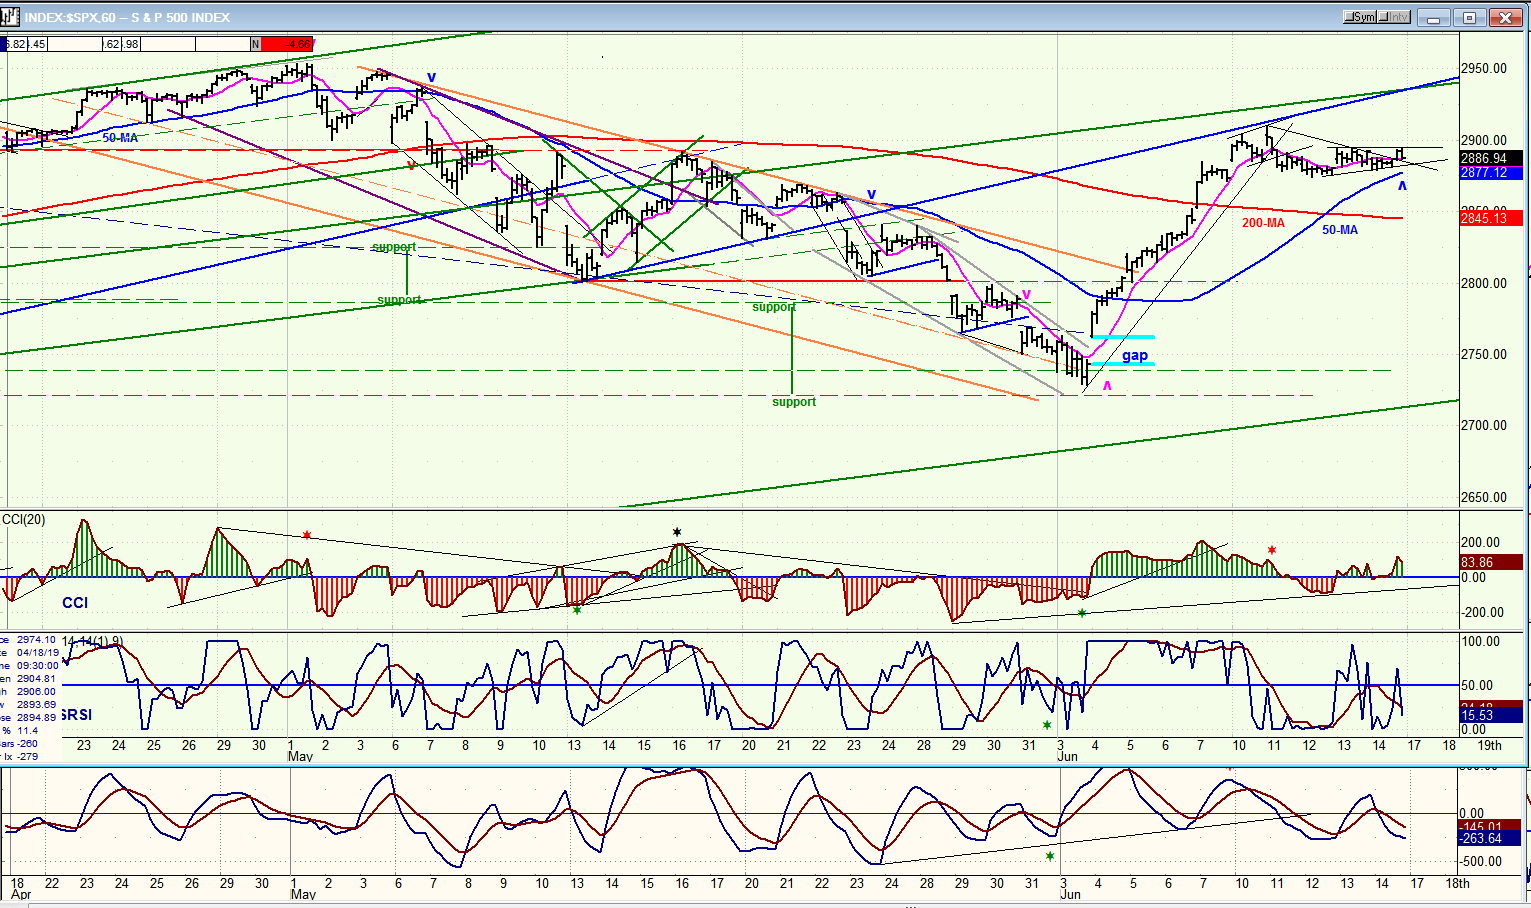
SPX hourly chart
The analysis of the trend on the hourly chart can also be kept simple. The two resistance lines which stopped the rally from 2729 are also shown on this chart. Even if the index should move a little higher before rolling over, it is unlikely that it will be able to get past either or both trend lines. It had better not, because if it does, it will really mess up our preferred analysis; which is that we are still in a corrective wave with more downside than upside likely over the next few weeks.
Having established the upside parameters for any rebound from here, we can now turn to what it would take to trigger a sell signal. Here also, the 50-hr MA will be of great assistance. Last week, I pointed out that this was a simple way to decipher the hourly trend. As long as he 50-hr MA rises and prices stay above it, we remain in a short-term uptrend, and vice-versa. We have to allow for some minor digressions, such as occurred in the middle of the chart when the index went slightly above but there was no follow-through, and it quickly returned below. ereHere also,
We should know as early as Monday morning if we are ready to resume our downtrend right away, or if we are going higher first. We ended Friday’s trading with a bullish bias, in spite of the little selling wave which took place in the last hour. The index remained above the blue MA and the red 200-hr MA, and the CCI remained positive. On the other hand, a gap opening on the downside followed by continued selling would tell us that we are resuming the downtrend.
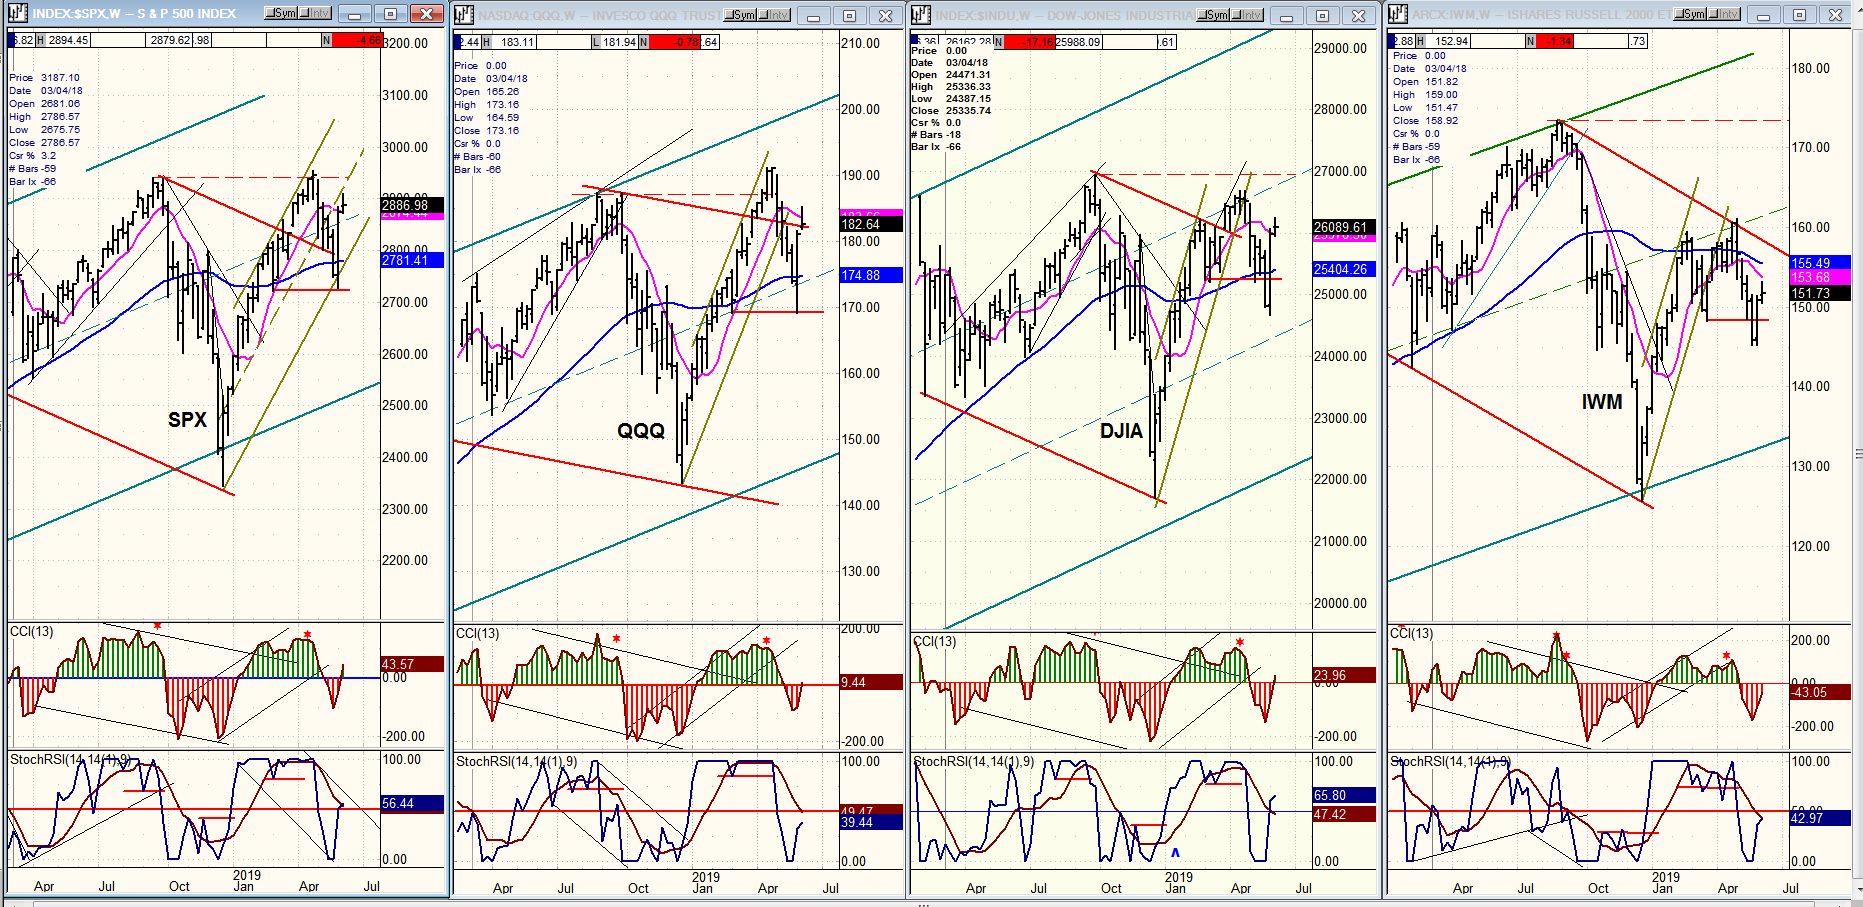
QQQ, SPX, DJIA, IWM (weekly)
No change in RS this week, but the SPX has solidified its first place ranking. It’s top oscillator reflects the strong rebound of the past two weeks which brought about a rally of 180 points -- enough to put CCI back in the green, but not enough to give the kind of a buy signal which would precede a new uptrend. Also, QQQ weakened even more last week relative to SPX, and IWM shows no sign of improving its RS to the others. The collective action is still suggestive of a rally in a downtrend.
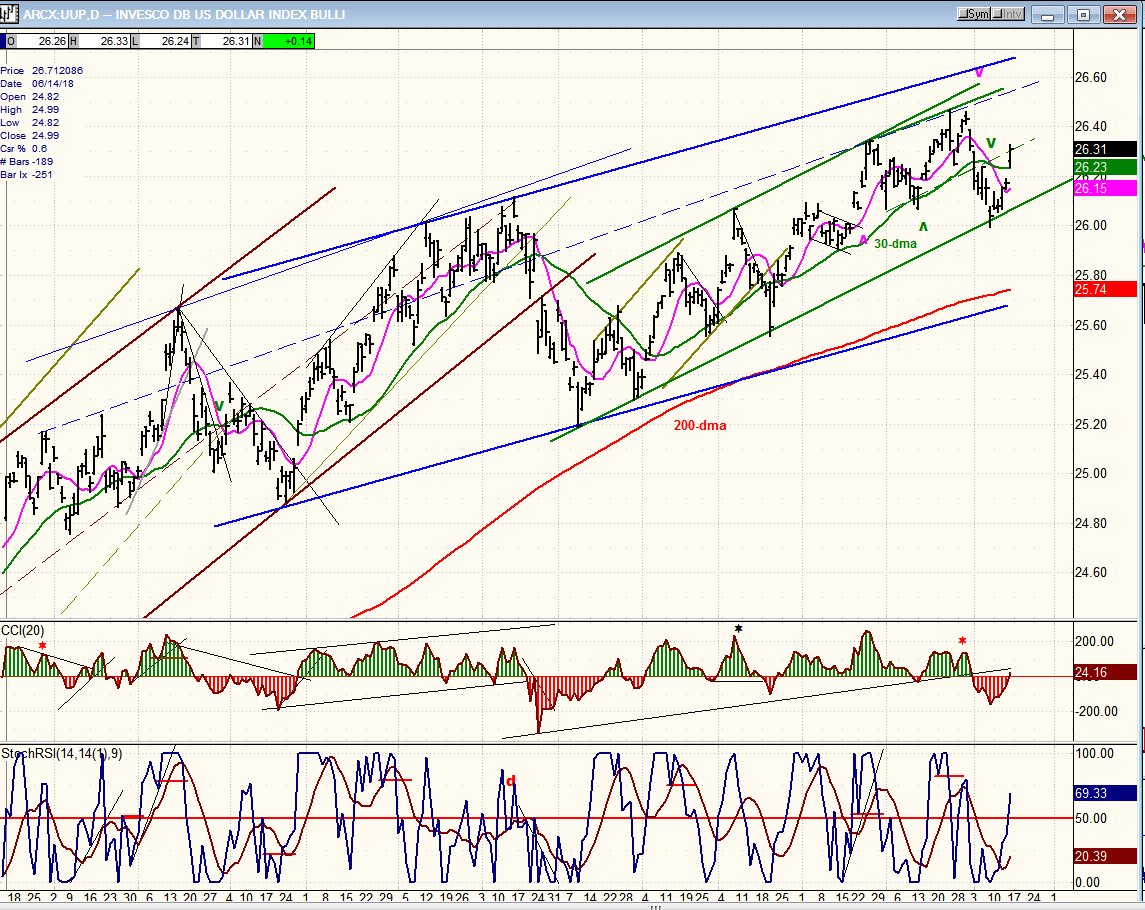
UUP (dollar ETF)
Predictably, UUP found support at the bottom of its green channel and has retraced half of the channel width. Should it stop there and go no higher, it would be a sign that it is preparing to roll over and break through the bottom of the channel and continue down to challenge its 200-dma and the lower trend line of the larger blue channel. Alternatively, it could exhibit more strength and rise to the top of the green channel, in which case a more important correction would be further delayed.
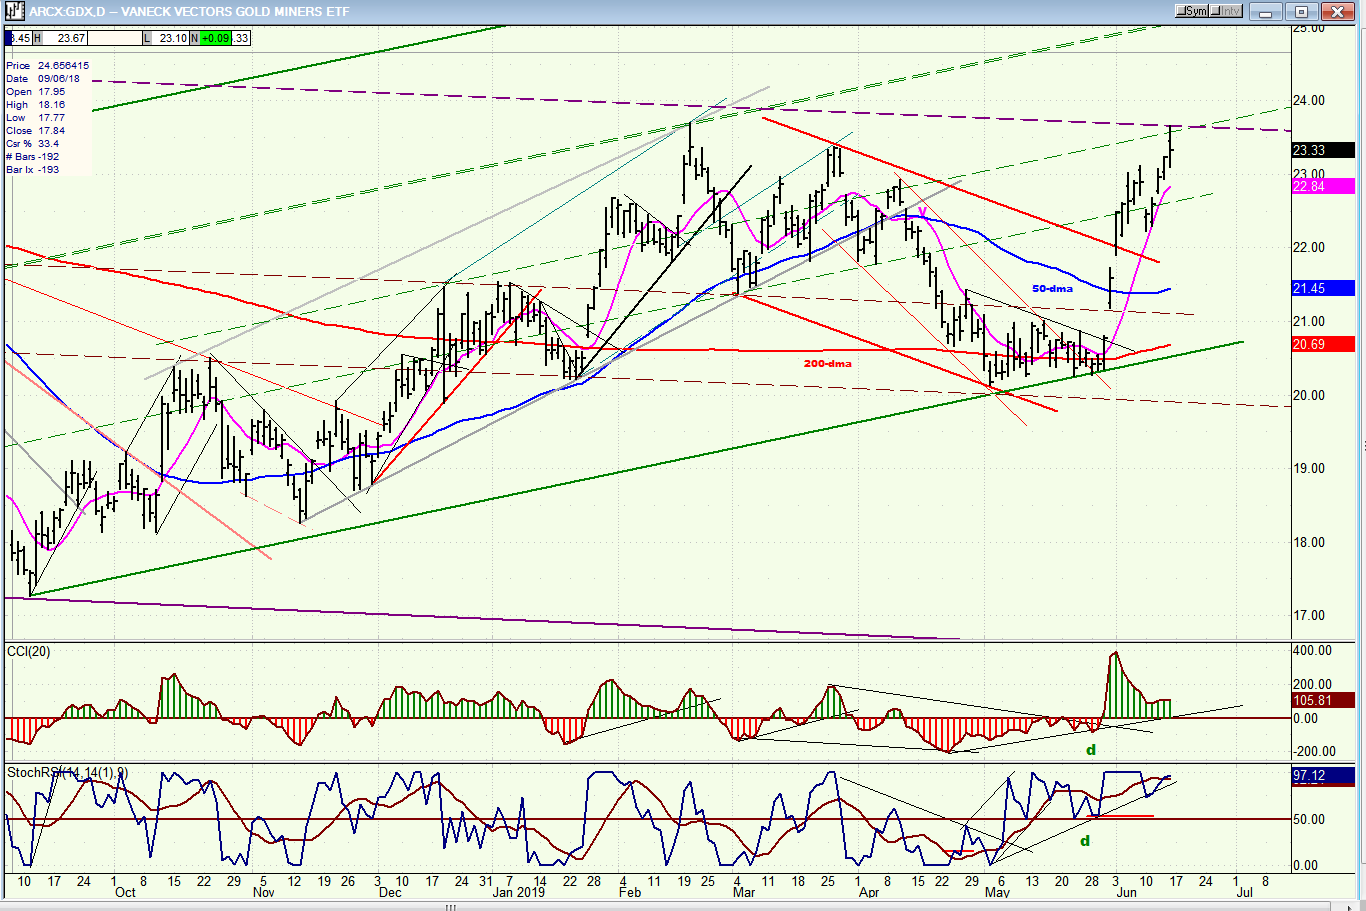
GDX (Gold miners ETF) daily
GDX has had a good move since it broke out of its base formation, but it has arrived at a level (marked by the heavy dashed line) which is about halfway to the top of a broad channel which could offer short-term resistance. For now, we will concern ourselves primarily with the green channel, the top of which is not seen on this chart because it is not relevant to today’s discussion. Next week, I will publish a detailed weekly chart which will show what is expected of GDX over the intermediate term.
After a brief pause a this level, GDX should be able to move to about 25-25.50 before a longer pause.
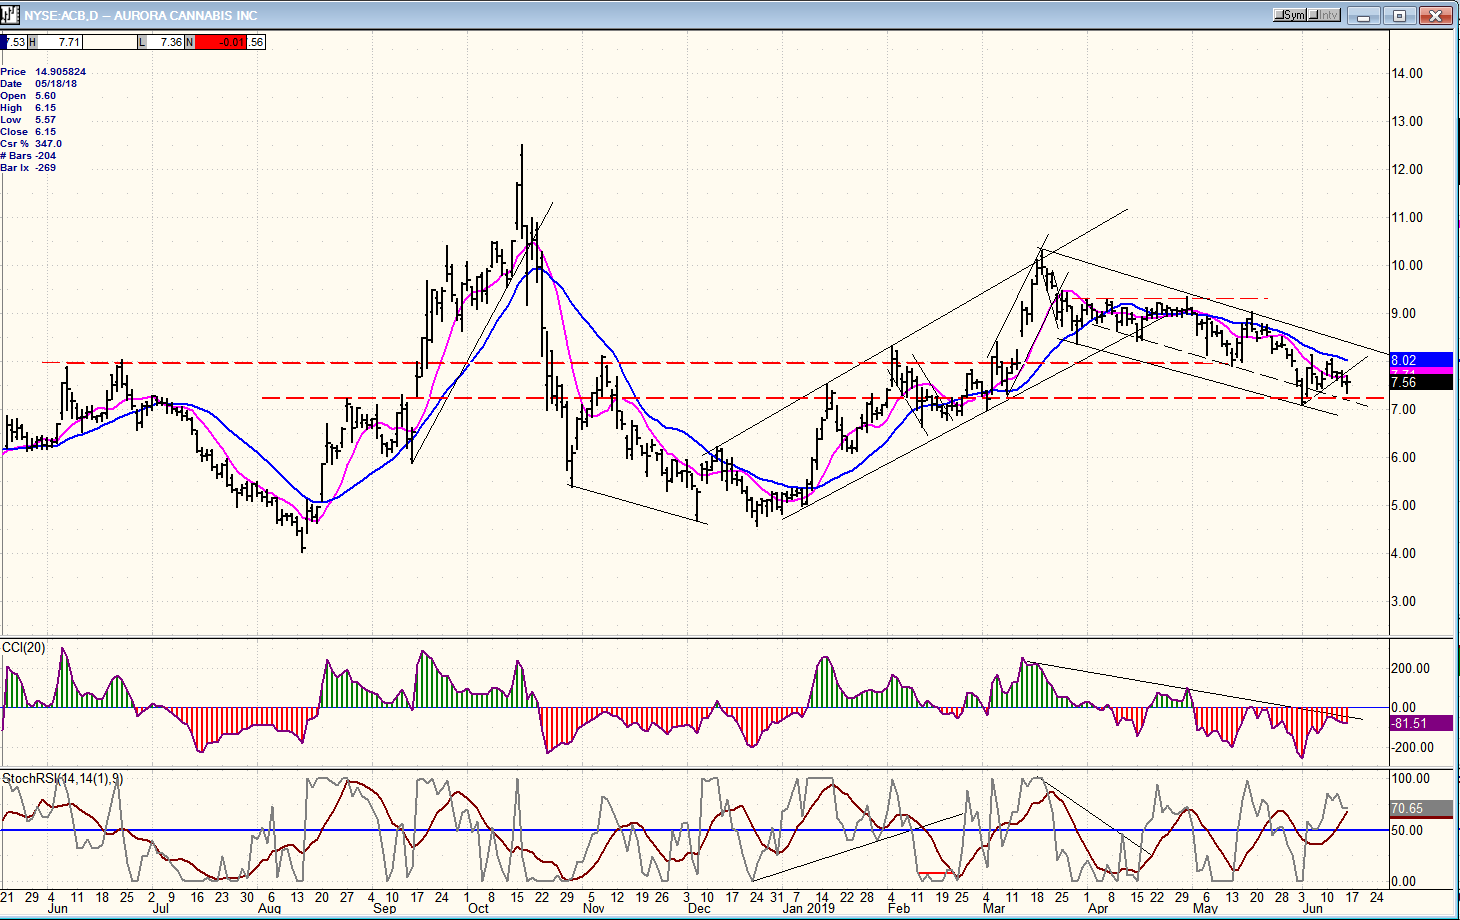
ACB (Aurora Cannabis) daily
ACB may have to wait until the intermediate correction of the market is over before continuing its uptrend, but this is not necessarily the case. As other firms in this industry have witnessed over the past few weeks, news of a merger or of an acquisition can propel the stock higher at any time. Hopefully, signs will first appear that this is about to take place.
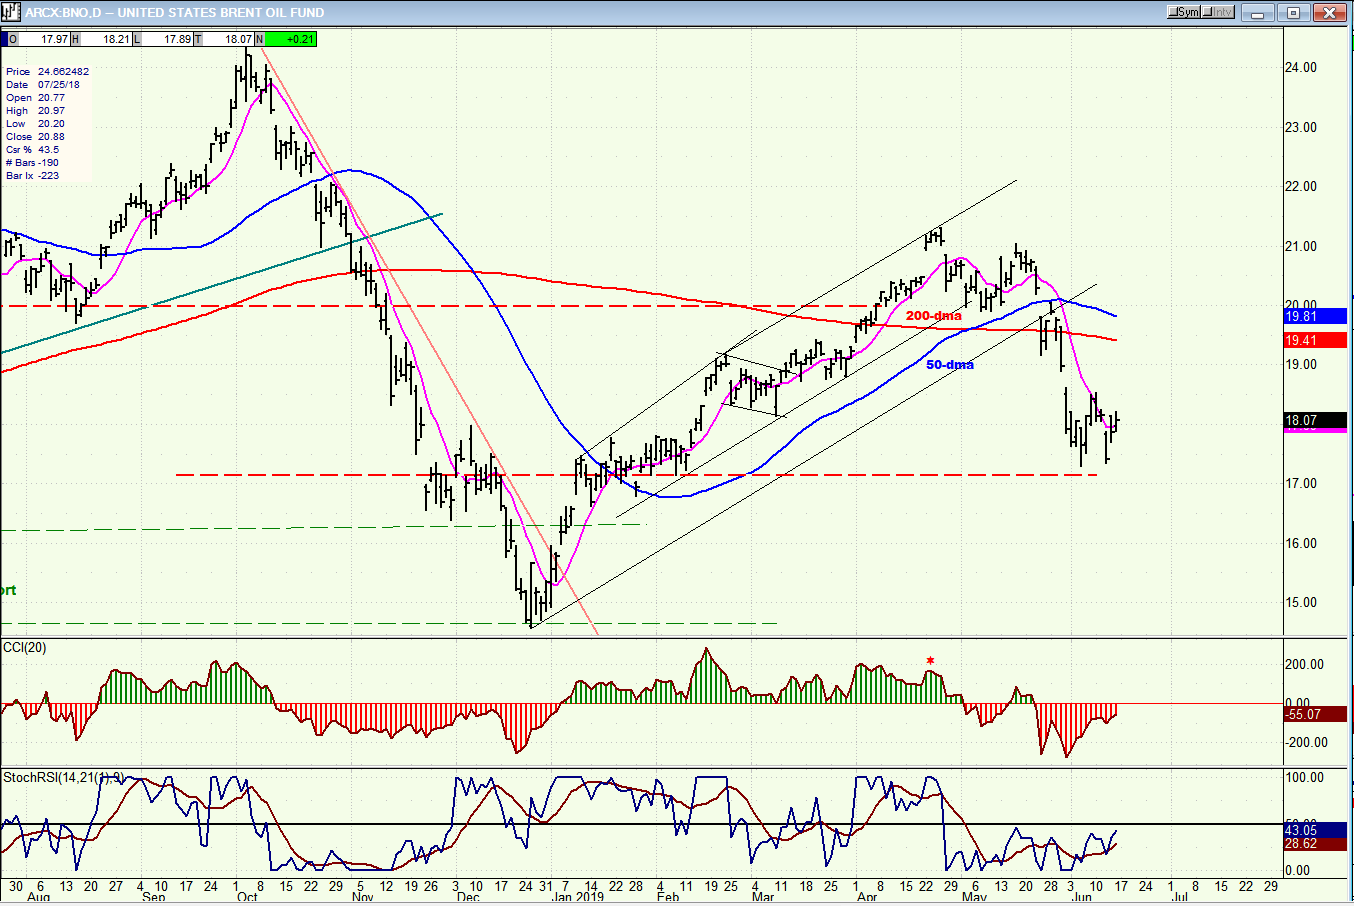
BNO (U.S. Brent oil fund) daily
BNO continues to work through its corrective move and this should continue in sync with the overall market.
Summary
SPX is looking for an end to its current rally, which may already be in process; or it may push a little higher first to complete its counter-trend move.
FREE TRIAL SUBSCRIPTON
With a trial subscription, you will have access to the same information that is given to paid subscribers, but for a limited time period. I think you will find that knowing how far a move can carry is one of the most useful benefits of this service, whether you are a trader or an investor -- especially when this price target is confirmed by reliable indicators which give advance warning of a market top or bottom. Furthermore, cycle analysis adds the all- important time element to the above price projections.
For a FREE 4-week trial, further subscription options, payment plans, and for general information, I encourage you to visit my website at www.marketurningpoints.com.
The above comments about the financial markets are based purely on what I consider to be sound technical analysis principles. They represent my own opinion and are not meant to be construed as trading or investment advice, but are offered as an analytical point of view which might be of interest to those who follow stock market cycles and technical analysis.
*********

When Andre Gratian was a stock broker years ago, a friend introduced him to technical analysis of the market. Consequently, it is not an exaggeration to say that Andre fell in love with this approach! Ever since then, it has become an increasingly important part of his professional life. Gratian has studied the works of Wyckoff, Edwards & Magee, Edward J. Dewey (cycles) and many others. However, one of my most profitable undertaking has probably been to study Point & Figure charting, which he finds invaluable in analyzing stocks and indices. If he were restricted to one methodology, this is the one that he would choose. This well-rounded background has given him what he feels to be a special insight into the stock market, facilitating the recognition of meaningful patterns and the ‘turning points’ in all trends, whether they be short or long term. Andre feels very comfortable discussing the stock market and passing on meaningful information to others. His subscribers include individuals and money managers throughout the world. Moreover, his Newsletters are currently published on several financial sites, here and abroad.


