Technical Analysis Of The Markets


Current Position of the Market
SPX Long-term trend: Uptrend from the 2009 low continues.
SPX Intermediate trend: Intermediate correction underway
Analysis of the short-term trend is done on a daily-basis with the help of hourly charts. It is an important adjunct to the analysis of daily and weekly charts which discuss longer market trends.
20-week Cycle Low ?
Point & Figure overview of SPX
Long term trend: The bull market which started in 2009 shows no sign of having run its course. A count taken on the long term P&F chart gives us a potential target as high as 4080. P&F does not predict time; only price. (no change)
Intermediate trend: Intermediate target minimum: 2620 – potential: 2360.
Important (known) cycles
I follow only a few cycles which I use in my analysis. This is complemented by the analysis of Erik Hadik (www.insiidetrack.com).
The 20-wk cycle most likely bottomed on 2/28. 80-d due 4/7-6/8; 40-wk 7/14; 9-yr ~7/14.
Market Analysis (Charts courtesy of QCharts)
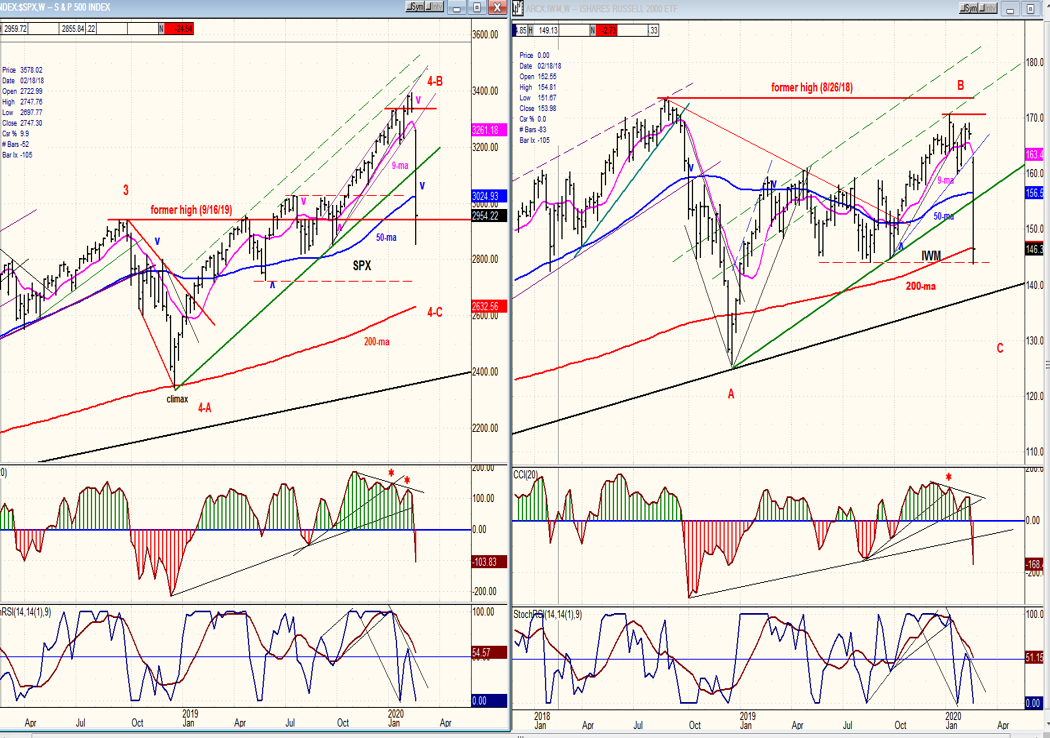
SPX- IWM weekly charts:
Comparing these two charts is proving to be rewarding. The premise is that IWM gives us a heads up on what the SPX is going to do next. The evidence presented by these two charts side by side is compelling. IWM made its recent high a full six weeks before SPX, thereby suggesting that a correction could be imminent.
A longer term aspect of this illustration is the domain of EWT experts. By refusing to go beyond its 8/26/18 high, IWM may also have been warning that wave 4 was still in play, and that C of 4 is just now getting underway. We’ll have to see what that index suggests as we approach the lows of the correction (probably in mid-July), although early warnings appear to be confined to tops.
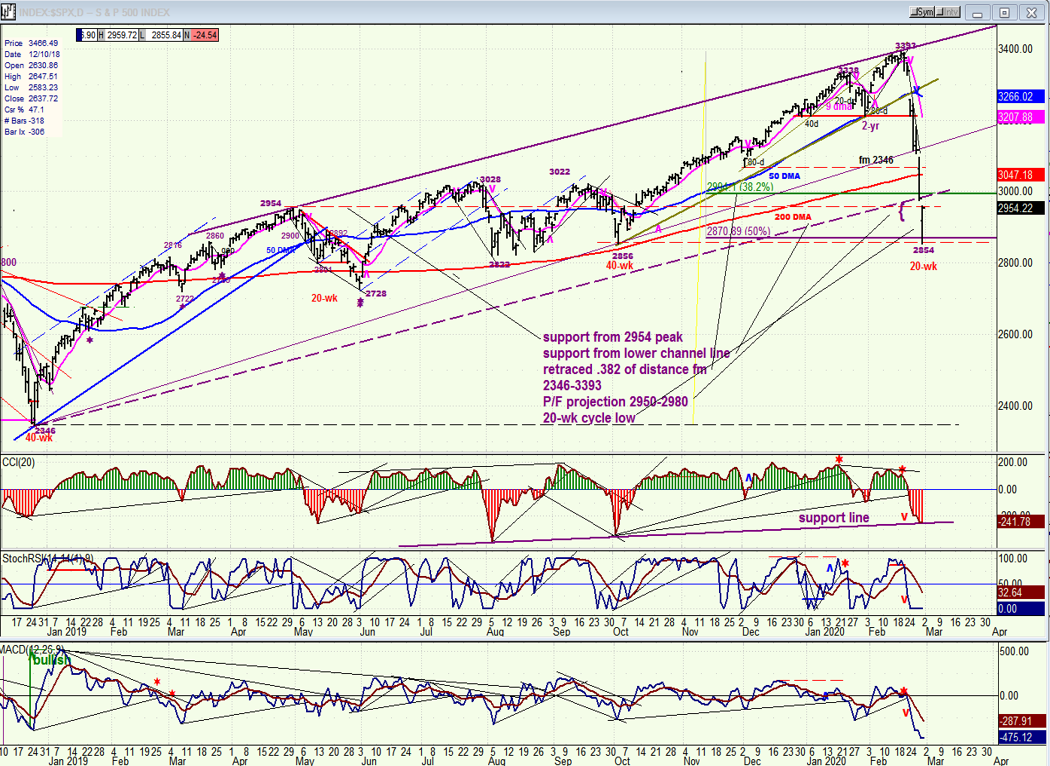
SPX daily chart
On Thursday, I sent the following chart (minus Friday’s data) as part of my evening Market Summary. My reasons for expecting a low near Thursday’s close are given on the chart. I had expected a reversal to occur in this time frame based on the 20-wk cycle low, possibly near the .382 retracement point, but the momentum carried prices significantly lower for one more day -- a little beyond the .50 retracement level of 2870. Friday’s activity created a 210-point base on the SPX P&F chart, representing a major skirmish between bulls and bears one day past the ideal date when the 20-wk cycle was scheduled to make its low, with the bulls apparently scoring a decisive victory since the index closed up one hundred points from its daily low, but still down 25 points for the day.
We are about to find out if the stock market still functions in a normal way, whereby cycles, Elliot waves/Fibonacci, and the accumulation/distribution patterns still dictate the market moves, or if the coronavirus epidemic surmounts these historical forces and creates a “new normal”! I suspect that history will prevail and that Friday’s 20-wk cycle reversal and the accumulation pattern which formed will create a countertrend rally which retraces .382, or .50 of the ground lost before turning down toward a new low. Already one hundred points of the rally has occurred and what lies ahead should be a continuation of the move to 3061 or 3124. The base which has been created is in two sections and the entire base gives us a count to about ~3125.
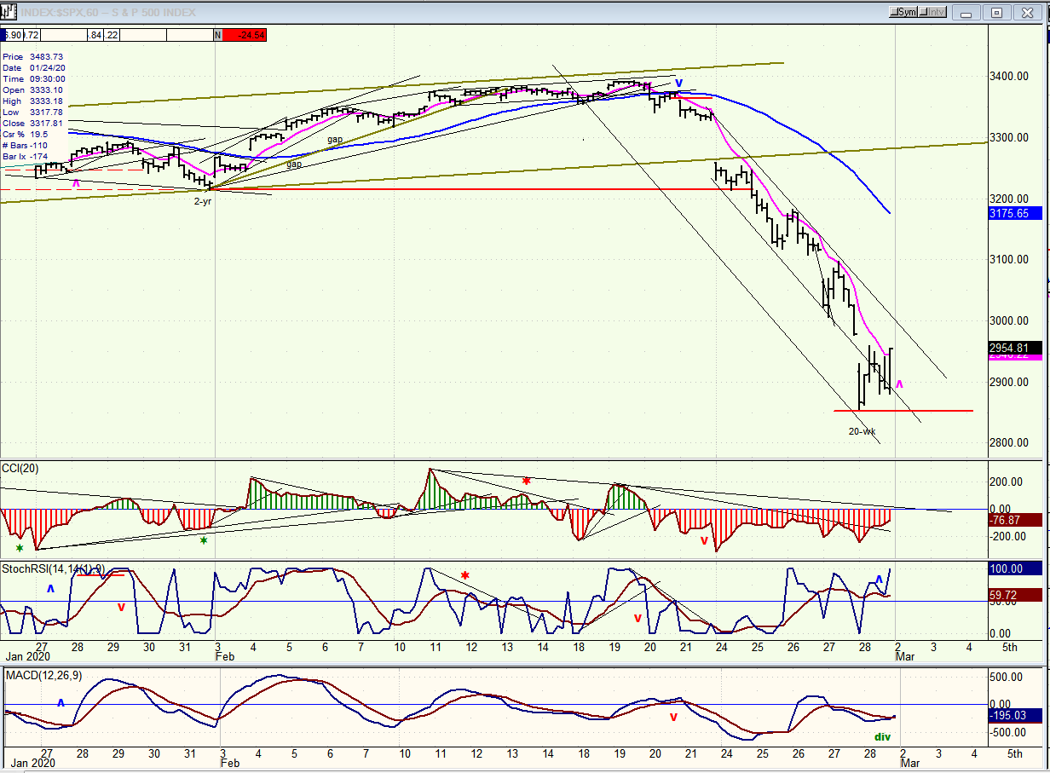
SPX hourly chart
The hourly chart shows that in spite of its appearance of panic selling the decline was very orderly, forming a narrow channel which was doubled in width by Friday’s selling climax; but Friday’s close took the index past its 9-hr MA and, if this is a valid reversal, it should continue outside the top channel line early next week. A break of the downtrend line would clinch a short-term buy signal and turn all three oscillators positive.
The blue 50-hr MA is currently at 3175 and should put an end to the rally when it is reached, perhaps at about 3124. An end to the counter-trend rally should be followed by a resumption of the decline to lower targets, with a minimum projection to 2620, and perhaps by a retracement all the way down to the 2346 December 2018 low.
UUP (dollar ETF)
UUP is pulling back in conjunction with the market sell-off. It’s too soon to tell if this is the effect of the 3-m cycle rolling over. Let’s see how a market rally affects this index.

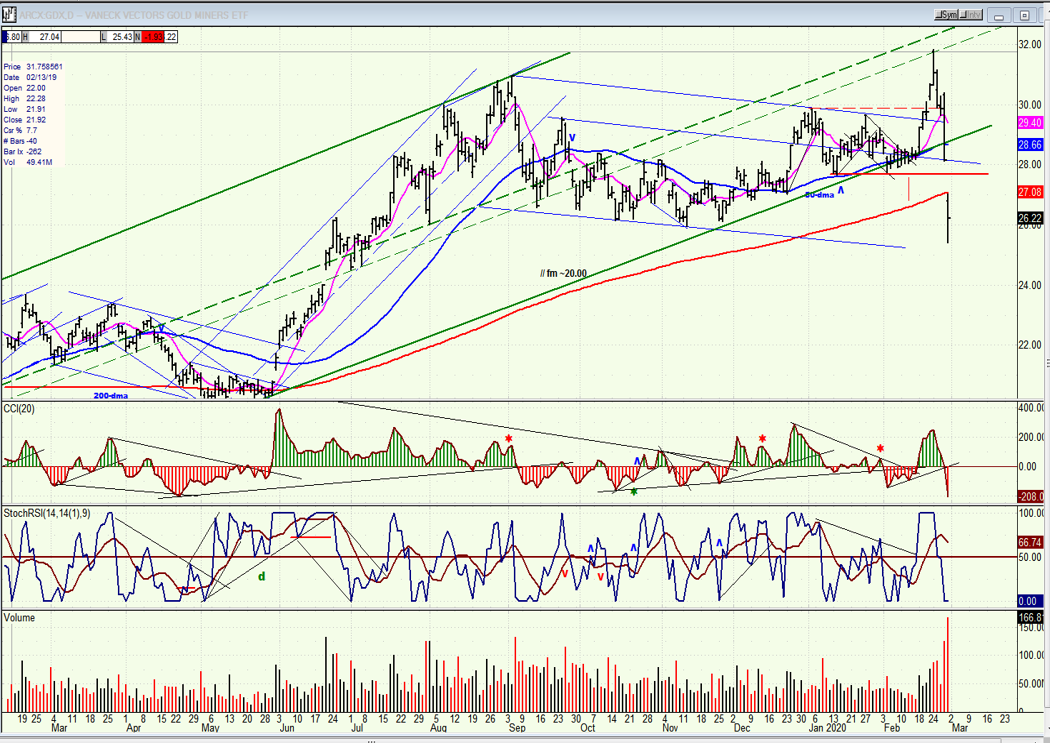
GDX (gold miners)
GDX found resistance at the mid-point of its intermediate uptrend channel and has pulled back sharply, breaking below the green trend line. This is not expected to be a major set-back, but it could result in a fairly lengthy consolidation that would add to the secondary accumulation pattern already existing.
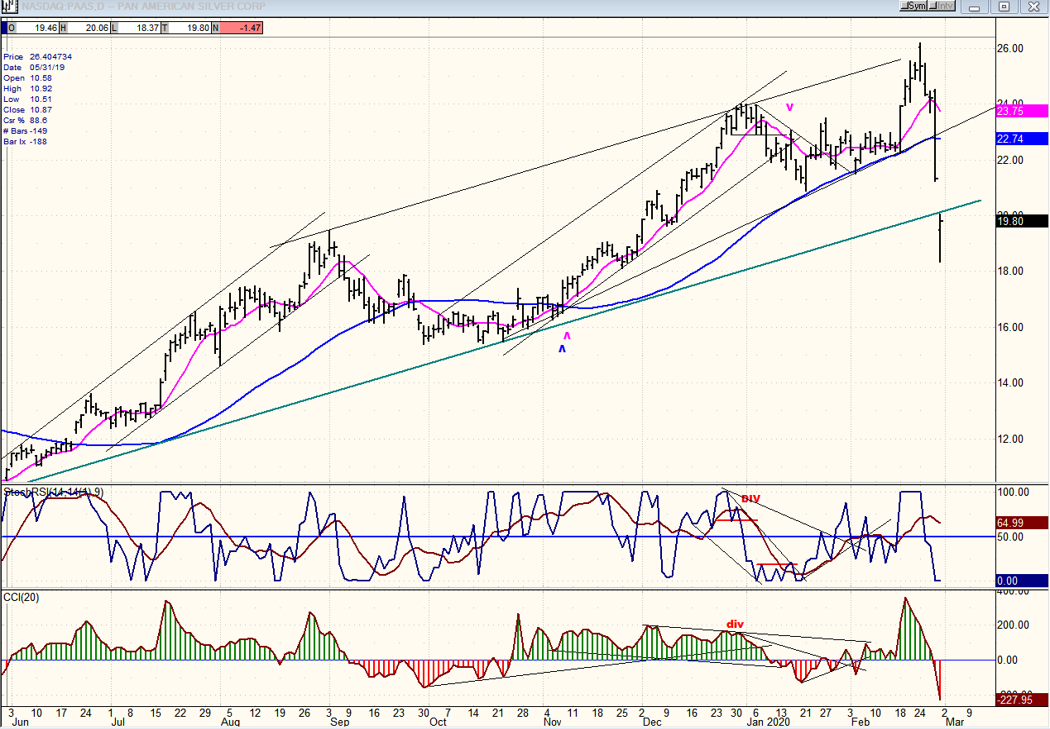
PAAS (Pan American Silver Corp)
PAAS also reacted sharply to the market sell-off, instead of going against it. It found support on Friday and staged a good rally from its daily low. I would expect a consolidation pattern to start forming as the market rallies from its oversold condition. The long-term uptrend will remain intact unless much more selling occurs, but the stock is expected to remain above its former low of 15.44.
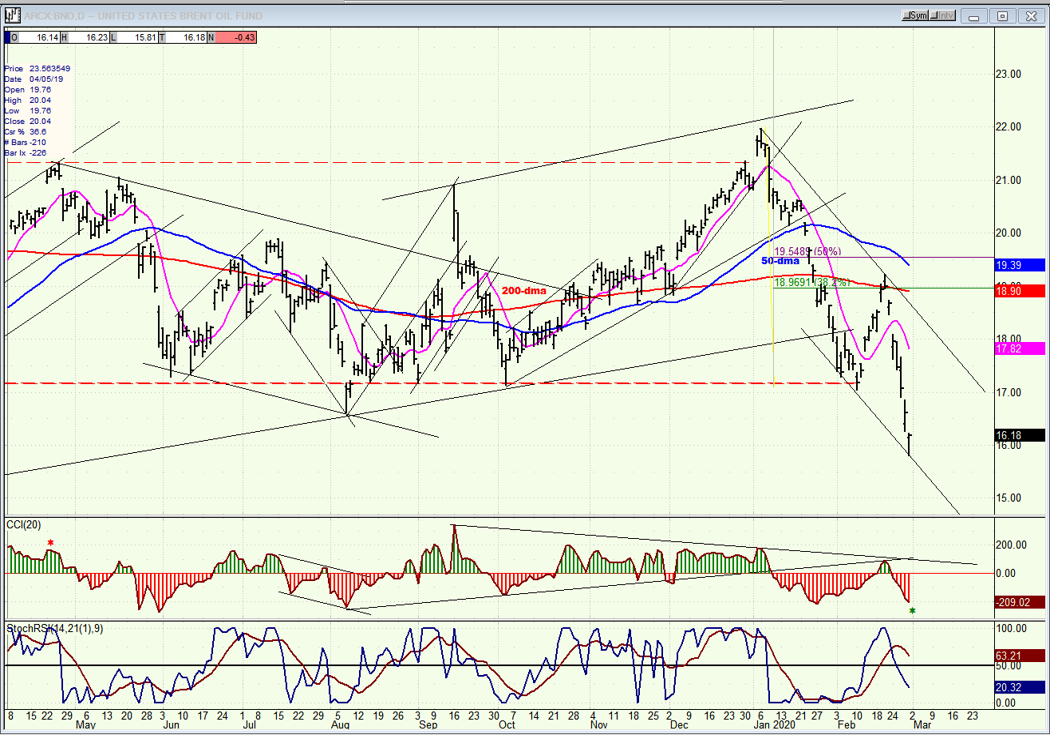
BNO (U.S. Brent Oil fund)
As expected, BNO was vulnerable fundamentally and technically to additional selling, and it took another hit last week. It is now in a well-established down-channel and is likely to stay in it for the foreseeable future. It has good support a point or so lower.
Summary
We have entered a period of uncertainty which could have a significant negative impact on the stock market if the coronavirus infection continues to spread rapidly, not just in China but throughout the rest of the world… Best be cautious until we have more clarity about this situation.
Last week, the market entered an intermediate corrective phase which should last at least until July and see lower prices. Tentative downside targets are given above.
Free trial subscription
With a trial subscription, you will have access to the same information that is given to paid subscribers, but for a limited time period. Over the years, I have developed an expertise in P&F charting (price projection), cycles (timing), EWT (structure), and general technical analysis which enables me to warn subscribers of pending reversals in market trends and how far that trend can potentially carry. For a FREE 4-week trial, subscription options and payment plans, I encourage you to visit my website at www.marketurningpoints.com.
The above comments and those made in the daily updates and the Market Summary about the financial markets are based purely on what I consider to be sound technical analysis principles. They represent my own opinion and are not meant to be construed as trading or investment advice, but are offered as an analytical point of view which might be of interest to those who follow stock market cycles and technical analysis.
********

When Andre Gratian was a stock broker years ago, a friend introduced him to technical analysis of the market. Consequently, it is not an exaggeration to say that Andre fell in love with this approach! Ever since then, it has become an increasingly important part of his professional life. Gratian has studied the works of Wyckoff, Edwards & Magee, Edward J. Dewey (cycles) and many others. However, one of my most profitable undertaking has probably been to study Point & Figure charting, which he finds invaluable in analyzing stocks and indices. If he were restricted to one methodology, this is the one that he would choose. This well-rounded background has given him what he feels to be a special insight into the stock market, facilitating the recognition of meaningful patterns and the ‘turning points’ in all trends, whether they be short or long term. Andre feels very comfortable discussing the stock market and passing on meaningful information to others. His subscribers include individuals and money managers throughout the world. Moreover, his Newsletters are currently published on several financial sites, here and abroad.


