Technical Analysis Of The Markets


Current Position of the Market
SPX Long-term trend: An “official” bear market has now been declared.
SPX Intermediate trend: First phase of correction nearly over.
Analysis of the short-term trend is done on a daily-basis with the help of hourly charts. It is an important adjunct to the analysis of daily and weekly charts which discuss longer market trends.
Minor Cycle Bounce
Point & Figure overview of SPX
Long term trend: Although I do have a potential lower target in mind, I will wait for some confirmation before disclosing it.
Intermediate trend: Maximum 2170 this phase. Larger drop into mid-year after relief rally.
Important cycles followed
I follow only a few cycles that I consider reliable in my analysis. This is complemented by the analysis of Erik Hadik (www.insiidetrack.com).
The 80-d cycle is due on 4/7-6/8; 40-wk 7/14; 4.5-yr or 9-yr ~7/14.
Market Analysis (Charts courtesy of QCharts)
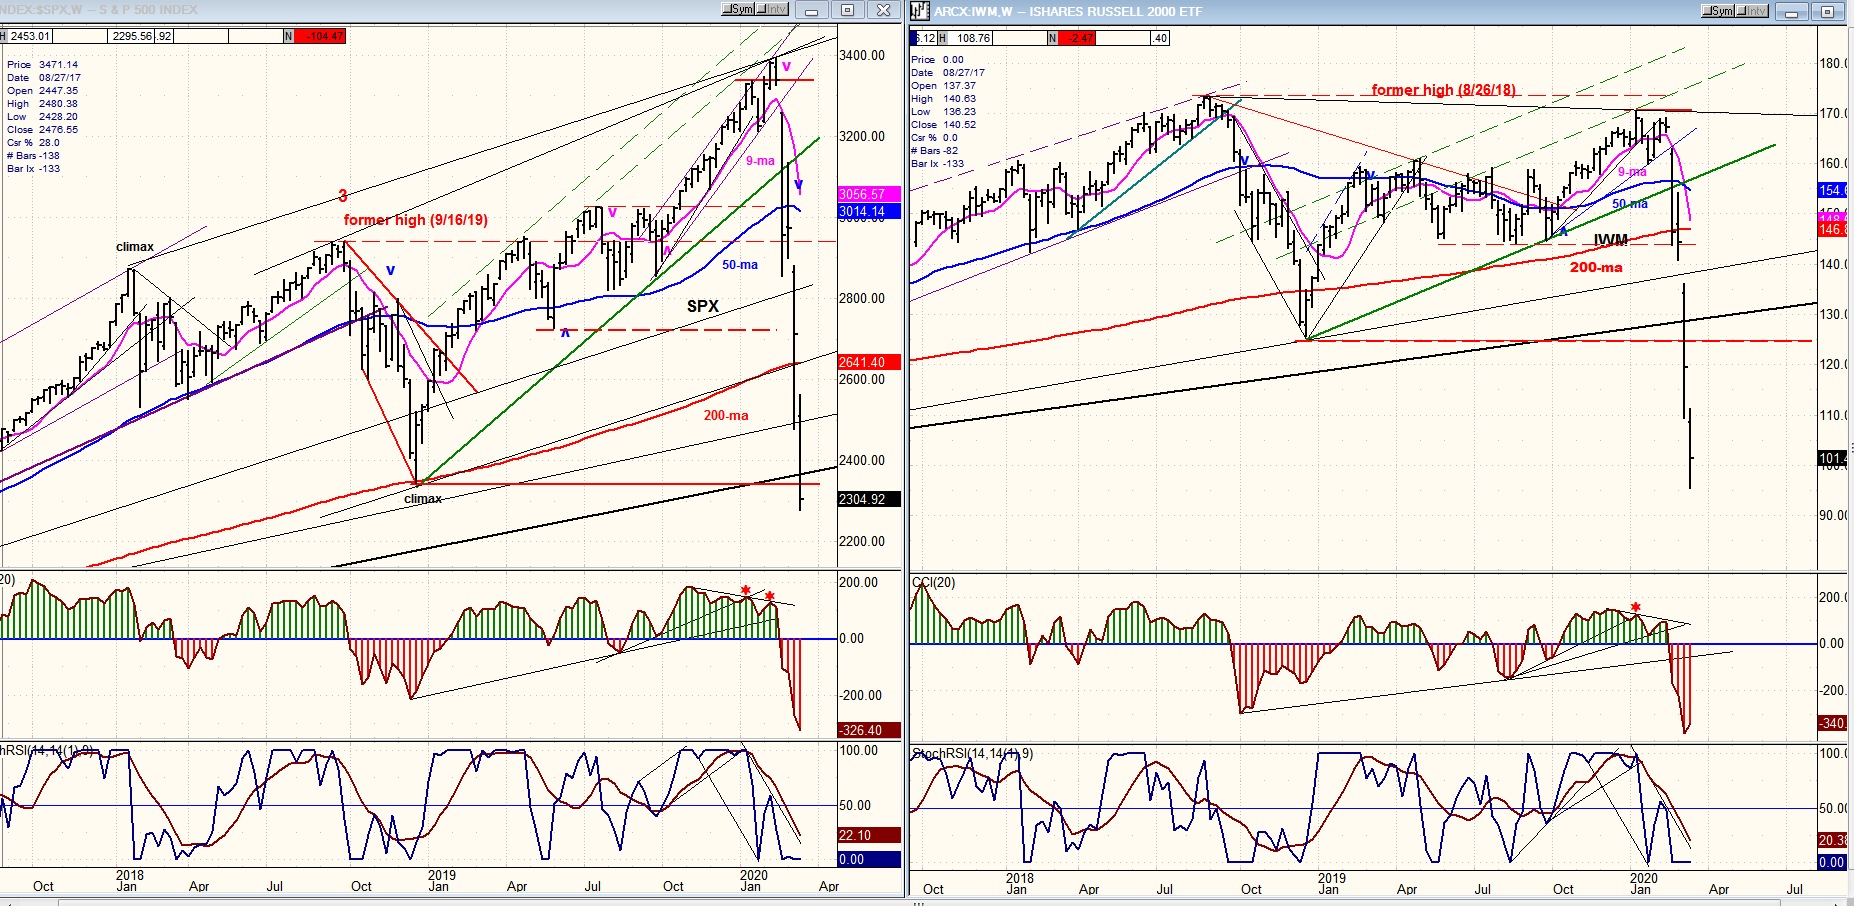
SPX- IWM weekly charts:
SPX has now broken below its Dec. ’18 low, something that IWM did two weeks earlier. Cycles suggest that our first significant countertrend rally should happen soon, probably early April, in conjunction with the 80-d cycle low.
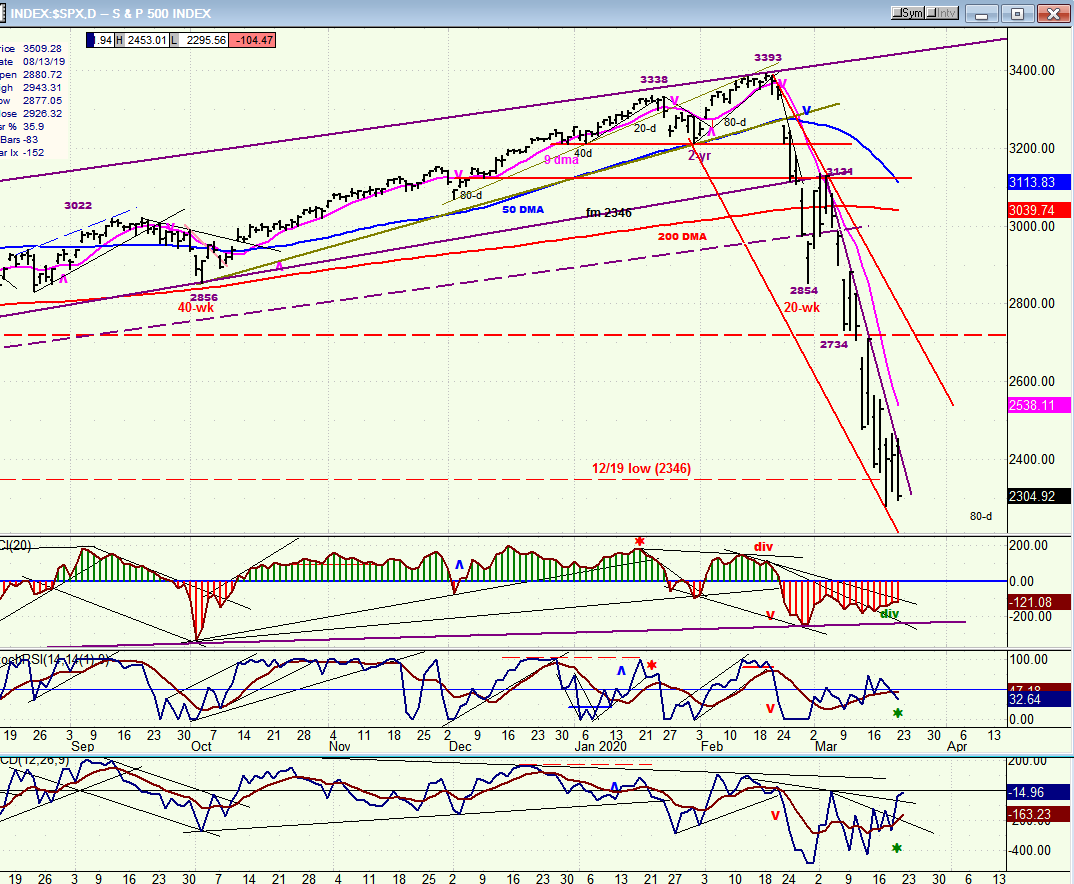
SPX daily chart
SPX breached its Dec.’18 low last week, and closed below it on Friday. This opens the door to a great deal more weakness ahead, but not before we get a good countertrend rally first, probably generated by the 80-day cycle low due in the second week of April. It should be preceded by a smaller bounce due early next week. A secondary trend line (from 3131) is starting to be challenged and could be broken next week.
The proximity of a low is also apparent in the indicators which are increasing their positive divergence, but the CCI is still fairly deep, suggesting that a rally which takes it closer to the zero line (corresponding to next week’s minor cycle low) would pave the way for the next dip into the bigger cycle a little over a week later which could be the one giving us a full-fledged bear market rally of several hundred points when it reverses.
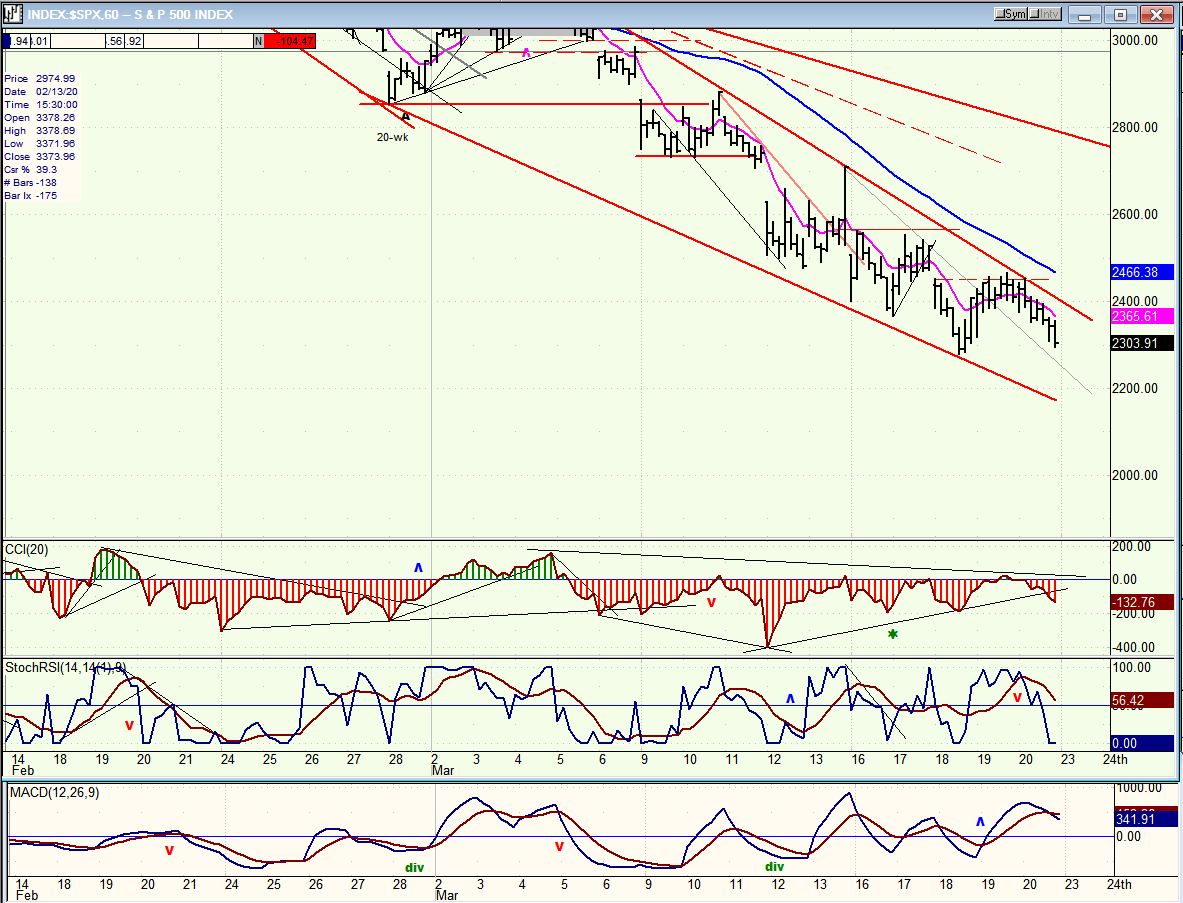
SPX hourly chart
About mid-day Monday would be a good time for a reversal of the 20-day cycle. There is good positive divergence in the A/D indicator (lowest). The red downtrend line will most likely be penetrated on the upside and if we can rise slightly above the blue 50-hr MA, it will be a good sign that some buying is returning. I don’t know if we can make it to the vicinity of the .382 retracement level from 3137 (~2600), but if the government comes up with the substantial relief plan they are currently working on, it could spur some hasty short-covering. The last minor cycle low was 10 days ago and it did not create much of a rally, but that was much earlier in the decline and we were nowhere close to having filled the P&F count.
UUP (dollar ETF)
The current situation which has caused the Fed to react aggressively has sent the dollar soaring in an uncommon state of volatility to its highest level in nearly 20 years. It is not possible to predict a reliable trend under current conditions, but the P&F chart projects that the dollar -- currently trading at 103 -- could reach ~104 before it settles down.

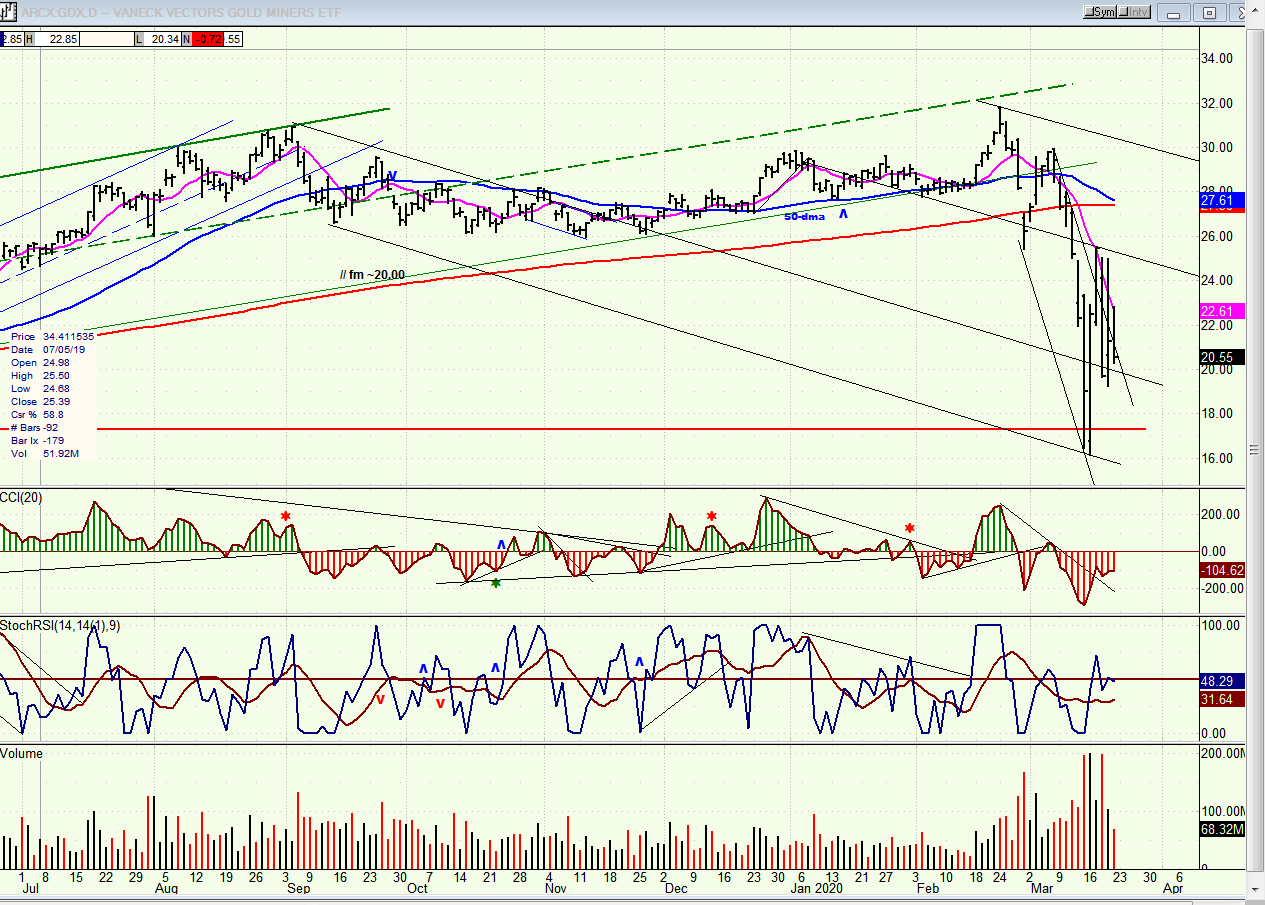
GDX (gold miners)
GDX made new intermediate lows, but it did not stay there long and appears to be rapidly building a new base which will soon allow it to get back into an uptrend.
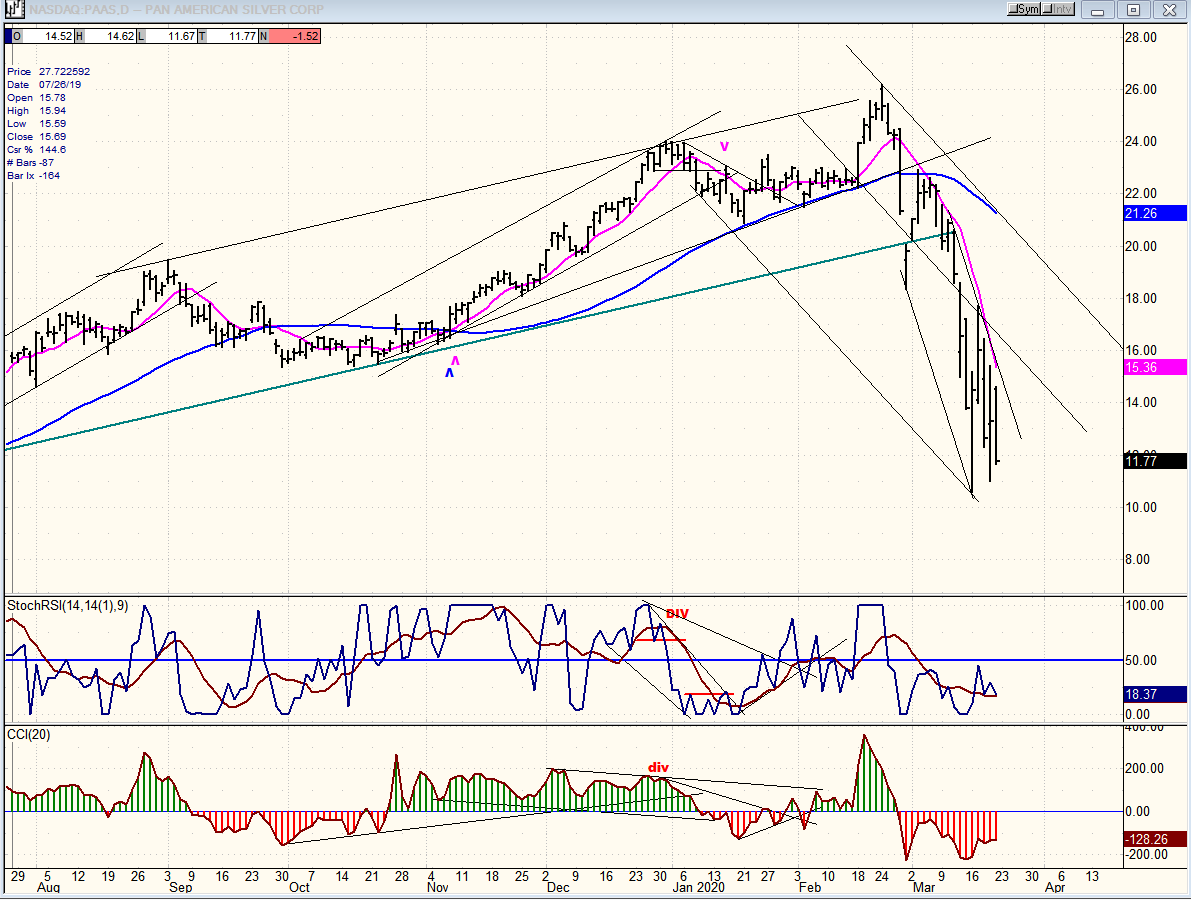
PAAS (Pan American Silver Corp)
Silver has also been affected by the dollar’s behavior and it, too (similarly to GDX), may be nearly ready to complete its base and get back into an uptrend.
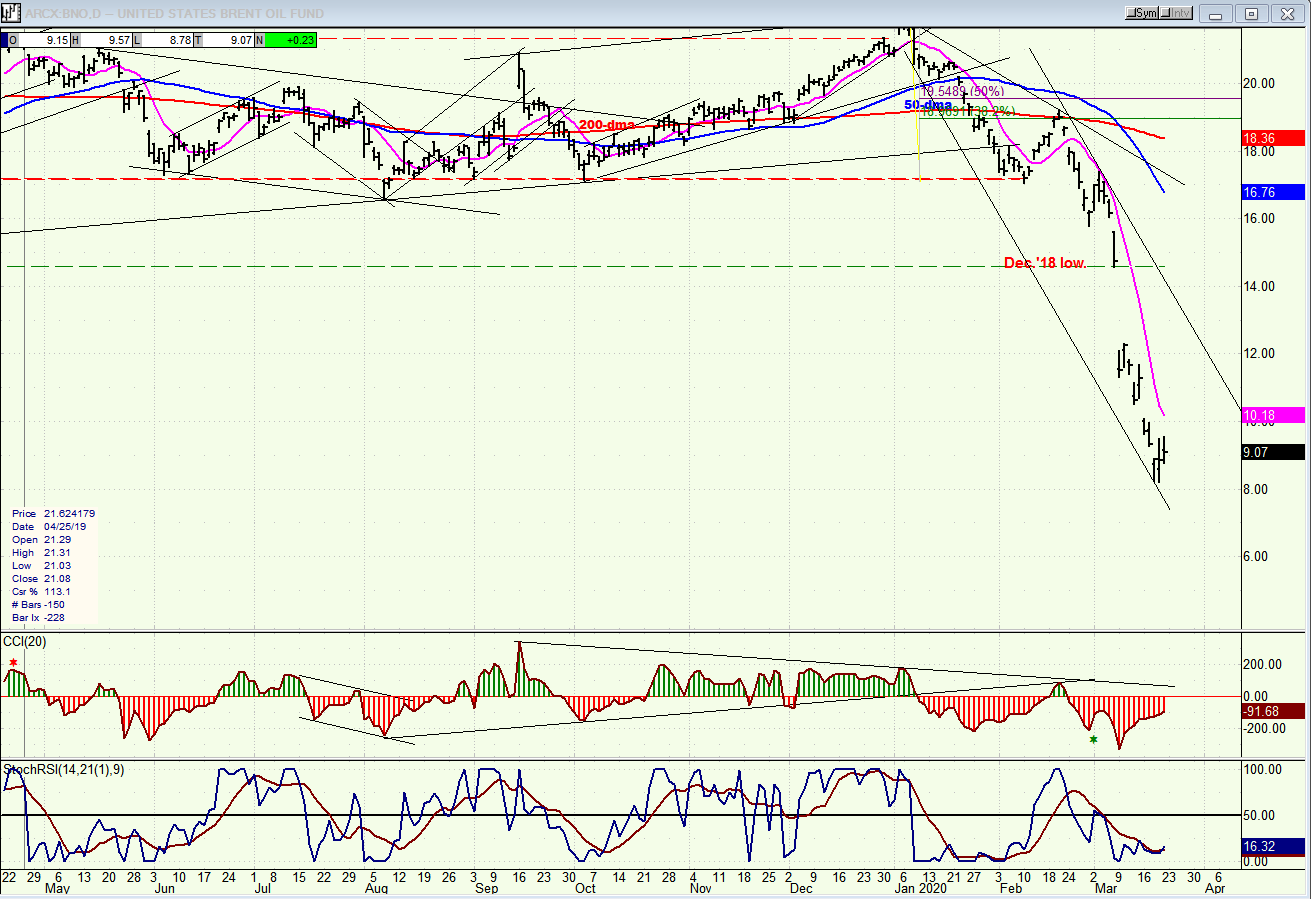
BNO (U.S. Brent Oil fund)
BNO has reached its 9.00 projection, retesting the 2014 low. It is not clear if its next long-term trend will be to build another base in this area, or whether it is destined to go even lower -- which is possible if the market enters a prolonged correction.
Summary
After a decline of 923 points in four weeks – mostly in 3 weeks -- SPX shot straight up 230 points in one day. This market is not for the faint-hearted! After some volatile hesitation it is expected to continue its progress to 2800.
The first counter-trend rally fell short of its entire projection and quickly gave way to new lows. A minor cycle low coming next week could lead to another quick spike, but we will have to wait until the second week in April for something more important to develop.
Free trial subscription
With a trial subscription, you will have access to the same information that is given to paid subscribers, but for a limited time period. Over the years, I have developed an expertise in P&F charting (price projection), cycles (timing), EWT (structure), and general technical analysis which enables me to warn subscribers of pending reversals in market trends and how far that trend can potentially carry. For a FREE 4-week trial, subscription options and payment plans, I encourage you to visit my website at www.marketurningpoints.com.
The above comments and those made in the daily updates and the Market Summary about the financial markets are based purely on what I consider to be sound technical analysis principles. They represent my own opinion and are not meant to be construed as trading or investment advice, but are offered as an analytical point of view which might be of interest to those who follow stock market cycles and technical analysis.
*********

When Andre Gratian was a stock broker years ago, a friend introduced him to technical analysis of the market. Consequently, it is not an exaggeration to say that Andre fell in love with this approach! Ever since then, it has become an increasingly important part of his professional life. Gratian has studied the works of Wyckoff, Edwards & Magee, Edward J. Dewey (cycles) and many others. However, one of my most profitable undertaking has probably been to study Point & Figure charting, which he finds invaluable in analyzing stocks and indices. If he were restricted to one methodology, this is the one that he would choose. This well-rounded background has given him what he feels to be a special insight into the stock market, facilitating the recognition of meaningful patterns and the ‘turning points’ in all trends, whether they be short or long term. Andre feels very comfortable discussing the stock market and passing on meaningful information to others. His subscribers include individuals and money managers throughout the world. Moreover, his Newsletters are currently published on several financial sites, here and abroad.


