Technical Analysis Of The Markets


Current Position of the Market
SPX Long-term trend: There is some good evidence that we are still in the bull market which started in 2009 and which could continue into the first quarter of 2021 before coming to an end.
SPX Intermediate trend: New intermediate uptrend underway since 2234.
Analysis of the short-term trend is done daily with the help of hourly charts. They are important adjuncts to the analysis of daily and weekly charts which determine longer market trends.
New Short-term Target
Cycles: Looking ahead! 90-yr cycle – last low: 1932. Next low: 2022
7-yr cycle – last low: 2016. Next low: 2023
Market Analysis (Charts courtesy of QCharts
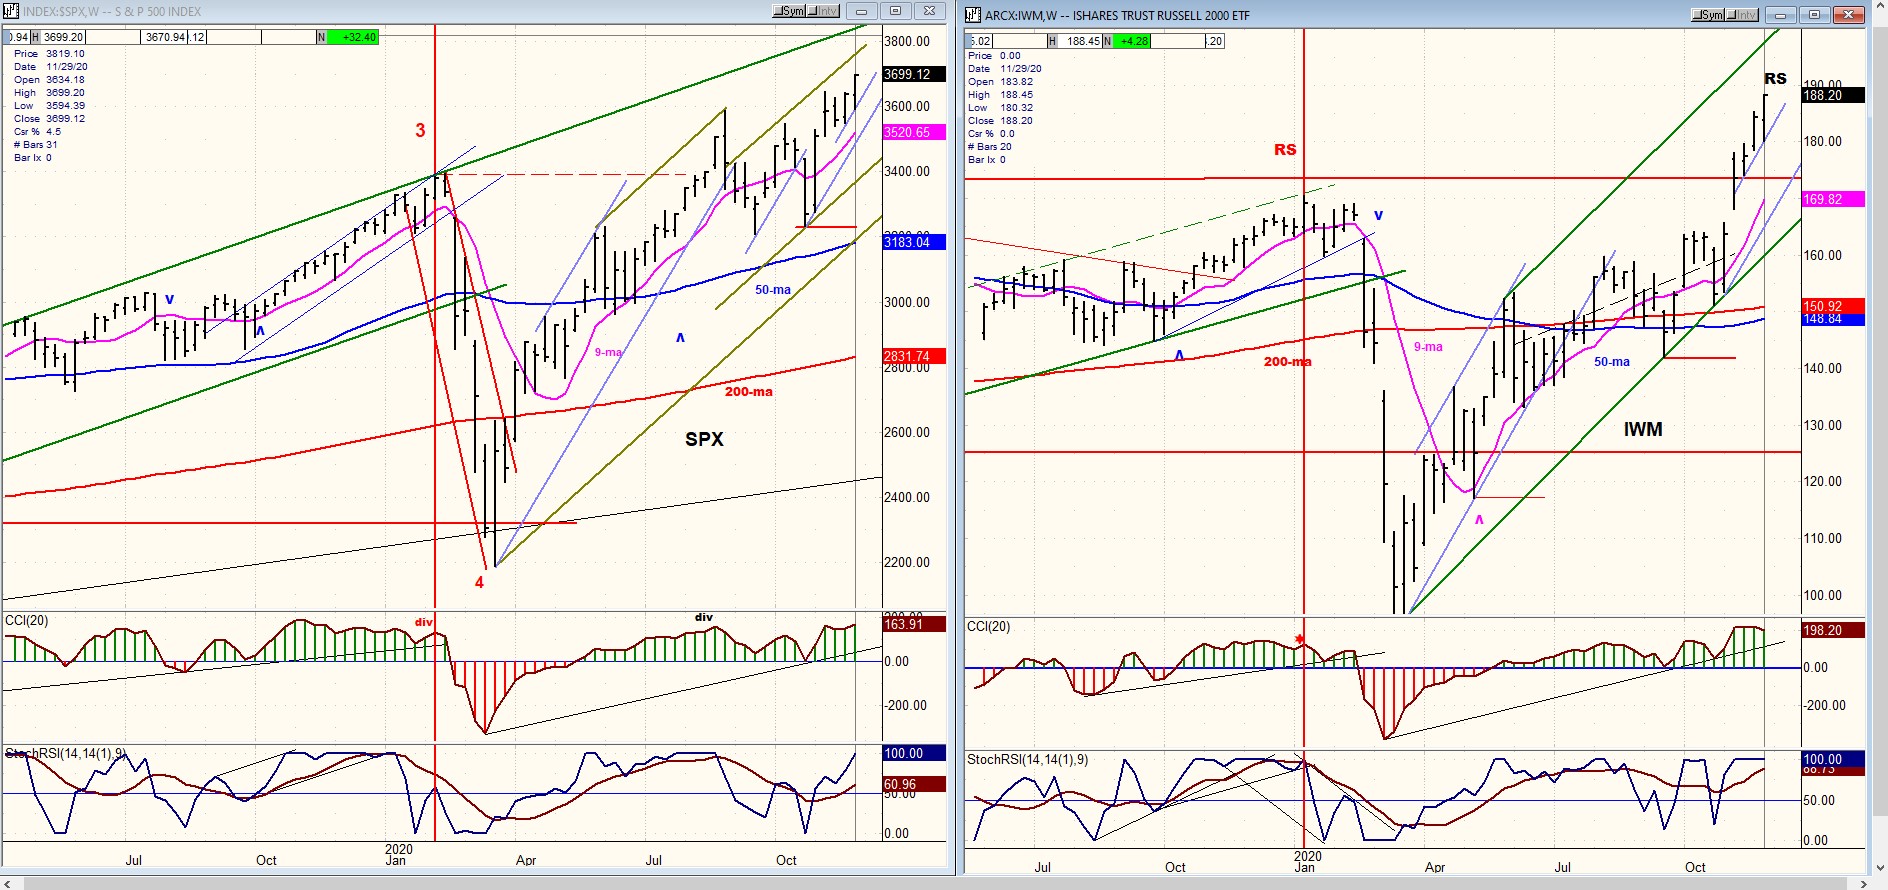
SPX-IWM weekly charts
Over the past few weeks, IWM has caught up with SPX by outperforming it. There were signs this week that it may be slowing down as we approach the next short-term projection. However, this does not mean that we are anywhere close to a major top. That could still be 4 to 6 months away!
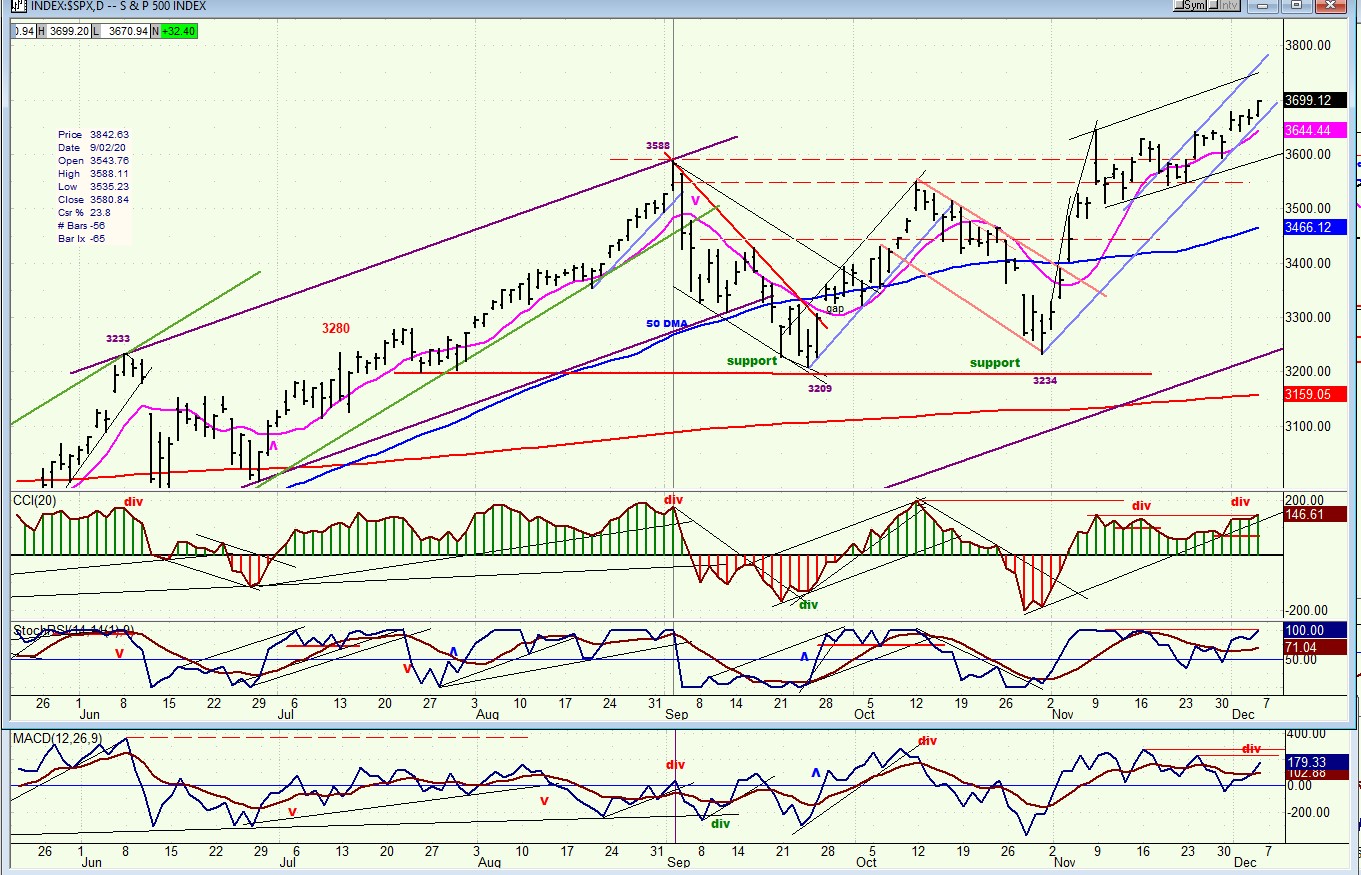
SPX daily chart
In spite of the negative divergence that was showing in its oscillators last week, SPX has managed to push ahead and make a new all-time high, going against the influence of a cycle that should have produced a short-term top this week. We know that cycle phases can be disrupted by news which can impact the economy and in this case, the promise of another relief bill which could become law by the end of next week is the cause. There is some expectation that congress will finally come through with a compromise bill which can satisfy both parties. This possibility caused the index to only go into a small holding phase after reaching its last target of 3660+, and quickly build another congestion level which would permit it to reach another short-term top; it has also allowed SPX to remain inside its steepest intermediate trend line (blue) which, when it is broken, will mark the onset of the next short-term correction (this will be discussed in more detail in the hourly chart section).
Although the oscillators retain some negative divergence, they have improved their positions, especially the A-Ds oscillator which improved the most.
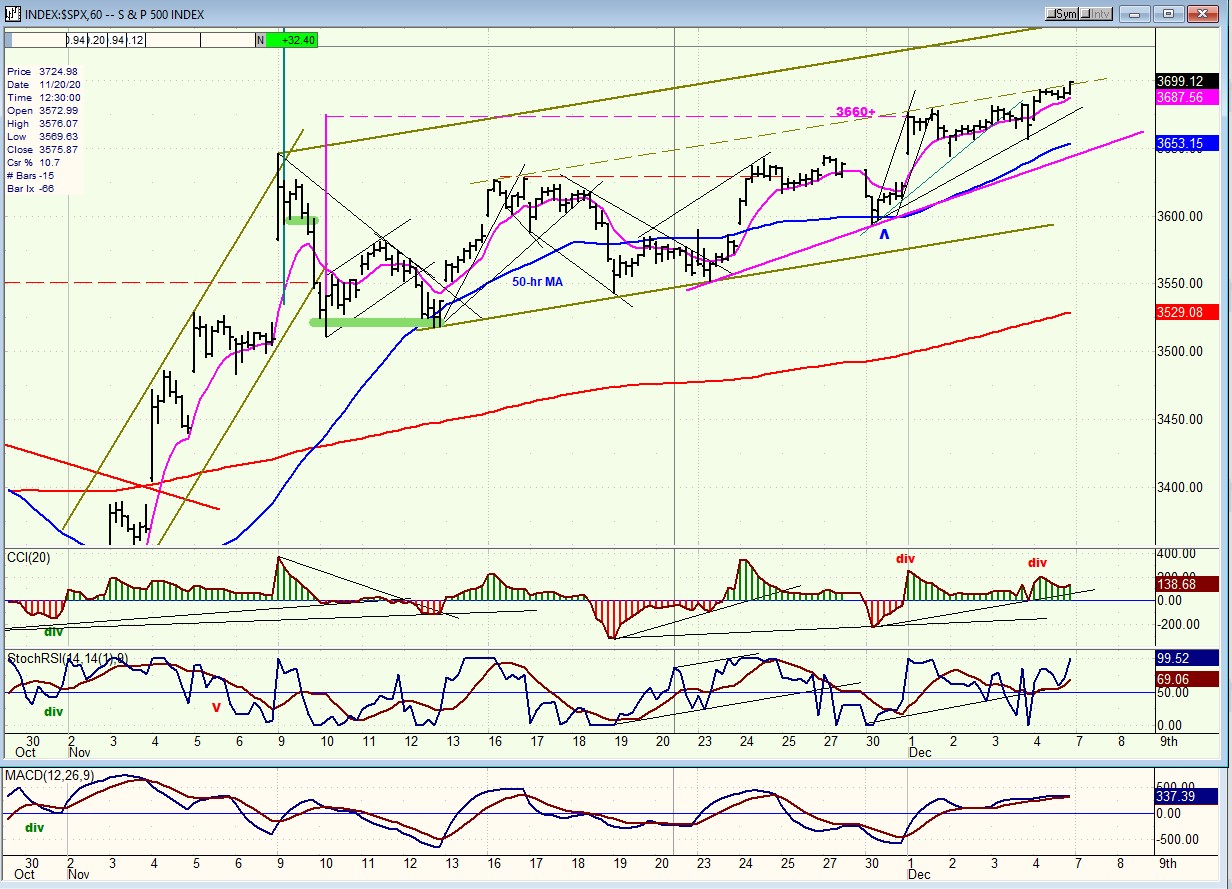
SPX hourly chart
Considering how SPX closed on Friday, it is obvious that it intends to move higher unless some negative news occurs over the weekend. After reaching its 3660+ projection (original target), the index manufactured another level of consolidation which can carry it to 3740 (the maximum amount of uptrend we can extract from the base created by the Point & Figure chart at the 3520 level). More specifically, the chart formation argued for the move to logically stop at 3660+, but optimism about another relief bill is forcing us to extend the count to include another part of the chart that had been considered too extreme to consider (top green mark on the chart).
Despite the revival of strength in the index, negative divergence has persisted in the CCI, but the leading SRSI has made a new high.
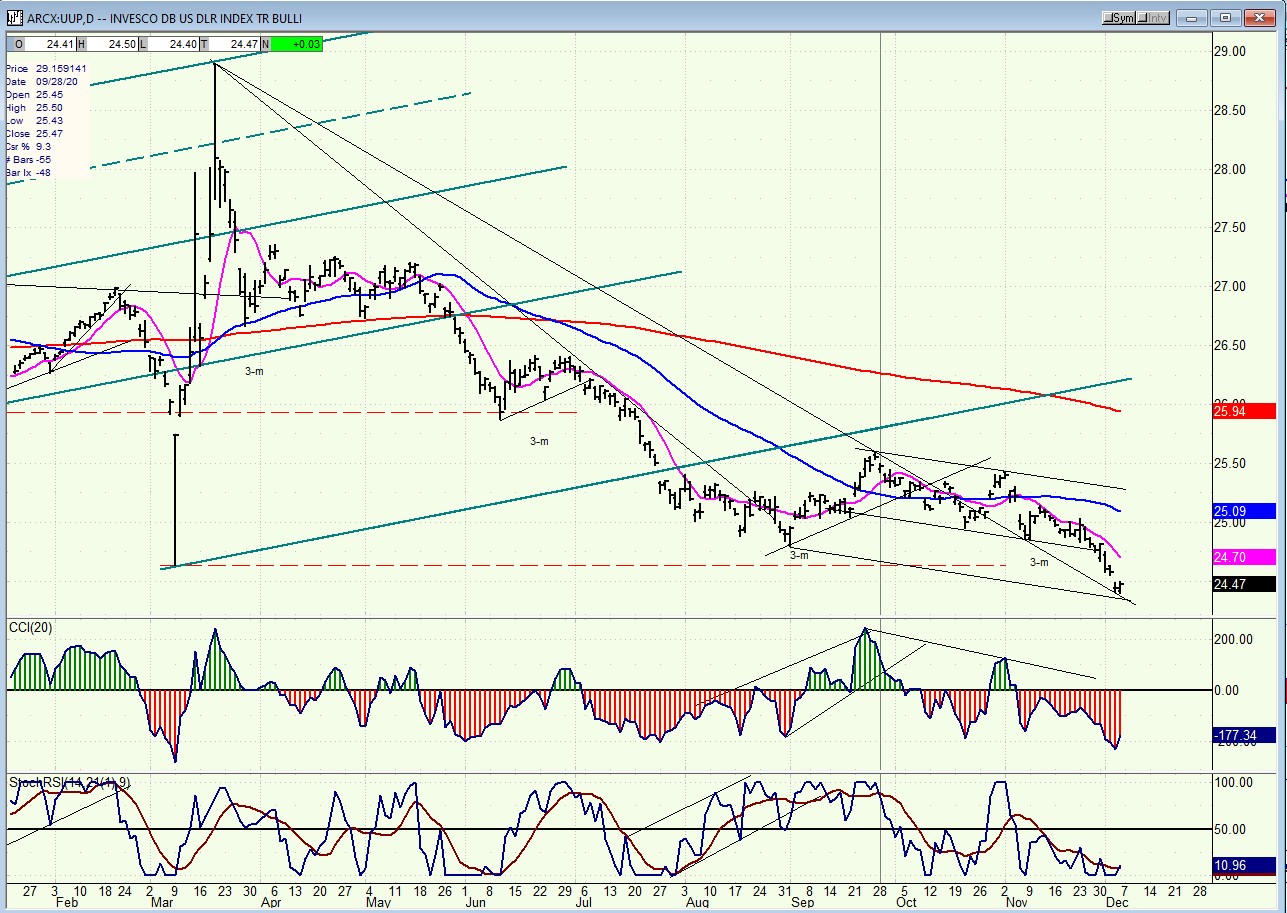
UUP (dollar ETF) ($USD chart not available from this data provider)
UUP has continued to drop beyond the 3-mo cycle low. This could be the effect of another larger, unknown (to us) cycle. For the time being, the index may find support on the extension of its former trend line and an expanded channel bottom, but it will have to prove that it is able to hold this level, and stage a rally which may be short-lived; the dollar (91) P&F chart suggests that it is heading for 89, its next downside target.
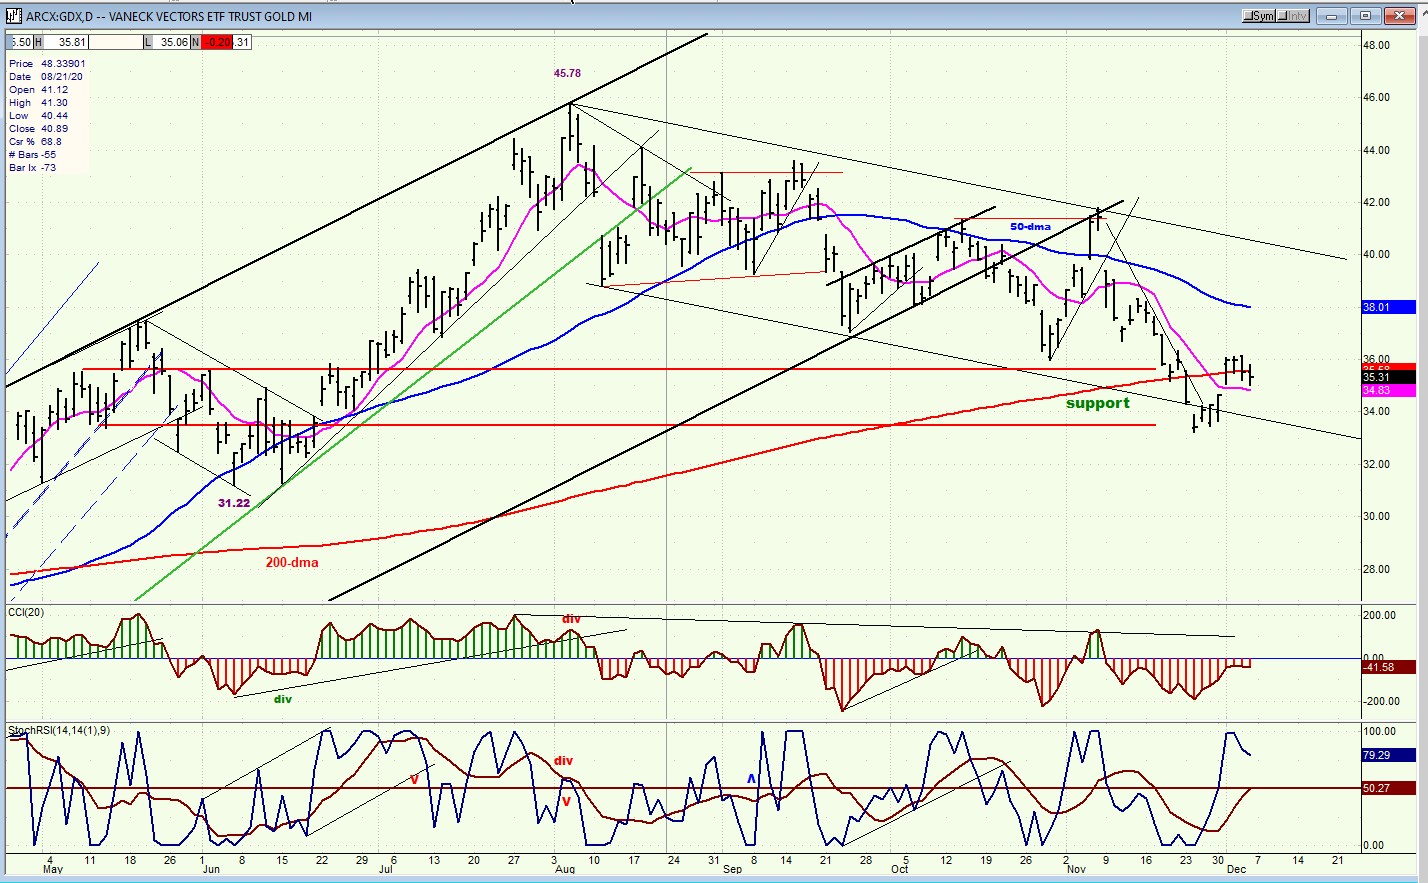
GLD (gold-wkly), GDX (gold miners-dly)
GLD found support on is 50-wk MA and rallied, but will have to comeback to retest its low and build a base before it is able to resume its uptrend. Gold bulls must be patient!

GDX also had a good bounce back to the 200-dma which it had broken recently. Some base-building will also be required here before a new uptrend can take hold. Being able to surmount not only the 200-dma, but its 50-dma will be required before it can resume its long-term uptrend.
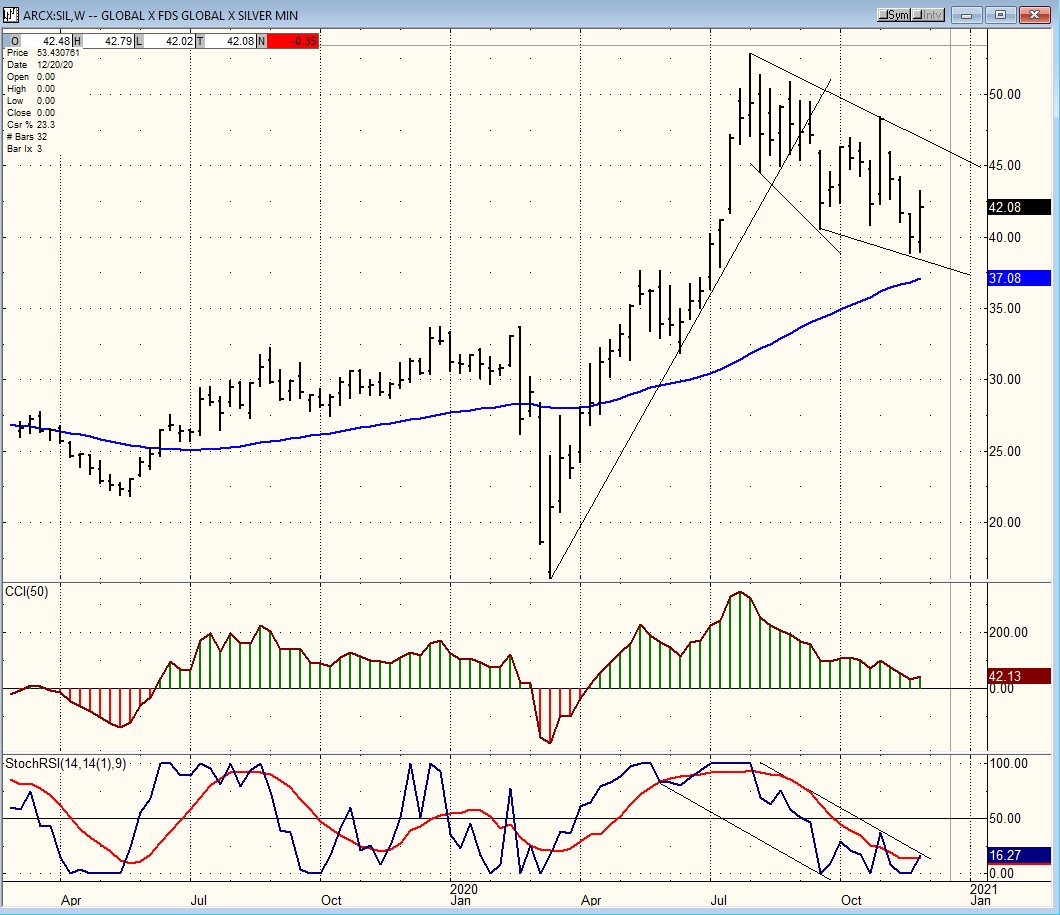
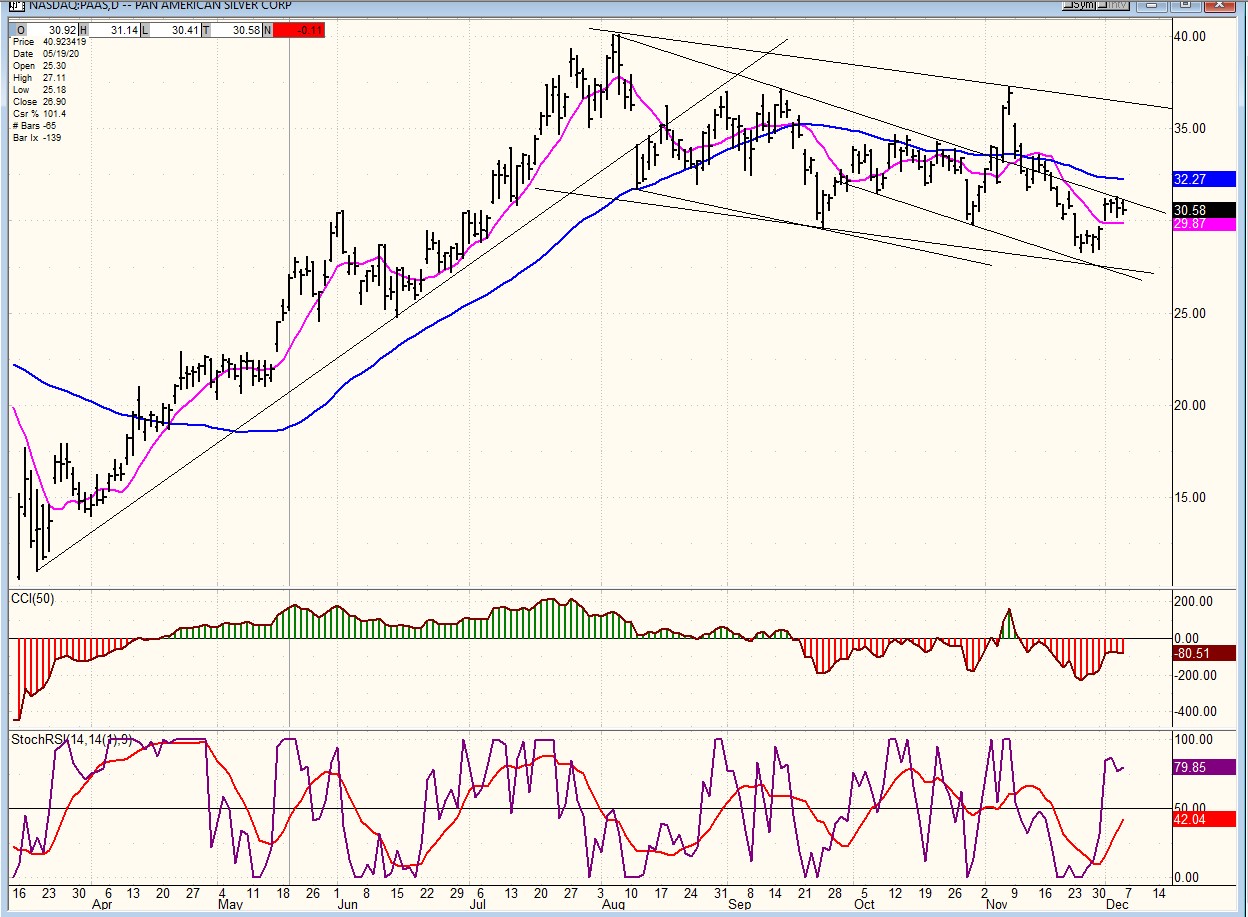
SIL (silver-wkly), PAAS (Pan American Silver Corp-dly)
Silver is showing its relative strength to gold by the fact that it found support above its 50-dma. However, like gold, it will need to build a base before it can challenge its declining intermediate trend line.
The same reasoning applies to PAAS!
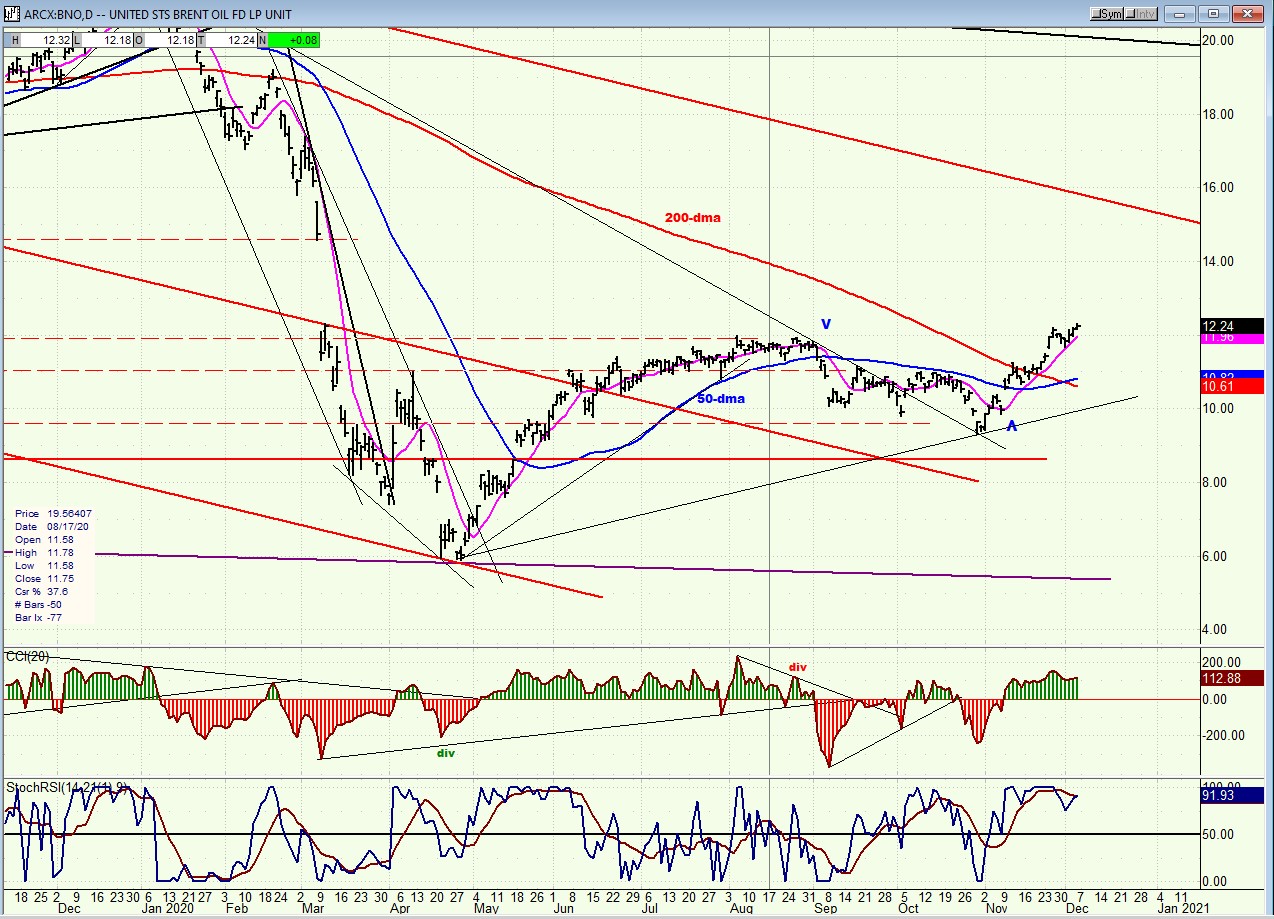
BNO (U.S. Brent Oil fund)
BNO had a good rally, but it may be close to ending its uptrend. This should be followed by a retracement and consolidation before it is able to continue its move to 14+.
SUMMARY
After reaching its former 3460+ target, SPX created a small congestion shelf as the next launch pad which would permit it to reach 3740 -- if the new proposed relief bill is passed.
Andre
You may view our website at https://marketurningpoints.com
Free trial subscription
With a trial subscription, you will have access to the same information that is given to paid subscribers, but for a limited time-period. Over the years, I have developed an expertise in P&F charting (price projection), cycles (timing), EWT (structure), and general technical analysis which enables me to warn subscribers of pending reversals in market trends and how far that trend can potentially carry. For a FREE 2-week trial, subscription options and payment plans, I encourage you to visit my website at https://marketurningpoints.com
The above comments and those made in the daily updates and the Market Summary about the financial markets are based purely on what I consider to be sound technical analysis principles. They represent my own opinion and are not meant to be construed as trading or investment advice but are offered as an analytical point of view which might be of interest to those who follow stock market cycles and technical analysis.
********

When Andre Gratian was a stock broker years ago, a friend introduced him to technical analysis of the market. Consequently, it is not an exaggeration to say that Andre fell in love with this approach! Ever since then, it has become an increasingly important part of his professional life. Gratian has studied the works of Wyckoff, Edwards & Magee, Edward J. Dewey (cycles) and many others. However, one of my most profitable undertaking has probably been to study Point & Figure charting, which he finds invaluable in analyzing stocks and indices. If he were restricted to one methodology, this is the one that he would choose. This well-rounded background has given him what he feels to be a special insight into the stock market, facilitating the recognition of meaningful patterns and the ‘turning points’ in all trends, whether they be short or long term. Andre feels very comfortable discussing the stock market and passing on meaningful information to others. His subscribers include individuals and money managers throughout the world. Moreover, his Newsletters are currently published on several financial sites, here and abroad.


