Technical Analysis Of The Markets


Current Position of the Market
SPX Long-term trend: There is some evidence that we are still in the bull market which started in 2009 and which could continue into 2021 before major cycles take over, and it ends. A move up to ~4500 is possible before the current bull market makes a final top and SPX corrects into its next major cycle low due in 2023.
SPX Intermediate trend: Phase three (wave 5 from 3723) is now likely underway.
Analysis of the short-term trend is done daily with the help of hourly charts. They are important adjuncts to the analysis of daily and weekly charts which determine longer market trends
Approaching an Intermediate peak!
Cycles: Looking ahead!
7-yr cycle – Last lows: 2009-2016. Next low: ~2023
Market Analysis (Charts, courtesy of QCharts)
WEEKLY INDICES:
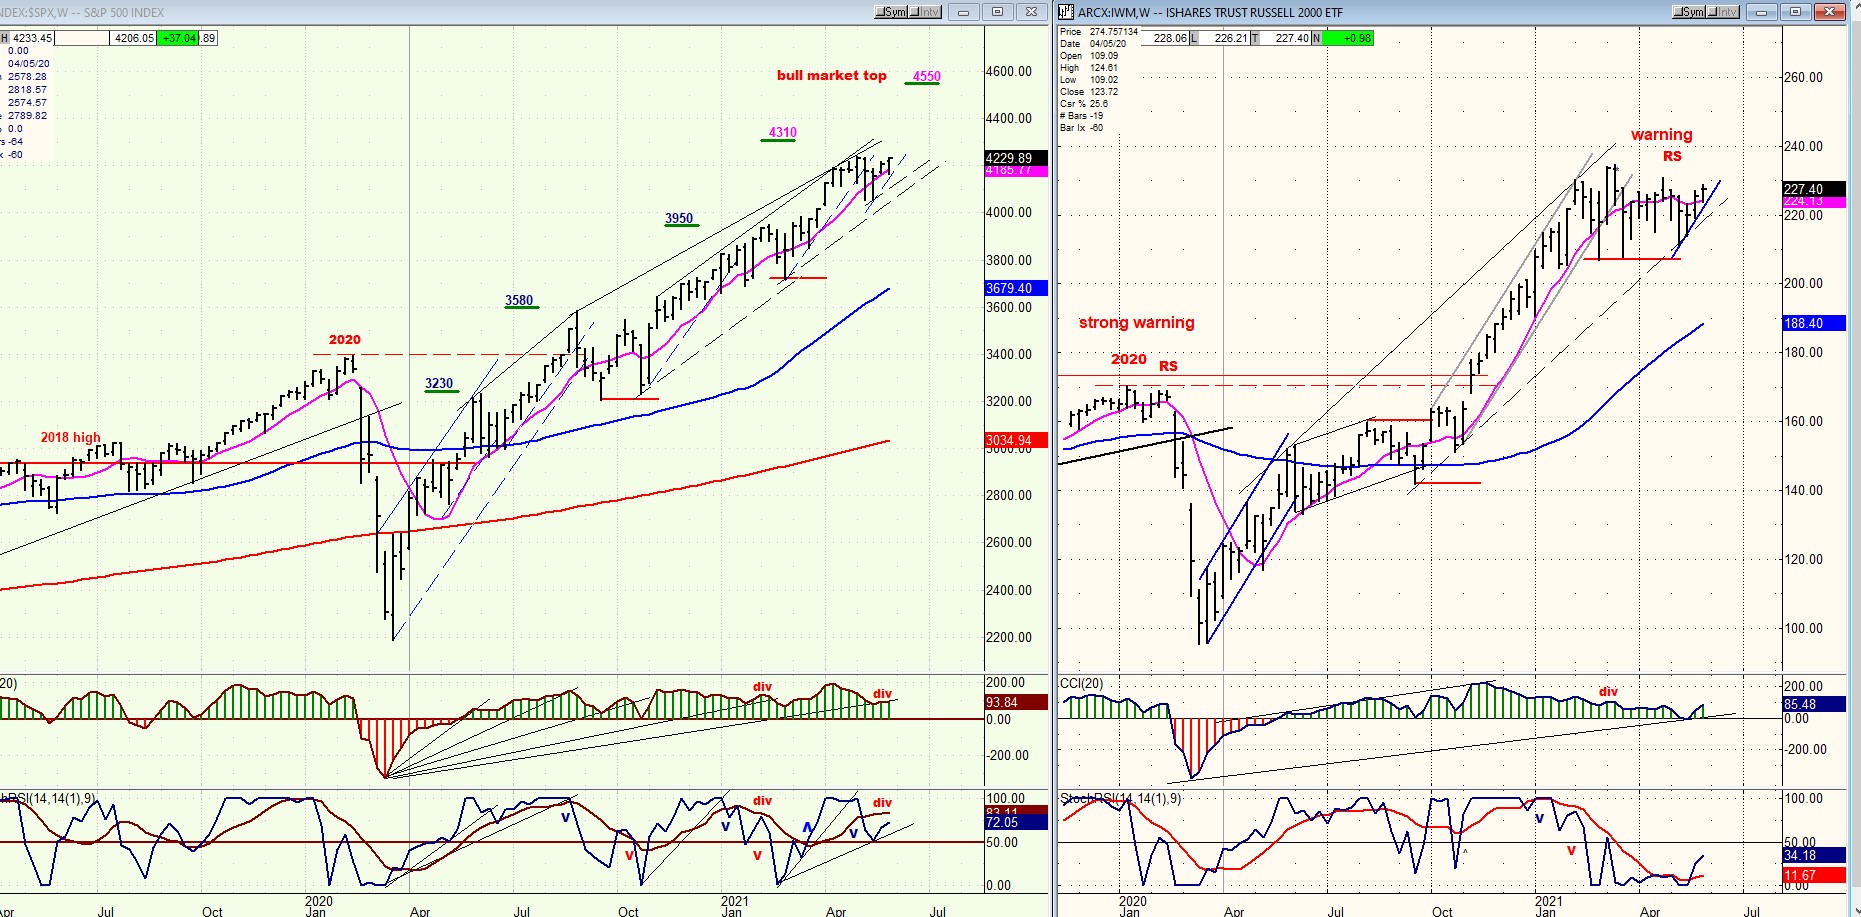
IWM vs. SPX
I have already mentioned that IWM had issued a warning that a correction is coming. Now let us turn to the more precise prediction that we will shortly be making an intermediate top in the market. It comes from the long-term Point & Figure chart of the SPX.
The accumulation base that was formed at the 2020 low can be divided into phases, each of which giving us a projection of price levels to where SPX should correct as it climbs to its ultimate bull market peak. On its weekly chart, I have posted the various targets. Each represents a level where the index was expected to consolidate before moving higher. You can see how accurate they have been. We are approaching the next to last target of 4310 which should mark the start of an important intermediate correction, perhaps more in the order of the one which took place at the 3580 level. Although the previous ones have been uncannily accurate, it is always possible that the next two – because we are approaching the top of the bull market – will only be close approximations. We will soon know!
The two oscillators at the bottom of the chart have been helpful for determining the validity of the projection. The current target is no exception. As you can see, they are also forecasting an intermediate correction directly ahead by showing strong negative divergence.
A final note regarding an imminent top: Eric Hadik is forecasting the inversion of an intermediate cycle in this time frame.
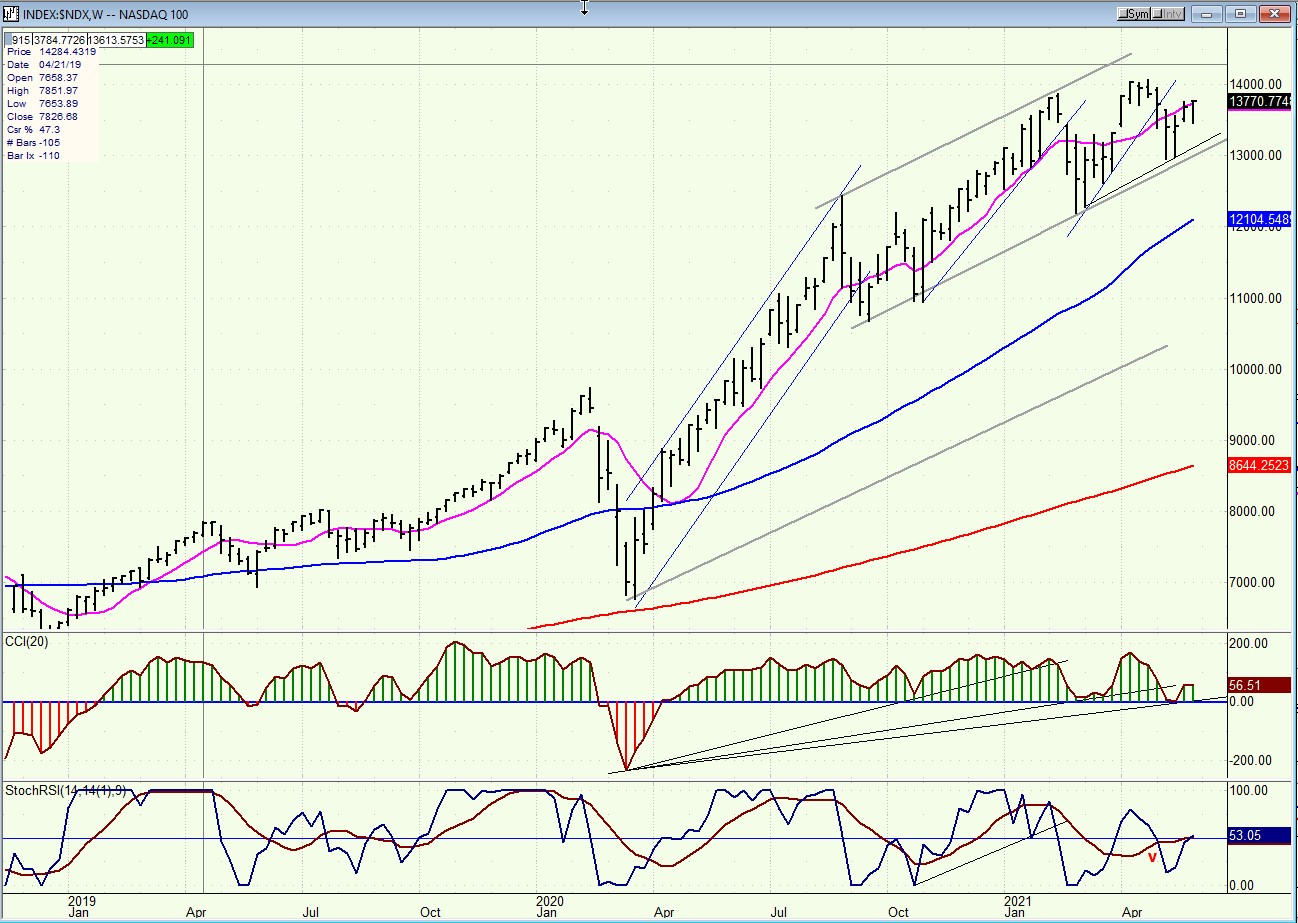
NDX
It looks as if NDX is already making an important topping formation. When you compare it to the SPX chart above, you can see that the process of deceleration is more advanced, and while SPX challenged its former high last week, NDX ended the week below both former highs. If it does not attract more buyers next week, it could end up reversing and starting a downtrend ahead of SPX. The process of deceleration in NDX has been evident for some time. It started in the Fall of last year and has increased significantly since the beginning of the year.
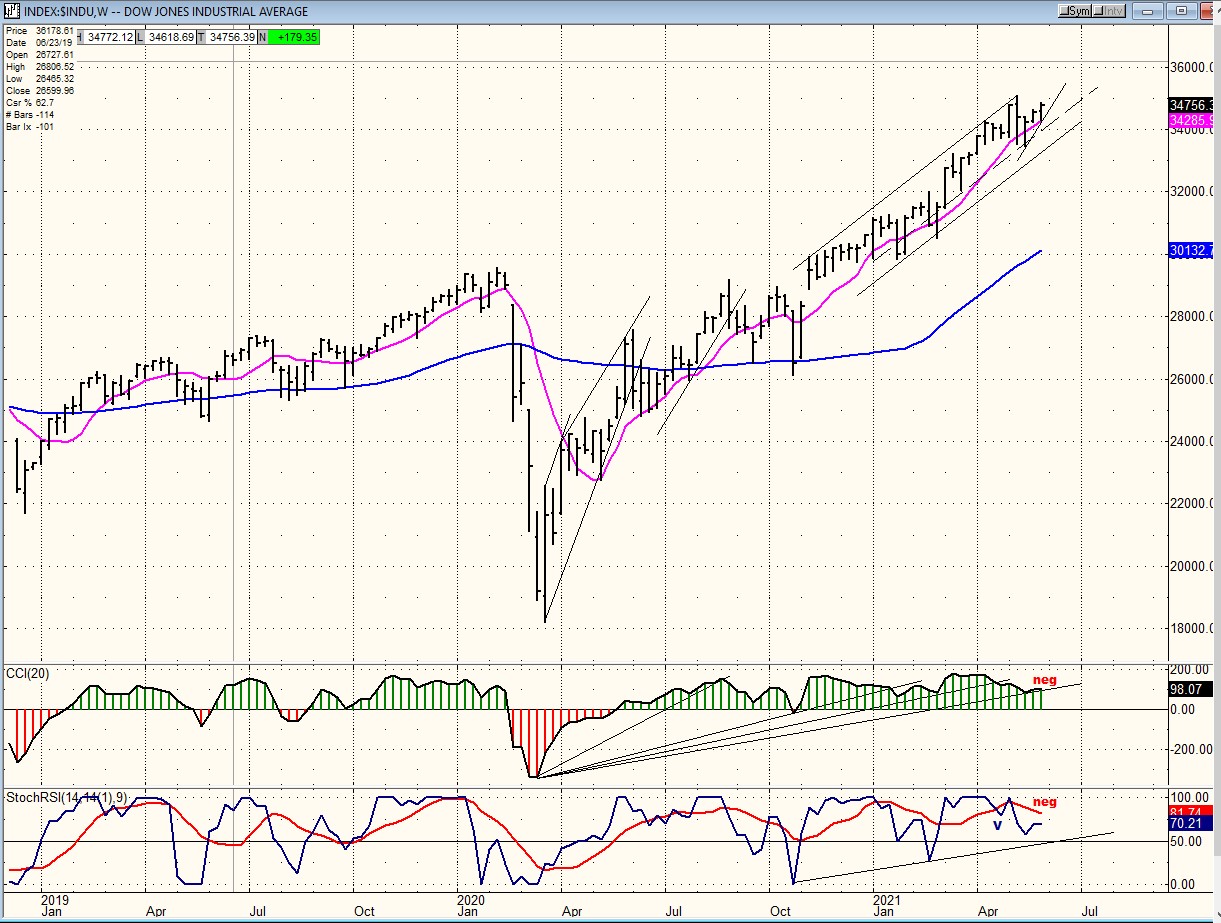
DJIA
The current state of the DJIA is closer to that of SPX and the condition of its oscillators are almost identical to the latter’s. SPX is the only one on which I keep a P&F chart but, since SPX is essentially a hybrid of both NDX and DJIA, we can see that the corrections in SPX occur during the same time periods as they do in the other two indices. Therefore, we can pretty much assume that the correction forecasted by SPX will similarly affect the other two indices.
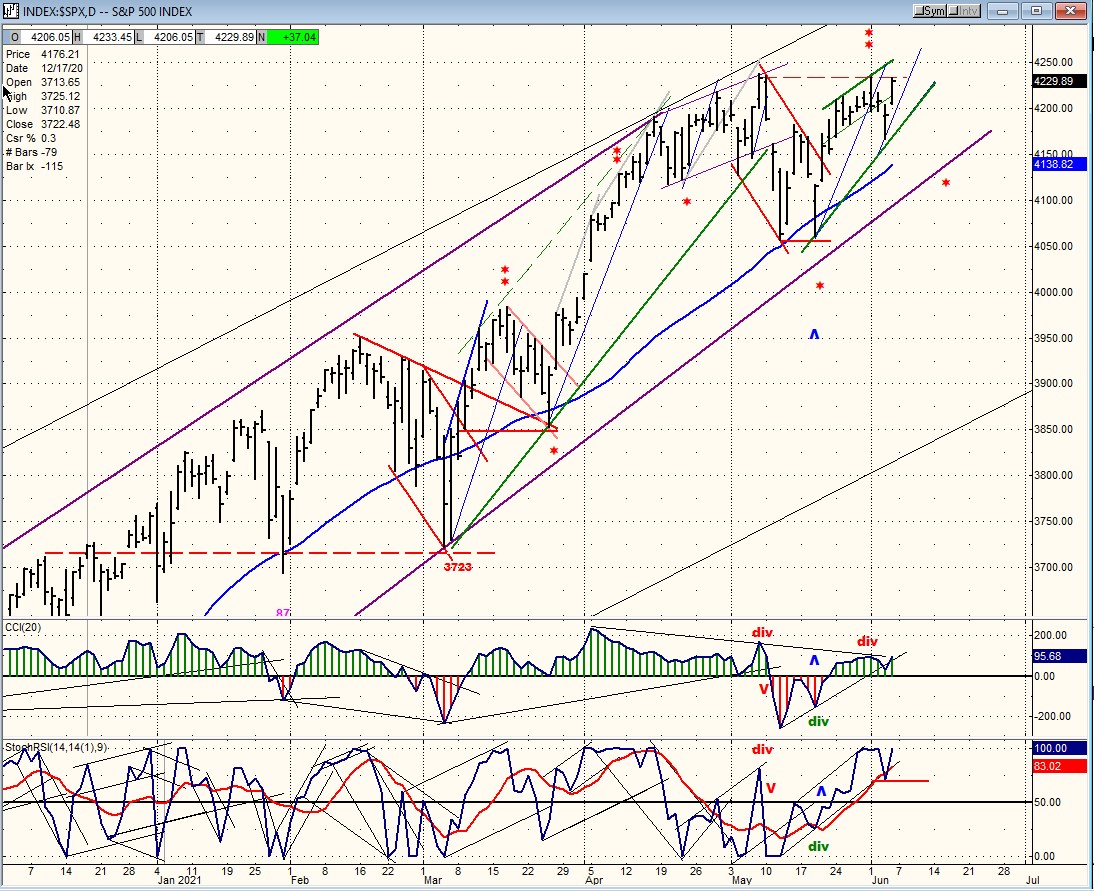
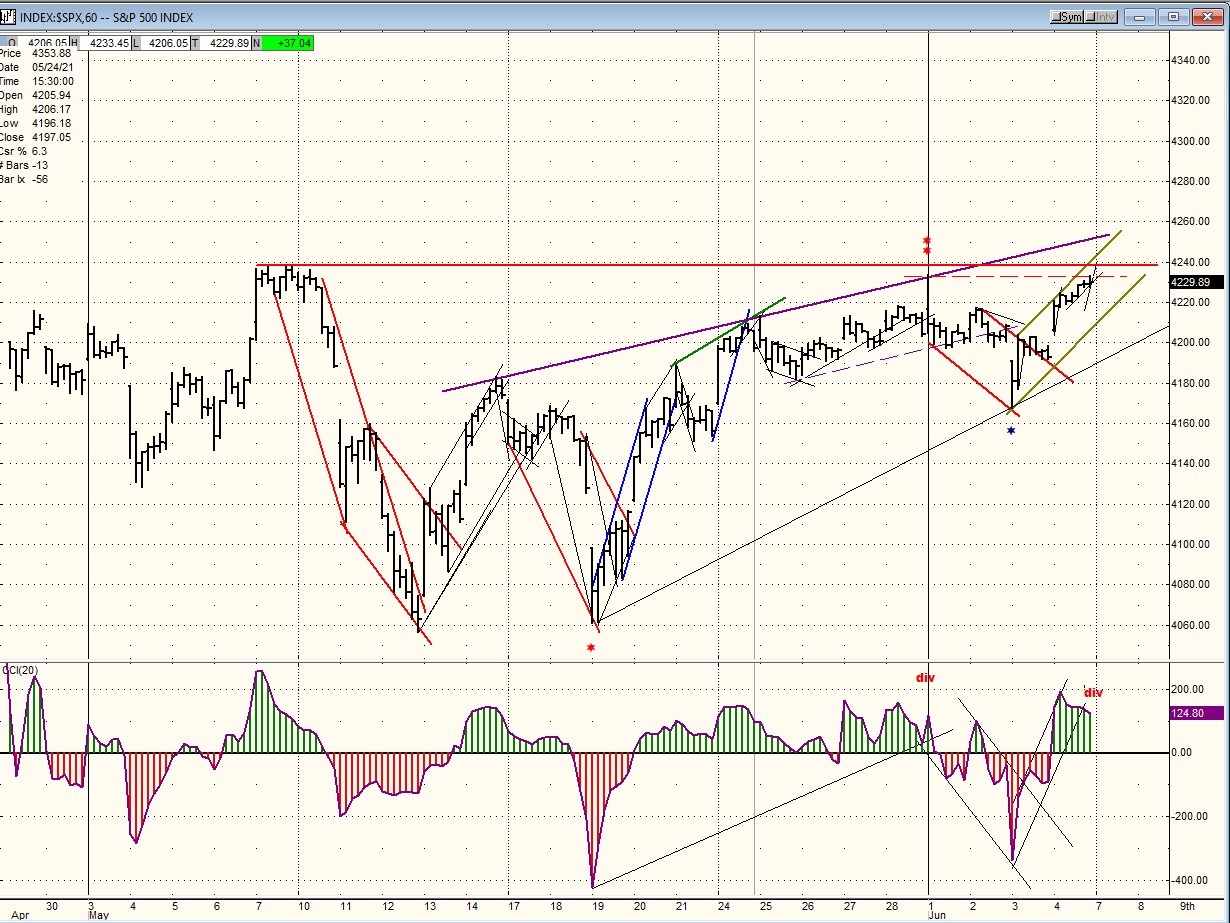
SPX daily chart
The red asterisks on the daily chart represent the regular beat of the ~19-td cycle. One asterisk represents the low and two the ideal top. As you can see the top can vary but the low is consistent. We can therefore expect a near-term top to arrive at any time since we are already past the halfway mark, but because Friday was a strong day which ended near the end of the move, we could see a price extension before we pull back. We are coming up against a double top which could offer some resistance; on the other hand, last week’s minor correction was caused by another short-term cycle which has now turned up and this could temporarily offset the bearish action of the regular short-term cycle and take prices a little higher before it makes its low.
The daily oscillators are not great, especially the CCI, but with higher short-term as well as intermediate counts, it is not in any immediate danger of turning down and can still rise higher.
The index has managed to remain above its 50-dma in every correction, even bouncing back above it immediately when it was breached temporarily. The uptrend from 3720 will most likely end when it is broken decisively. Then we can assess the extent of the correction ahead of us based on the amount of congestion which has been formed at the high.
SPX hourly chart
The short-term cycle which was anticipated to make its low last week proved to be minute instead of minor. It could have taken the index some thirty points lower but did not. Perhaps the proximity of the jobs report contributed to the shallow pullback. Friday’s rally fell just short of creating a new all-time high but, despite the nearness of the next short-term cycle low (about 6/15) there are plenty of higher short-term counts confirming the base phase potential to ~4310. So, even if we should get a little pull-back here, we could still move higher, fall back into the cycle low, and then move higher into the intermediate high. Even though I am urging caution, I am not suggesting an immediate decline but one which could start most likely in two or three weeks.
The CCI has developed some negative divergence, but any pullback should be limited and followed by another high before we pull back into the cycle low.
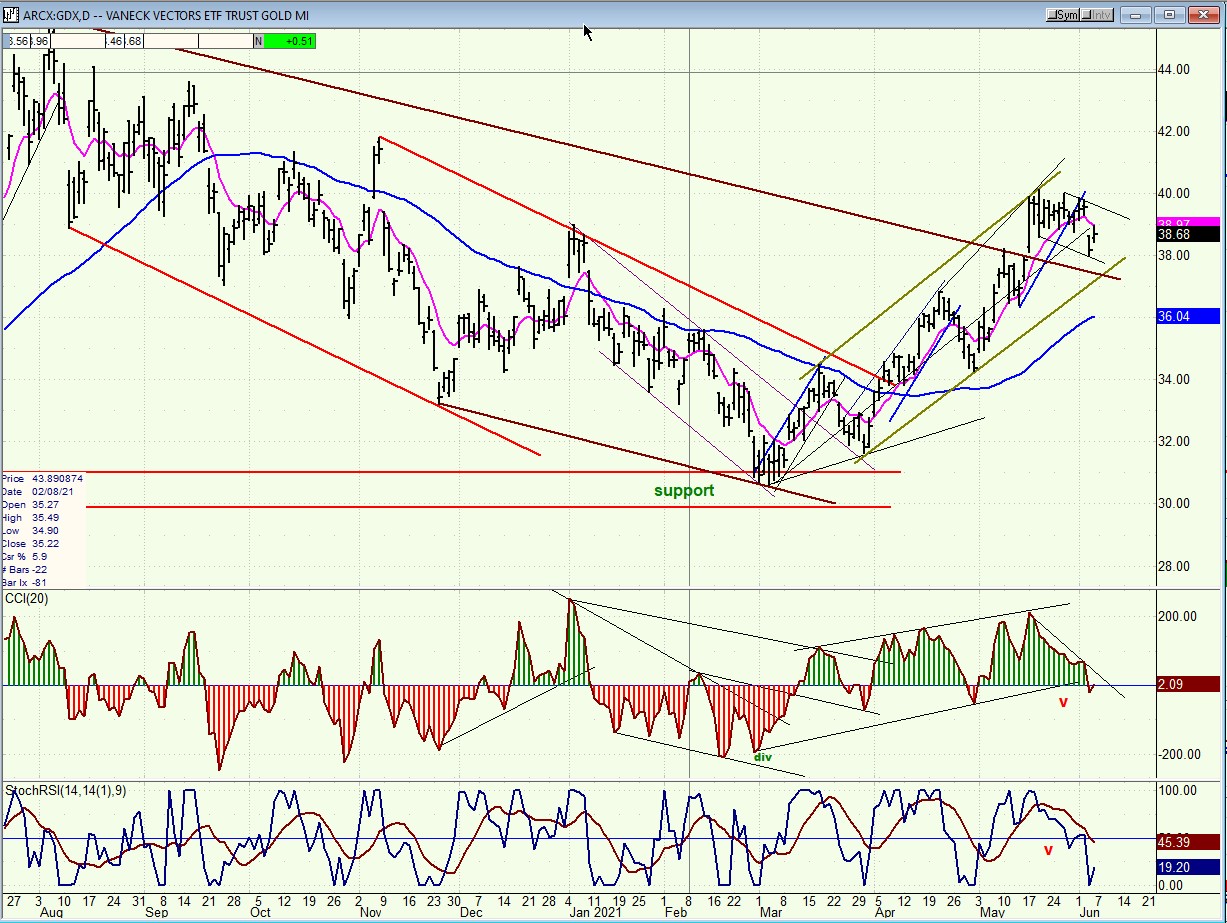
GDX (gold miners)-(dly)
GDX is consolidating its initial uptrend after completing an intermediate correction. It does not look quite ready to move higher and could spend a few more days completing its consolidation.
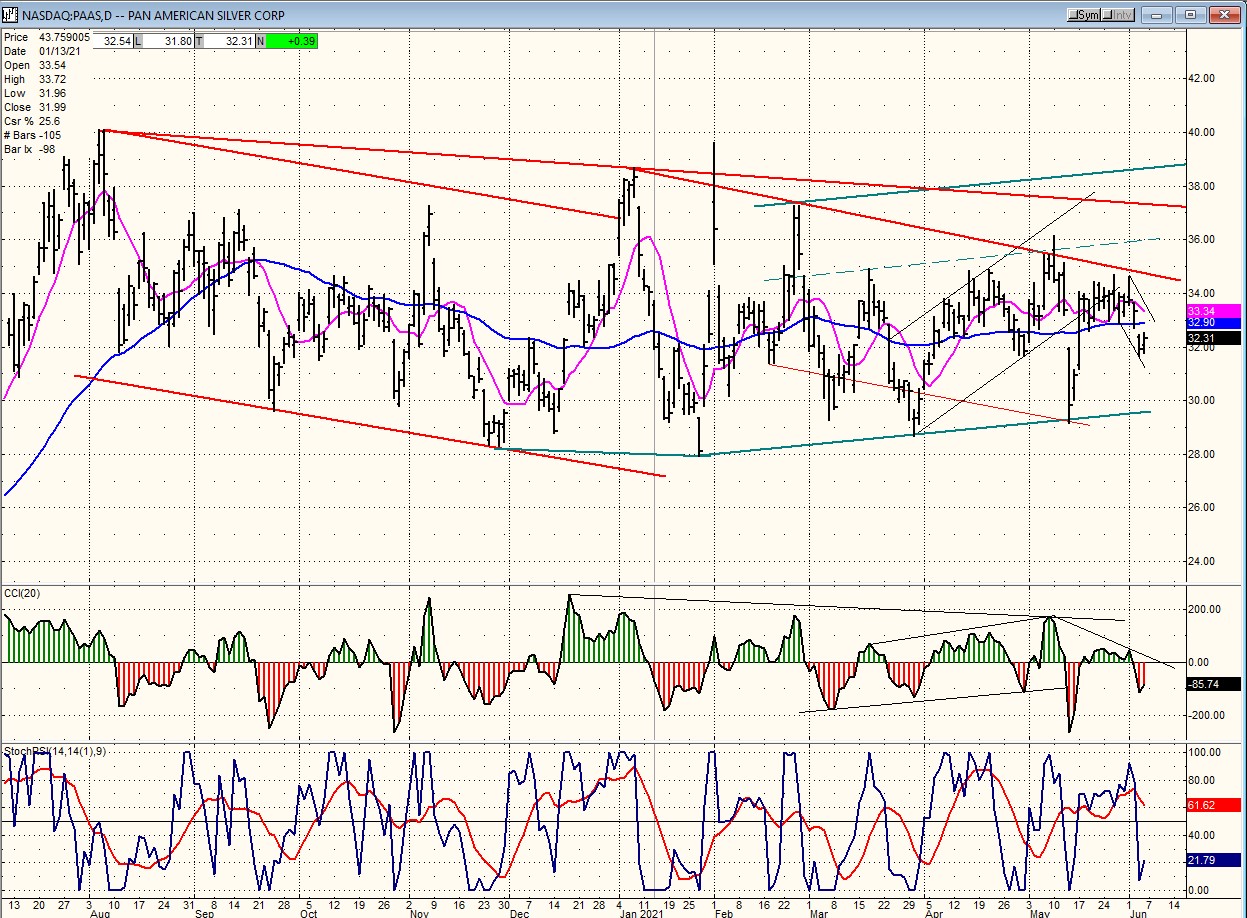
PAAS (Pan American Silver Corp-(dly)
PAAS is also consolidating, and like GDX should be ready to resume its up-move when it breaks above the first red downtrend line. Both have substantial bases established and there is no reason to think that their rallies are over, but this does not tell us when they will be ready to extend their uptrends.
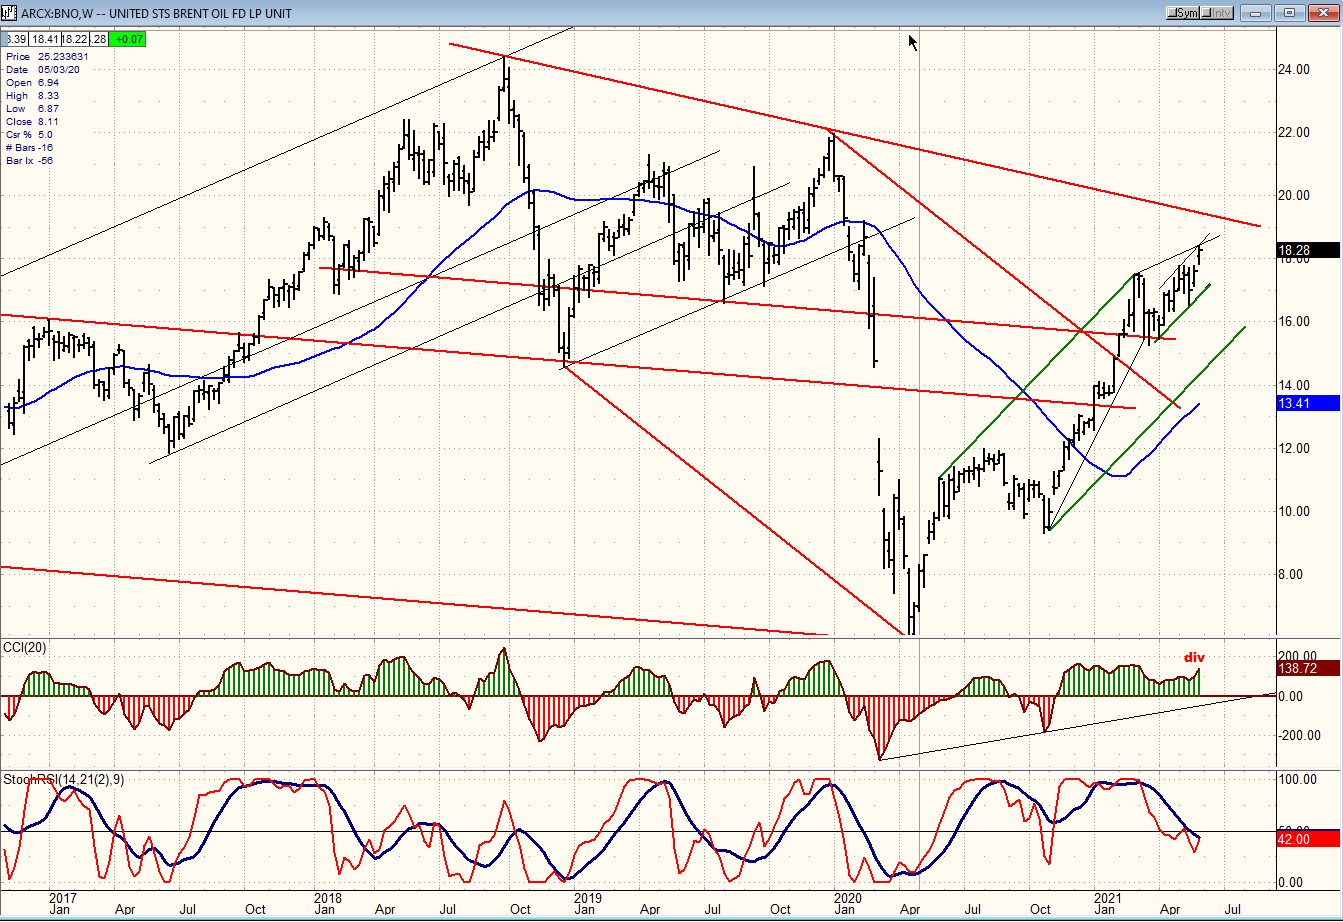
BNO (Brent oil fund) wkly
BNO has pushed higher and may continue its uptrend until SPX is ready to correct. However, upside looks limited at this time.
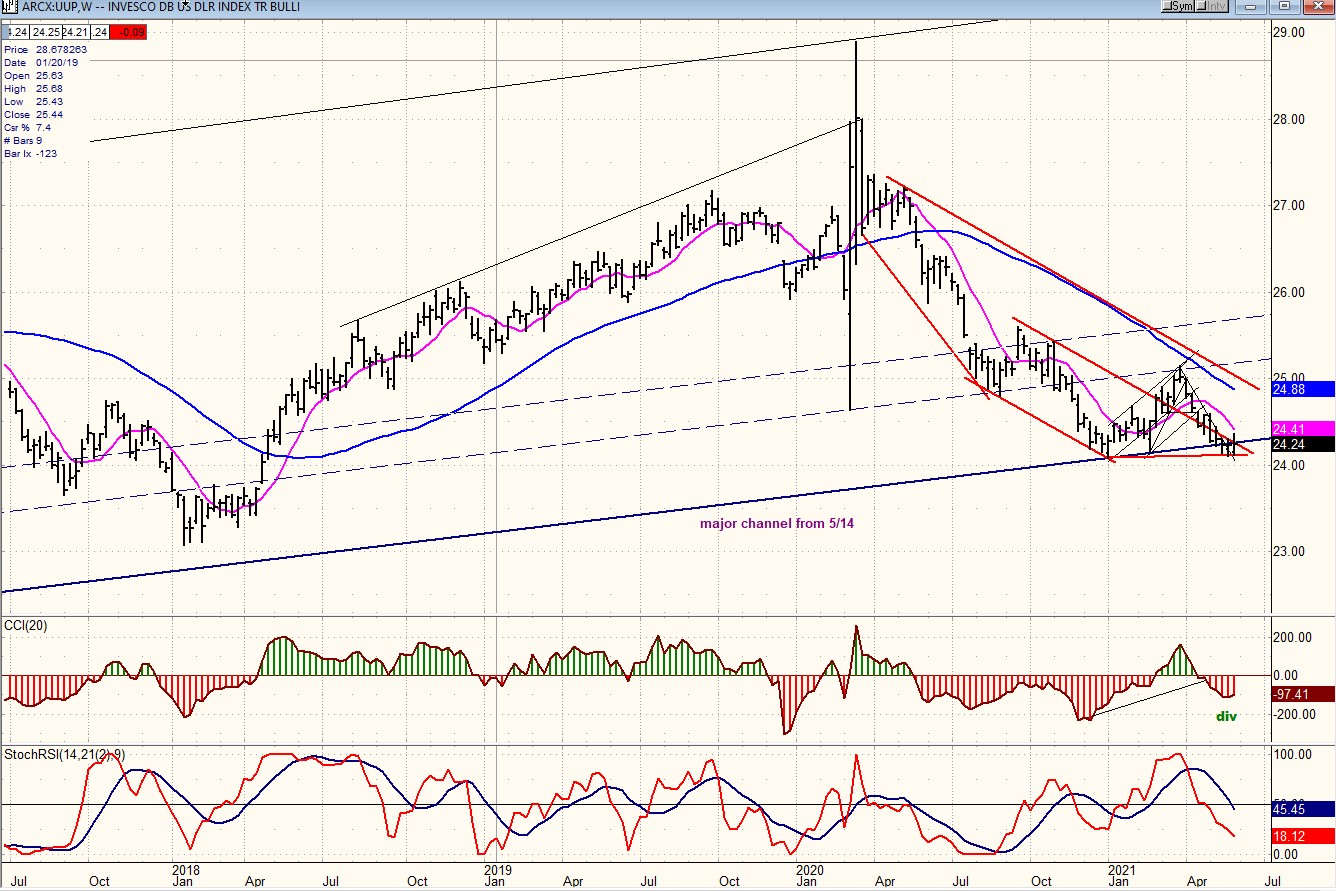
UUP (dollar ETF) (wkly) ($USD chart is not available from this data provider)
UUP has held its new correction for three consecutive weeks and may be trying to move higher. If this has been a retest of the former low, it could extend its move up to the 50-wk MA and perhaps beyond.
SUMMARY
SPX is on its way to an intermediate top which could arrive after a few short weeks. We should look for it after the short-term cycle has made its low and after the index has reached the vicinity of 4310.
Andre
NOTE: I have a new email: [email protected]
Free trial subscription
With a trial subscription, you will have access to the same information that is given to paid subscribers, but for a limited time-period. Over the years, I have developed an expertise in P&F charting (price projection), cycles (timing), EWT (structure), and general technical analysis which enables me to warn subscribers of pending reversals in market trends, and how far that trend can potentially carry. For a FREE 2-week trial, subscription options, and payment plans I encourage you to visit my website at www.marketurningpoints.com.
The above comments and those made in the daily updates and the Market Summary about the financial markets are based purely on what I consider to be sound technical analysis principles. They represent my own opinion and are not meant to be construed as trading or investment advice but are offered as an analytical point of view which might be of interest to those who follow stock market cycles and technical analysis.
********

When Andre Gratian was a stock broker years ago, a friend introduced him to technical analysis of the market. Consequently, it is not an exaggeration to say that Andre fell in love with this approach! Ever since then, it has become an increasingly important part of his professional life. Gratian has studied the works of Wyckoff, Edwards & Magee, Edward J. Dewey (cycles) and many others. However, one of my most profitable undertaking has probably been to study Point & Figure charting, which he finds invaluable in analyzing stocks and indices. If he were restricted to one methodology, this is the one that he would choose. This well-rounded background has given him what he feels to be a special insight into the stock market, facilitating the recognition of meaningful patterns and the ‘turning points’ in all trends, whether they be short or long term. Andre feels very comfortable discussing the stock market and passing on meaningful information to others. His subscribers include individuals and money managers throughout the world. Moreover, his Newsletters are currently published on several financial sites, here and abroad.


