Technical Analysis Of The Markets


Gold
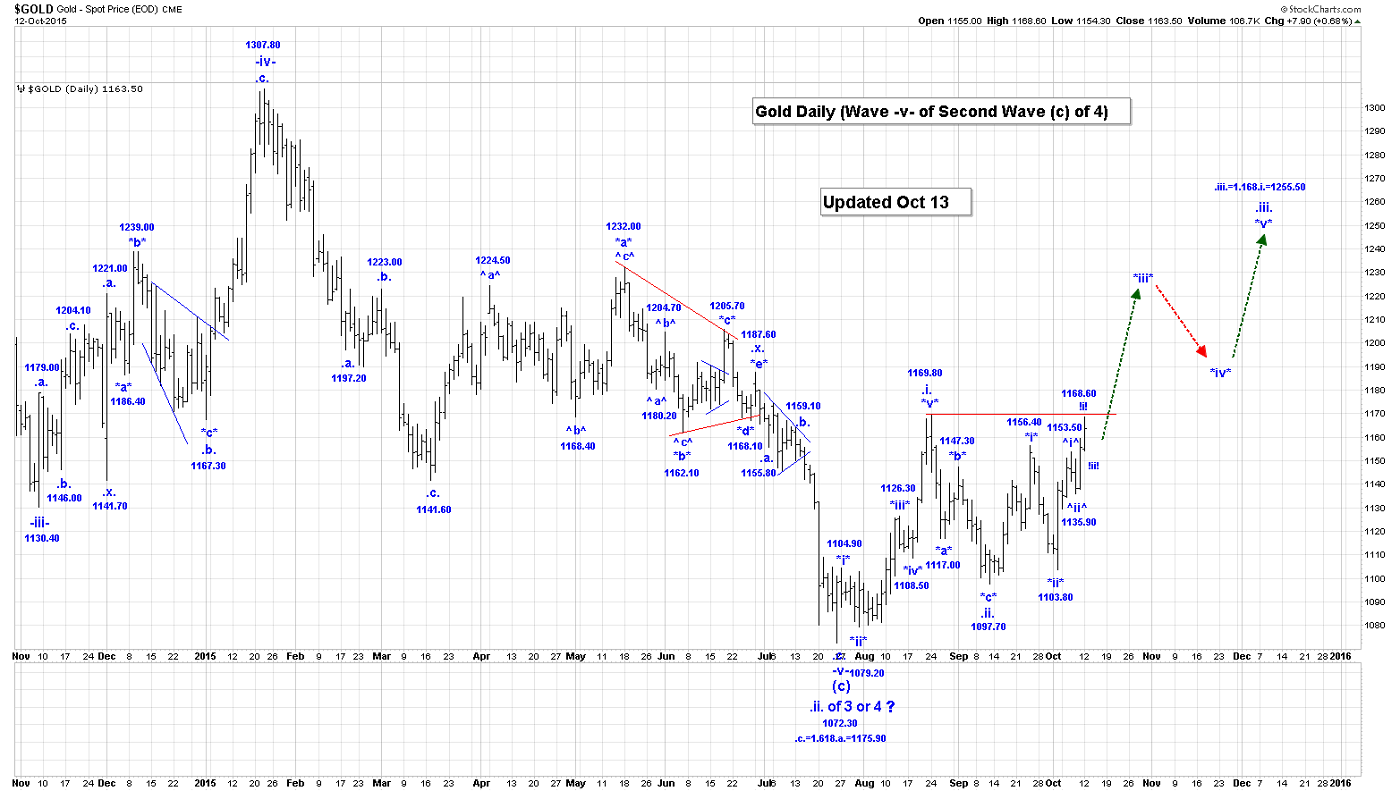
Gold was lower in the overnight session reaching 1151.30. On the Intraday Chart, it appears that the rallies are impulsive looking and the setbacks corrective looking, which is bullish.
Based on that observation, it is likely that wave ^iii^ is now subdividing also. We have shown this on the attached Daily Gold Chart, and updated our count below accordingly.
Our updated count for all of wave .iii. is:
*i* = 1156.40;
*ii* = 1103.80;
*iii*:
^i^ = 1141.50;
^ii^ = 1136.00;
^iii^:
!i! = 1168.60;
!ii! = 1151.30, if complete, with retracement levels as follows:
50% = 1152.30;
61.8% = 1148.50.
We are not sure whether all of wave !i! is complete at the current 1151.30 low, but when it ends we should expect a very powerful rally in wave !iii! of ^iii^ of *iii*
Some projections for the end of wave ^iii^ are:
^iii^ = 1.618^i^ = 1197.00;
^iii^ = 2.618^i^ = 1202.50.
Projections for the end of wave *iii* are:
*iii* = 1.618*i* = 1198.80;
*iii* = 2.618*i* = 1257.50.
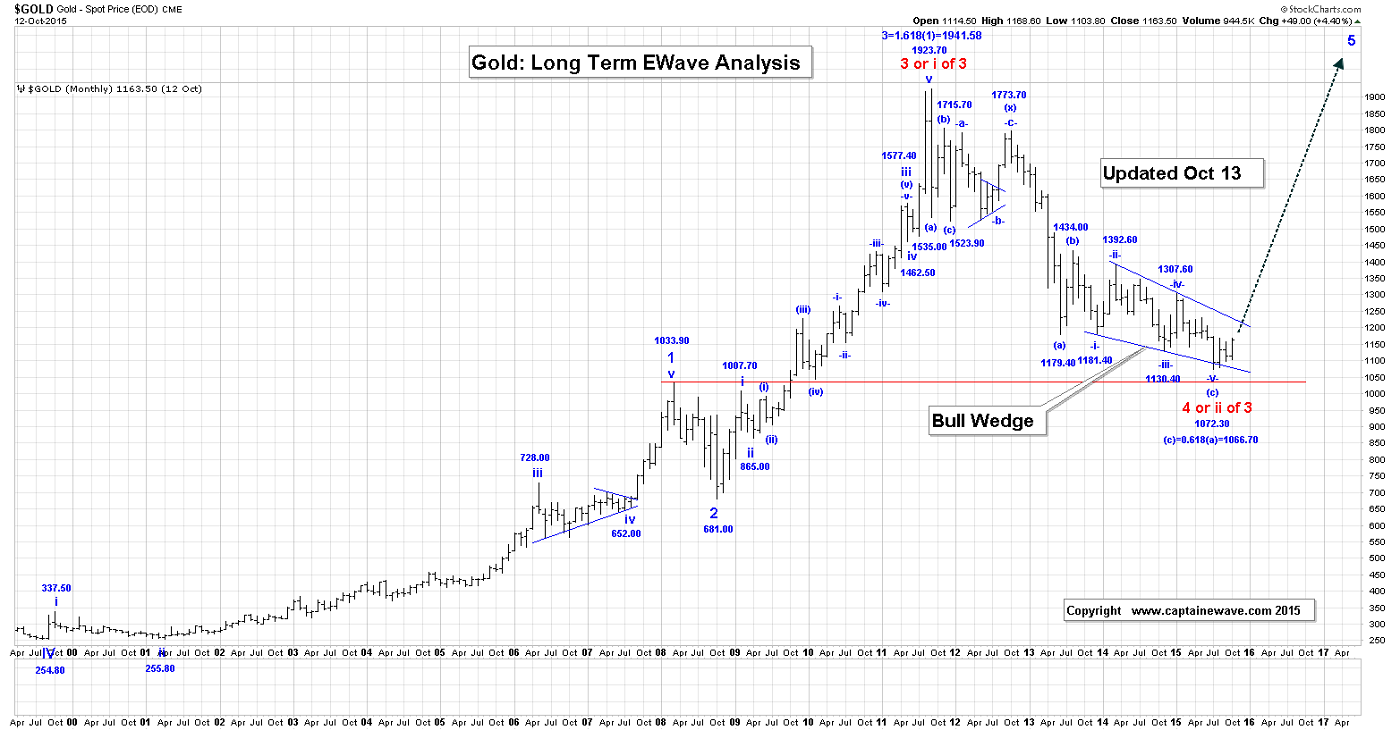
Here’s our big picture analysis of what lies ahead:
We are long 20 positions, risking to 1135.90!
Crude Oil
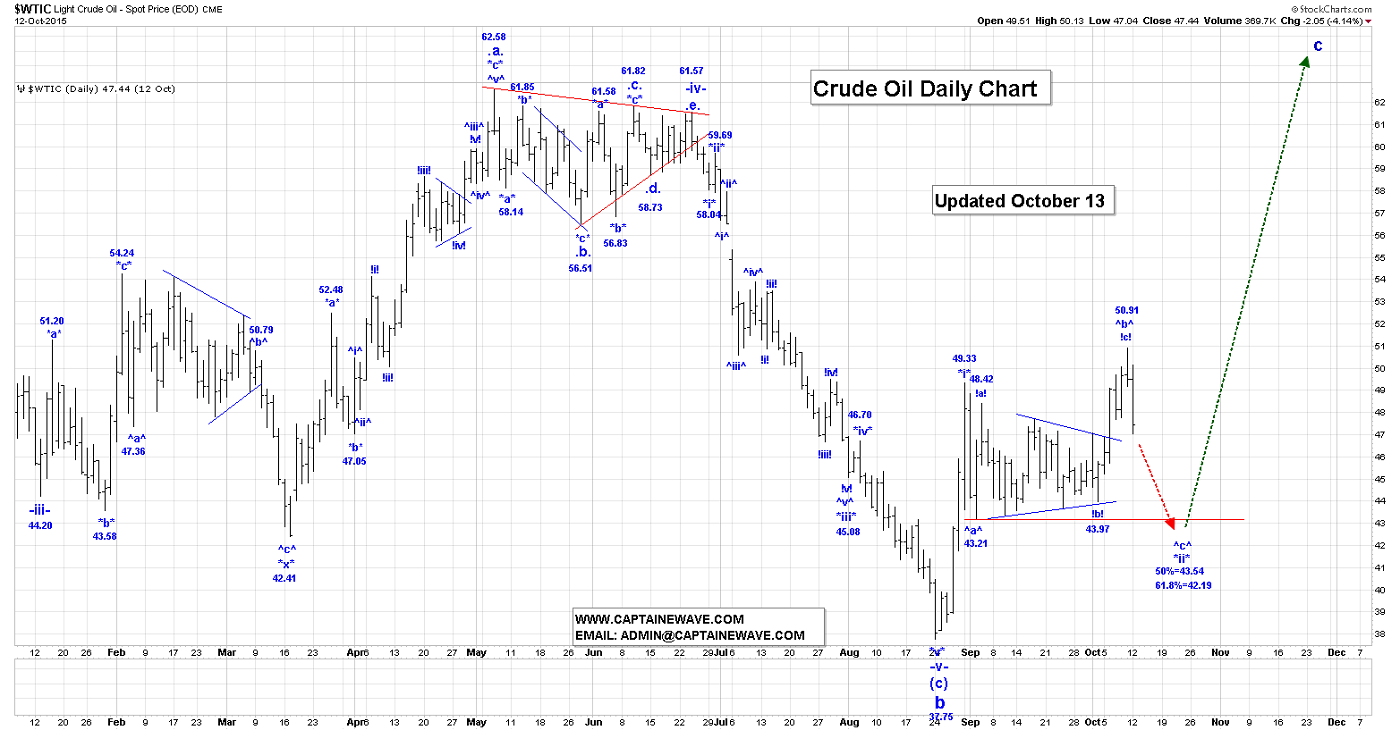
Crude fell further in the overnight session, reaching a low of 46.64, at the time that this Post was being written. On the Intraday Chart it now appears that we have an impulsive sequence from the 50.91 high to the 46.64 low.
This could be the first leg down in wave ^c^ of *iii*, and we have labeled our count below accordingly.
If that observation is correct, then we should be expecting a corrective rally that will retrace between 50 to 61.8% of the first impulsive sequence down, as the next big event.
We have projected those levels below. Our wave ^c^ drop has our minimum target of 43.21, to complete all of wave *ii*. We plan to buy aggressively at the end of wave *ii*.
Our current preferred count is:
*i* = 49.33;
*ii*;
^a^ = 43.21;
^b^:
!a! = 48.42
!b! triangle = 43.97;
!c! = 50.91, to complete all of wave ^b^;
^c^:
!i! = 46.64, if complete;
!ii! rally is next with the following retracement levels:
50% = 48.78;
61.8% = 49.28.
A projection for the end of wave ^c^ is: ^c^ = 1.618^a^ = 41.01.
We expect the end of wave ^c^ and all of wave *ii* to be within the following retracement levels:
50% = 43.54;
61.8% = 42.19.
We plan to go long 8 positions at 43.20, and buy 42.00 puts, as stops!
S&P500
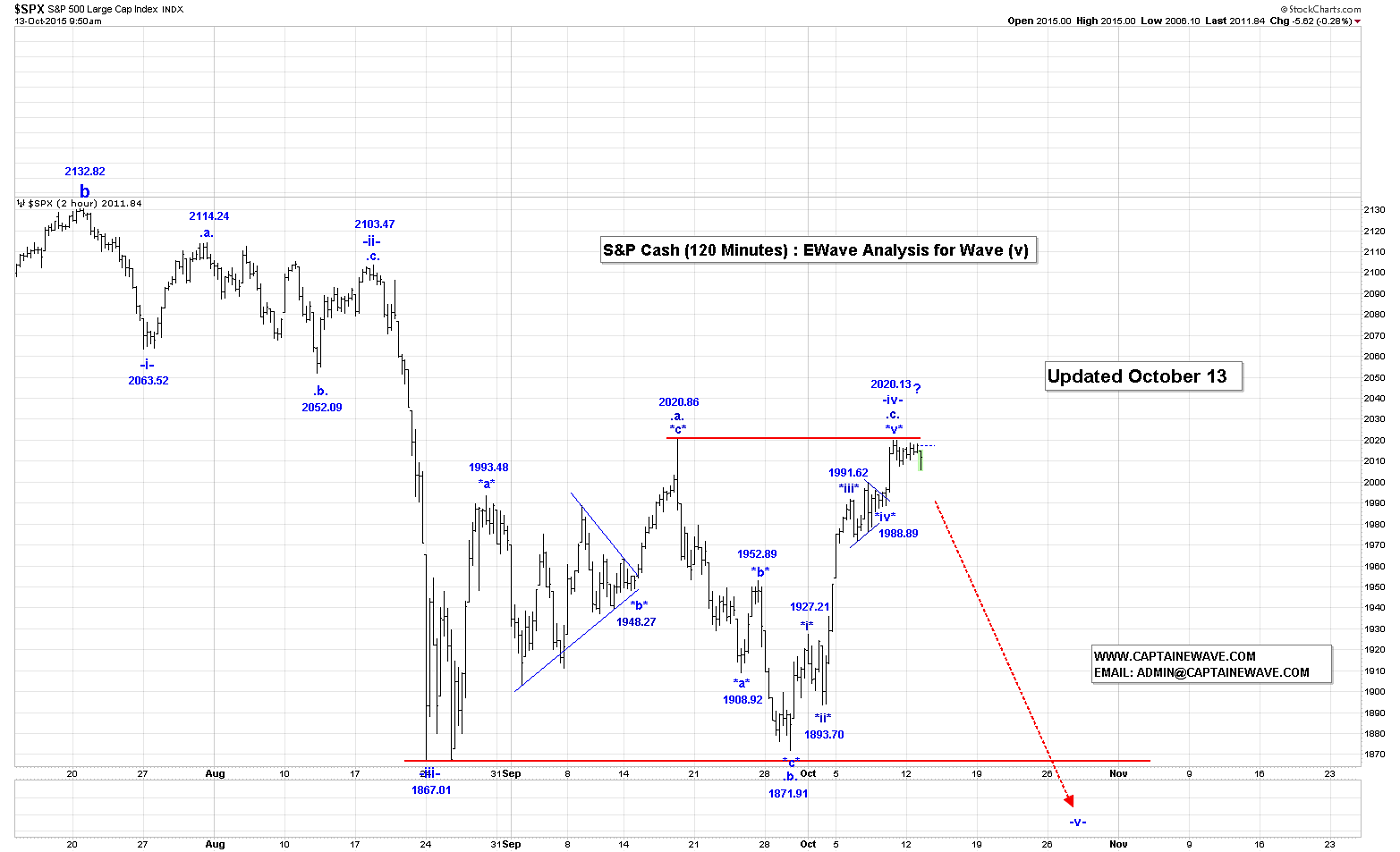
The S&P futures were lower in the overnight session, being down about 11 points, at the time that this Post was being written. Either we are going to see one more push higher to at least the 2020.86 high to complete all of wave -iv-, or the S&P is going to start heading sharply lower in wave -v-.
Our preferred and alternate counts remain unchanged:
Our wave -iv- flat correction looks like:
*a* = 2020.86
*b* = 1871.91
*c* = 2020.13, if complete, to complete all of wave -iv-.
Our minimum target for the end of wave -v- is the wave -iii- low of 1867.01.
Our very bearish count remains valid, and from the wave b high of 2132.82, would look like:
-i- = 2063.52;
-ii- = 2103.47;
-iii-:
.i. = 1867.01
.ii. = 2020.13, if complete, to complete all of wave .ii..
.iii. drop is now.
If this above count is correct, then when we complete wave .ii., the collapse in wave .iii. will be of biblical proportions.
For the time being we will assume that our wave -iv- analysis is the preferred count.
Here’s our big Ewave picture on what is coming:
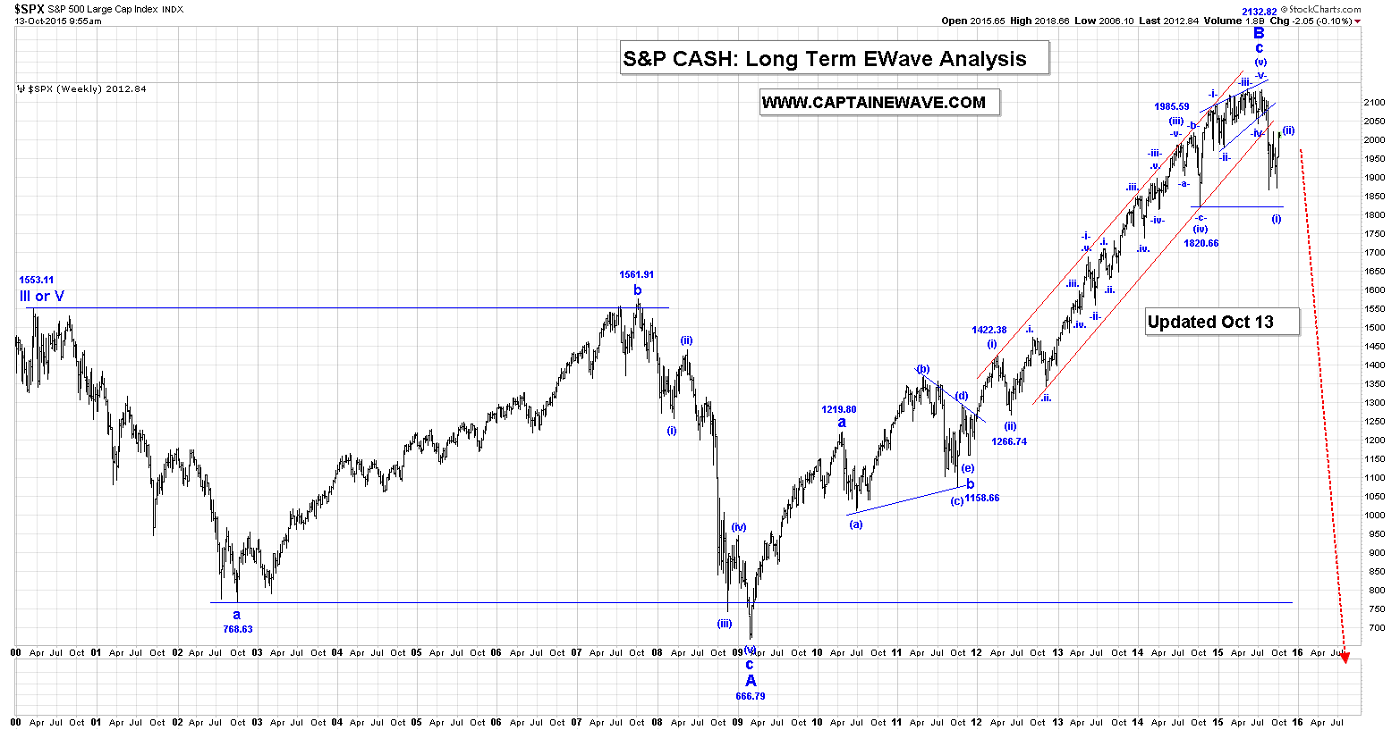
We are short 15 positions with 1975 calls!
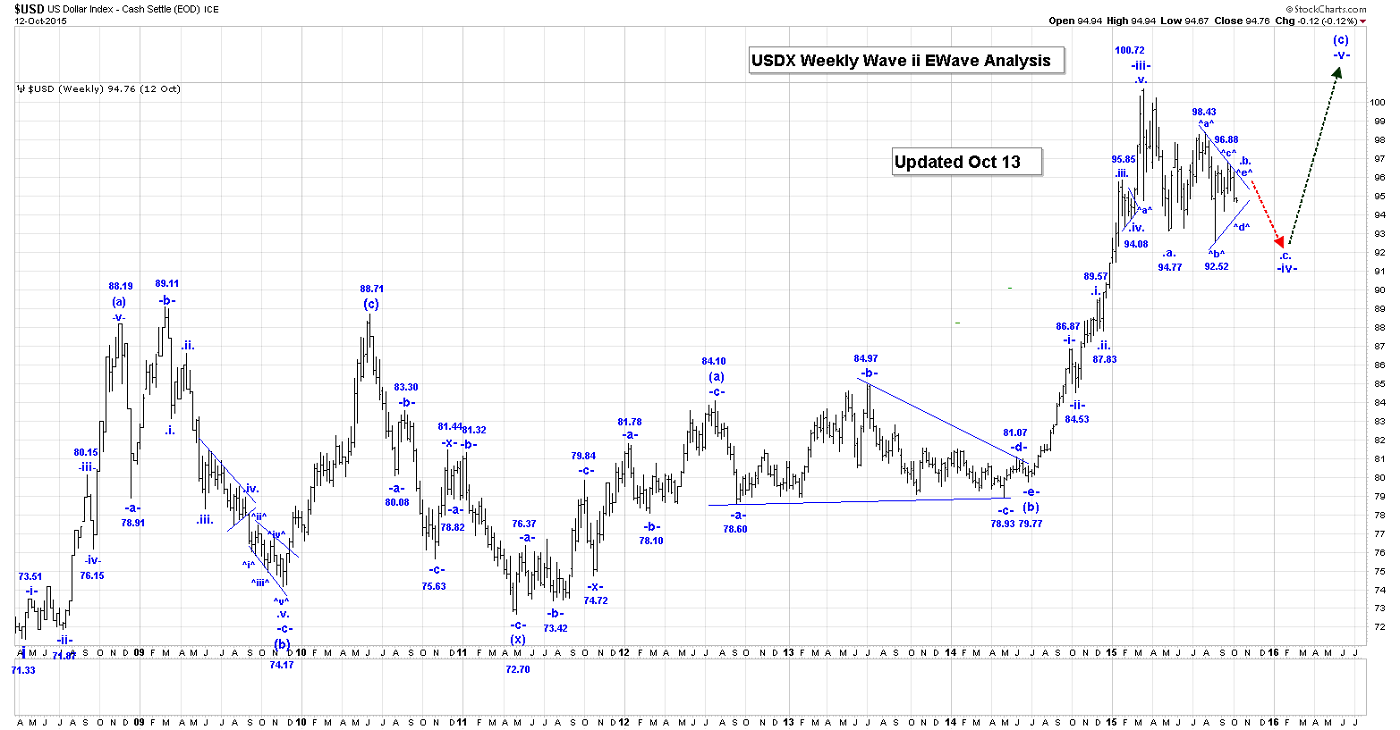
USDX
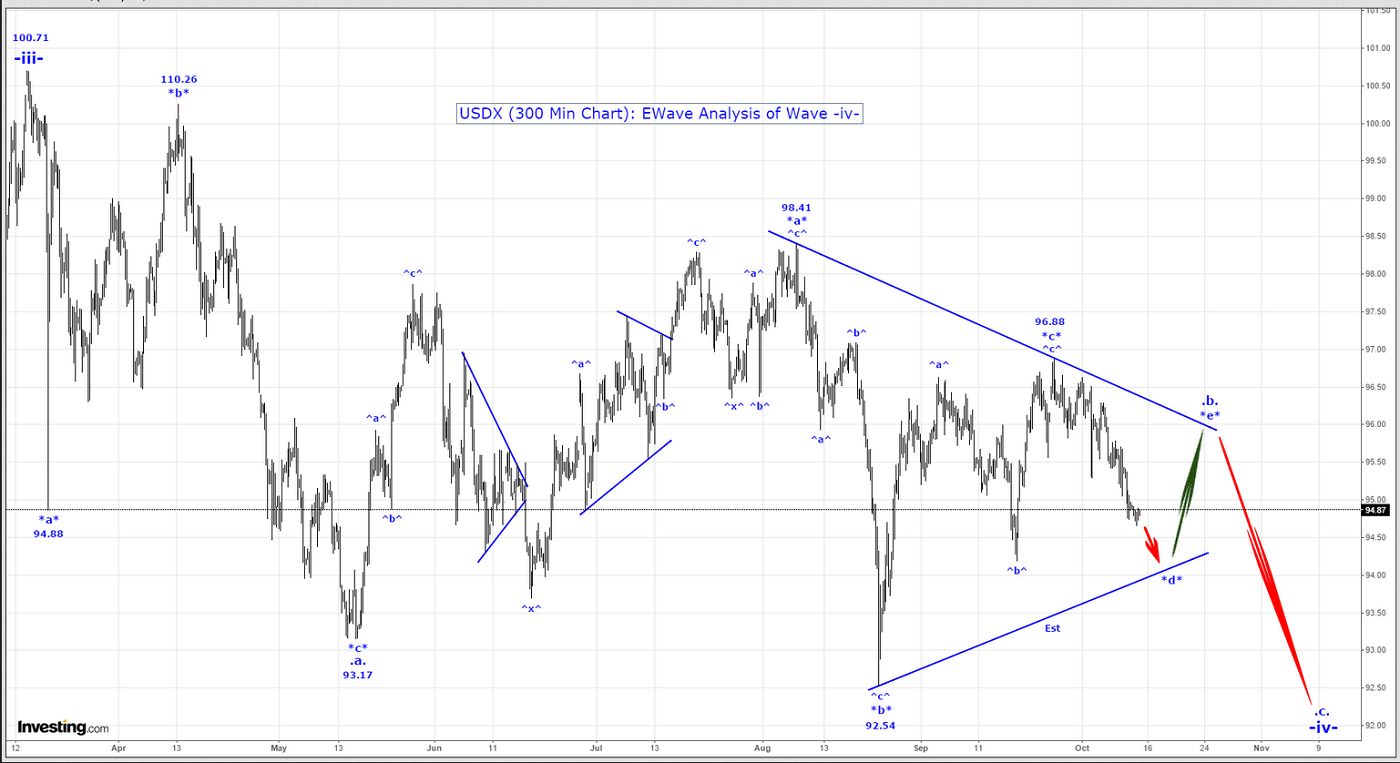
This Intraday Chart that shows all of our thinking relative to wave -iv-. We are now working on our wave .b. triangle, and within wave .b., wave *d*.
It could be possible that all of wave *d* is complete at the 94.67, but we doubt it and we expect some further downside in the days ahead.
In the overnight session the USDX reached 94.93, at the time that this Post was being written. Our wave .b. triangle will likely take a month or so more to unfold, after which we should expect a sharp thrust lower in wave .c. to complete all of wave -iv-.
Our wave -iv- counts is very complex and looks like:
.a.:
*a* = 94.88;
*b* = 100.26;
*c* = 93.17, to complete all of wave .a..
.b. triangle:
*a* = 98.41
*b* = 92.54;
*c* = 96.88
*d* = 94.67, if complete;
*e* rally to follow, to complete all of wave .b.
.c. drop to go, after the wave .b. triangle ends, and then this will complete all of wave -iv-.
Here’s our analysis of the longer term weekly chart:
NatGas
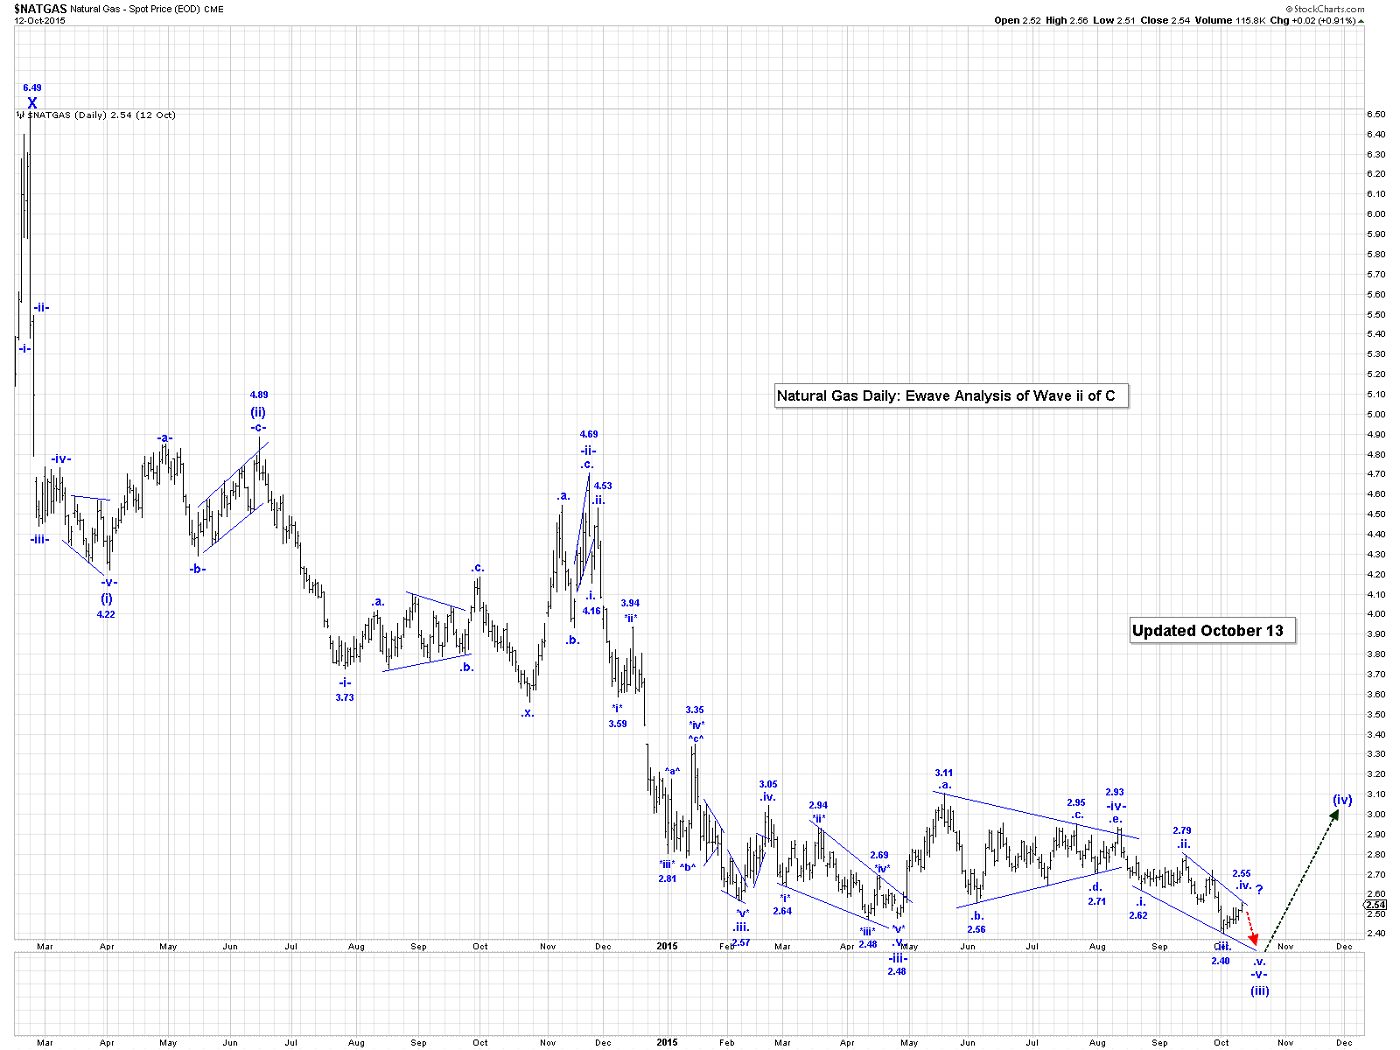
NG reached a high of 2.554 in the in the overnight session, and then fell off to reach a low of 2.503.
In yesterday’s End of Day Post we revised our current count slightly, and now looking for the end of wave .iv. of -v-. Wave -v- is an ending diagonal triangle. Upon completion of wave .iv., we expect one more drop to at least the 2.403 low to complete all of wave .v., -v- and (iii).
Upon completion of wave (iii), we should expect a multi-month rally in wave (iv), to be the next big event. By the way, NG sure likes triangles, as you can see by the number that are identified on the attached Daily NG Chart.
HUI/GDX
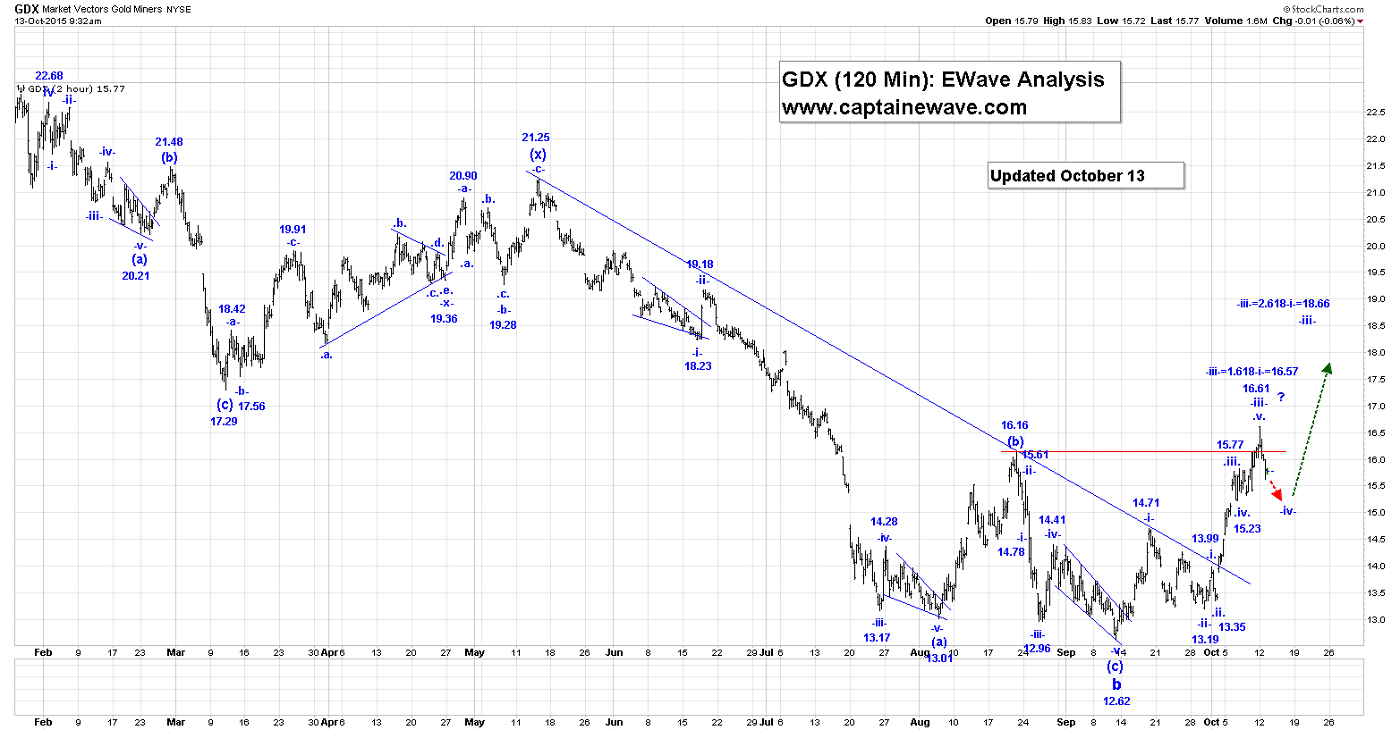
For the time being we will assume that we are still working on wave -iv, which has the following retracement levels for its completion:
23.6% = 15.80;
38.2% = 15.30.
Our alternate is that wave –iii- is not complete at 16.61 and will be heading to our next projection of 18.66.
Our wave -iii- complete impulsive sequence is:
.i. = 13.99;
.ii. = 13.35;
.iii. = 15.77;
.iv. = 15.23;
.v. = 16.61, to complete all of wave -iii-.
Our current count is :
-i- = 14.71;
-ii- = 13.19;
-iii- = 16.61, if complete;
-iv- drop is now underway,
If -iii- extends then our next projection is: -iii-=2.618-i- = 18.66
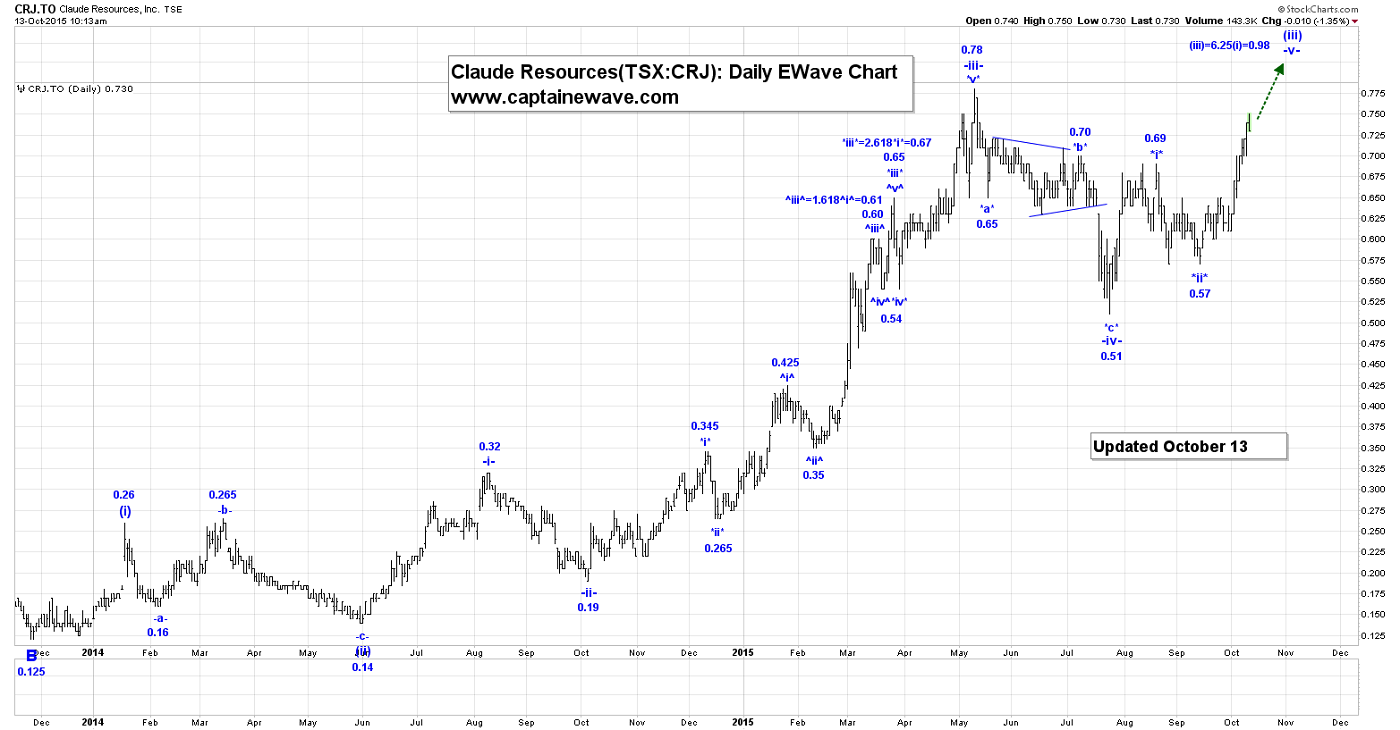
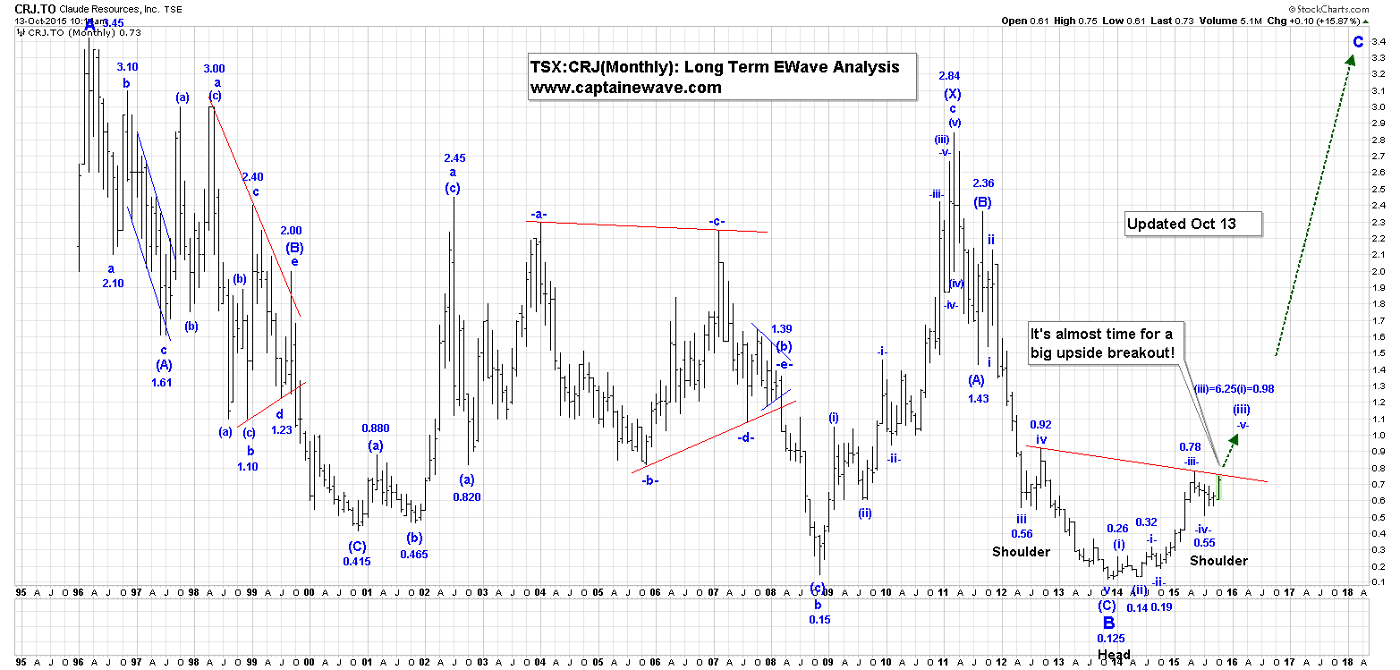
Our gold stock bell weather, Claude Resources, continues to move steadily to all our Ewave targets. Here’s a look at the big picture, with an upside breakout very close at hand:
We are long the GDX, ABX, KGC, NEM, CRJ, and TSX:XGD with no stops!
********
Email: [email protected]
Website: www.captainewave.com
Risk: CAPTAINEWAVE.COM IS AN IMPERSONAL ADVISORY SERVICE. AND THEREFORE, NO CONSIDERATION CAN OR IS MADE TOWARD YOUR FINANCIAL CIRCUMSTANCES. ALL MATERIAL PRESENTED WITHIN CAPTAINEWAVE.COM IS NOT TO BE REGARDED AS INVESTMENT ADVICE, BUT FOR GENERAL INFORMATIONAL PURPOSES ONLY. TRADING STOCKS DOES INVOLVE RISK, SO CAUTION MUST ALWAYS BE UTILIZED. WE CANNOT GUARANTEE PROFITS OR FREEDOM FROM LOSS. YOU ASSUME THE ENTIRE COST AND RISK OF ANY TRADING YOU CHOOSE TO UNDERTAKE. YOU ALSO AGREE TO BEAR COMPLETE RESPONSIBILITY FOR YOUR INVESTMENT RESEARCH AND DECISIONS AND ACKNOWLEDGE THAT CAPTAINEWAVE.COM HAS NOT AND WILL NOT MAKE ANY SPECIFIC RECOMMENDATIONS OR GIVE ADVICE TO YOU OR ANY OF ITS CLIENTS UPON WHICH THEY SHOULD RELY. CAPTAINEWAVE.COM SUGGESTS THAT THE CLIENT/MEMBER TEST ALL INFORMATION AND TRADING METHODOLOGIES PROVIDED AT OUR SITE THROUGH PAPER TRADING OR SOME OTHER FORM OF TESTING. CAPTAINEWAVE.COM, ITS OWNERS, OR ITS REPRESENTATIVES ARE NOT REGISTERED AS SECURITIES BROKER-DEALERS OR INVESTMENT ADVISORS EITHER WITH THE U.S. SECURITIES AND EXCHANGE COMMISSION OR WITH ANY STATE SECURITIES REGULATORY AUTHORITY. WE RECOMMEND CONSULTING WITH A REGISTERED INVESTMENT ADVISOR, BROKER-DEALER, AND/OR FINANCIAL ADVISOR. IF YOU CHOOSE TO INVEST WITH OR WITHOUT SEEKING ADVICE FROM SUCH AN ADVISOR OR ENTITY, THEN ANY CONSEQUENCES RESULTING FROM YOUR INVESTMENTS ARE YOUR SOLE RESPONSIBILITY.
ALL INFORMATION POSTED IS BELIEVED TO COME FROM RELIABLE SOURCES. CAPTAINEWAVE.COM DOES NOT WARRANT THE ACCURACY, CORRECTNESS, OR COMPLETENESS OF INFORMATION AVAILABLE FROM ITS SERVICE AND THEREFORE WILL NOT BE LIABLE FOR ANY LOSS INCURRED. DUE TO THE ELECTRONIC NATURE OF THE INTERNET, THE CAPTAINEWAVE.COM WEBSITE, ITS E-MAIL & DISTRIBUTION SERVICES AND ANY OTHER SUCH "ALERTS" COULD FAIL AT ANY GIVEN TIME. CAPTAINEWAVE.COM WILL NOT BE RESPONSIBLE FOR UNAVAILABILITY OF USE OF ITS WEBSITE, NOR UNDELIVERED E-MAILS, OR "ALERTS" DUE TO INTERNET BANDWIDTH PROBLEMS, EQUIPMENT FAILURE, OR ACTS OF GOD. CAPTAINEWAVE.COM DOES NOT WARRANT THAT THE TRANSMISSION OF E-MAILS, OR ANY "ALERT" WILL BE UNINTERRUPTED OR ERROR-FREE. CAPTAINEWAVE.COM WILL NOT BE LIABLE FOR THE ACTS OR OMISSIONS OF ANY THIRD PARTY WITH REGARDS TO CAPTAINEWAVE.COM DELAY OR NON-DELIVERY OF THE CAPTAINEWAVE.COM NIGHTLY EMAILS OR "ALERTS". FURTHER, WE DO NOT RECEIVE ANY FORM OF PAYMENT OR OTHER COMPENSATION FOR PUBLISHING INFORMATION, NEWS, RESEARCH OR ANY OTHER MATERIAL CONCERNING ANY SECURITIES ON OUR SITE OR PUBLISH ANY INFORMATION ON OUR SITE THAT IS INTENDED TO AFFECT OR INFLUENCE THE VALUE OF SECURITIES.
THERE IS NO GUARANTEE PAST PERFORMANCE WILL BE INDICATIVE OF FUTURE RESULTS. NO ASSURANCE CAN BE GIVEN THAT THE RECOMMENDATIONS OF CAPTAINEWAVE.COM WILL BE PROFITABLE OR WILL NOT BE SUBJECT TO LOSSES. ALL CLIENTS SHOULD UNDERSTAND THAT THE RESULTS OF A PARTICULAR PERIOD WILL NOT NECESSARILY BE INDICATIVE OF RESULTS IN FUTURE PERIODS. THE RESULTS LISTED AT THIS WEBSITE ARE BASED ON HYPOTHETICAL TRADES. PLAINLY SPEAKING, THESE TRADES WERE NOT ACTUALLY EXECUTED. HYPOTHETICAL OR SIMULATED PERFORMANCE RESULTS HAVE CERTAIN INHERENT LIMITATIONS. UNLIKE AN ACTUAL PERFORMANCE RECORD, SIMULATED TRADES DO NOT REPRESENT ACTUAL TRADING. ALSO, SINCE THE TRADES HAVE NOT ACTUALLY BEEN EXECUTED, THE RESULTS MAY HAVE OVER OR UNDER COMPENSATED FOR THE IMPACT, IF ANY, OF CERTAIN MARKET FACTORS SUCH AS LACK OF LIQUIDITY. YOU MAY HAVE DONE BETTER OR WORSE THAN THE RESULTS PORTRAYED. NO REPRESENTATION IS BEING MADE THAT ANY ACCOUNT WILL OR IS LIKELY TO ACHIEVE PROFITS OR LOSSES SIMILAR TO THOSE SHOWN. NO INDEPENDENT PARTY HAS AUDITED THE HYPOTHETICAL PERFORMANCE CONTAINED AT THIS WEBSITE, NOR HAS ANY INDEPENDENT PARTY UNDERTAKEN TO CONFIRM THAT THEY REFLECT THE TRADING METHOD UNDER THE ASSUMPTIONS OR CONDITIONS SPECIFIED HEREAFTER. WHILE THE RESULTS PRESENTED AT THIS WEBSITE ARE BASED UPON CERTAIN ASSUMPTIONS BELIEVED TO REFLECT ACTUAL TRADING CONDITIONS, THESE ASSUMPTIONS MAY NOT INCLUDE ALL VARIABLES THAT WILL AFFECT, OR HAVE IN THE PAST AFFECTED, THE EXECUTION OF TRADES INDICATED BY CAPTAINEWAVE.COM. THE HYPOTHETICAL RESULTS ON THIS WEBSITE ARE BASED ON THE ASSUMPTION THAT THE CLIENT BUY AND SELLS THE POSITIONS AT THE OPEN PRICE OF THE STOCK. THE SIMULATION ASSUMES PURCHASE AND SALE PRICES BELIEVED TO BE ATTAINABLE. IN ACTUAL TRADING, PRICES RECEIVED MAY OR MAY NOT BE THE SAME AS THE ASSUMED ORDER PRICES.


