Technical Analysis Of The Markets
 share
share
 share
share
 share
share
 share
share
 share
share
Current Position of the Market
SPX Long-Term Trend: A lengthy correction is most likely underway!
SPX Intermediate-Trend: The British referendum could have a significant impact on the intermediate trend.
Analysis of the short-term trend is done on a daily basis with the help of hourly charts. It is an important adjunct to the analysis of daily and weekly charts which discuss longer market trends.
A WEEK OF UNCERTAINTY
Market Overview
On June 23rd the British people will vote whether or not to stay in the European Union. The result of this vote could have a serious short-term -- and perhaps intermediate -- impact on the market, especially if it is for Brexit! At the recent FOMC meeting, in the Q&A session Janet Yellen cited it as one of the reasons to hold off on raising interest rates as Brexit could have an impact on the US economy. The recent decline from 2120 may have been motivated primarily by cautious selling ahead of the vote and there could be more of the same over the next three days, especially if the re-bound from 2050 was primarily the function of options expiration.
With the latest polls showing a virtual tie, serious analytic forecasting will be of little use. The next three trading days could be volatile, and it is not clear that the market will be able to predict the outcome by its behavior. The only certainty about the result of the referendum will come when it is announced on Friday morning.
SPX Chart Analysis (This chart and others below, are courtesy of QCharts.com.)
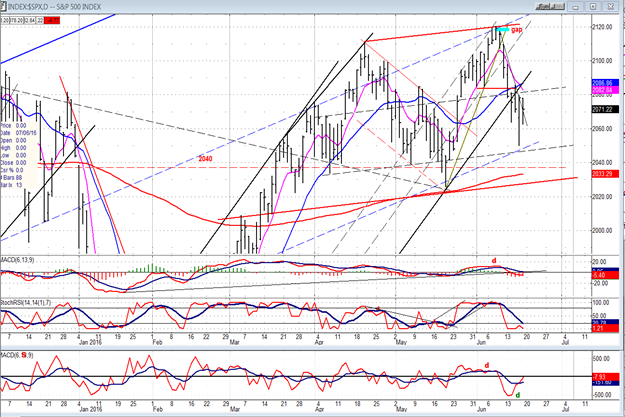
Daily chart
Last week, SPX continued the decline which it started from 2120 the week before. It finally found support at 2050, a few points short of its initial projection of 2046. There is another projection from the top which could extend the downtrend to the former low of 2025. Whether or not this can be achieved before Thursday remains to be seen. Good support starts at 2060, but the drop to 2050 may have weakened it and the next challenge to that level may have clear sailing all the way to the next projection target.
Continuing the decline to that level is certainly a possibility if the media continues to stress the potential consequences of Brexit. It looked as if options expiration had a positive effect on the index on Thursday and Friday. This is now behind us and by Friday’s close, the bounce from 2050 looked ready to resume the decline. Although the hourly indicators stopped just short of giving a sell signal, the daily indicators remained in a declining mode, and one could even make the case that the weekly SRSI gave a definite sell signal and that the weekly MACD made a bearish cross after showing unmistakable negative divergence. Is this enough to conclude that the intermediate trend has turned down, meaning that Brexit will win out? Probably not, but taken at face value, technically, it’s not a positive development for the market.
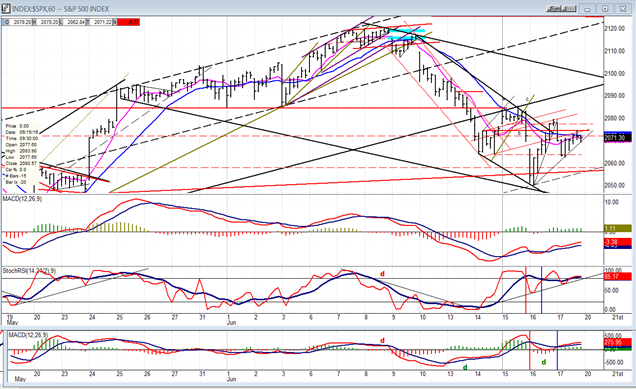
Hourly Chart
Thursday’s bounce from 2050 was a quick 30-point retracement, but it fell short of the previous near-term high. There was a strong band of support at the 2085 level which held prices above it for nearly three weeks. It was penetrated to the downside during the 70-point decline from 2120, thus becoming an important resistance level which has already stopped prices on two different occasions. If SPX is to get back into an uptrend, it will have to rise above it.
For the moment at least, the index looks more inclined to go the other way. The bounce from 2050 stopped at 2080, then gave up half of its gain at Friday’s opening; although the market crawled back part of the way during the rest of the day. It’s likely that the move from 2050 was an oversold rally which was assisted by options expiration, but by Friday’s close, all the steam seemed to have gone out of the rally and the three oscillators looked ready to roll over with the MACD still negative.
Over the near-term, the path of least resistance still appears to be on the downside. There was some selling after Friday’s close, but it could have been options-expiration related.
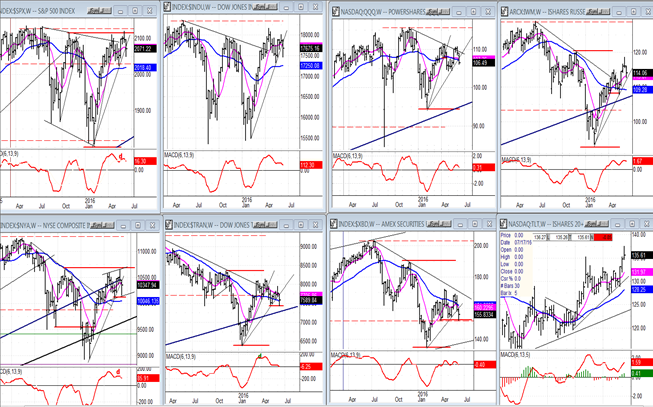
SPX et al… (Weekly)
Last week, the worst performers of this group continued to be the same ones as before: TRAN and XBD, which gave up all of their previous rallies. The NYA also had a sharp retracement, but it participated in the options expiration rally. QQQ was influenced by the weakness in AAPL, and IWM had a good retracement but remained the strongest near-term member of this group… except for TLT, of course, which came close to its all-time high of 1/15 before pulling back a little.
Note that with the exception of TLT, all the indicators are rolling over again from a lower high with TRAN and XBD about to go negative.
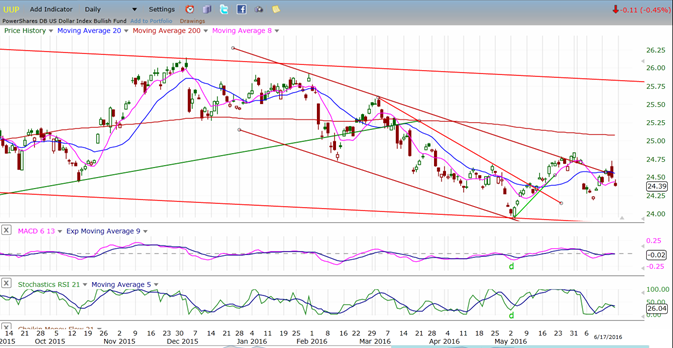
UUP (Dollar ETF)
UUP has tried twice to move through its corrective channel and was stopped both times. If it tries again, it will have to surpass the high of the first attempt, but then will face more resistance from the 200-DMA. We need more clarity about UUP’s short-term intentions.
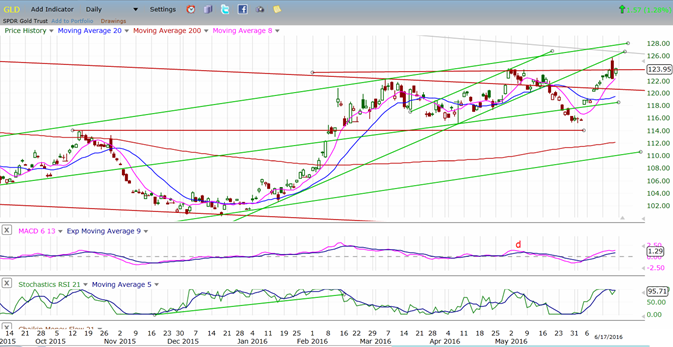
GLD (Gold ETF)
GLD had a strong rally which carried it to a slight new high, but it pulled back immediately after meeting trend line resistance. Whether or not it can push higher may depend on the result of Thursday’s referendum.
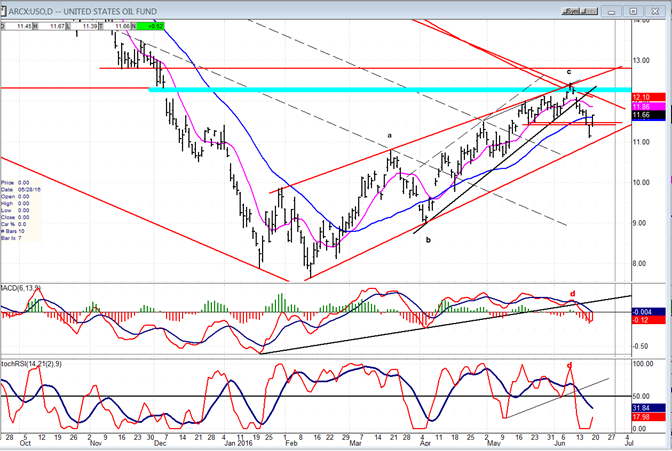
USO (US Oil Trust)
USO met with resistance where it should have, and pulled back. It broke a steep trend line, but found support just above its main trend line. In spite of the sharp re-bound, it may not be ready to challenge overhead resistance without further consolidation.
Summary
The British referendum should have a significant influence on the markets this coming week. It is best to keep from making specific predictions, especially about the intermediate trend, until after the results have been announced.
********
FREE TRIAL SUBSCRIPTON
Market Turning Points is an uncommonly dependable, reasonably priced service providing intra-day market updates, a daily Market Summary, and detailed weekend reports. It is ideally suited to traders, but it can also be valuable to investors since highly accurate longer-term price projections are provided using Point & Figure analysis and Fibonacci projections. Best-time reversal estimates are obtained from cycle analysis.
For a FREE 4-week trial, send an email toFor further subscription options, payment plans, weekly newsletters, and for general information, I encourage you to visit my website at www.marketurningpoints.com. By clicking on "Free Newsletter" you can get a preview of the latest newsletter which is normally posted on Sunday afternoon (unless it happens to be a 3-day weekend in which case it could be posted on Monday).
The above comments and those made in the daily updates and the Market Summary about the financial markets are based purely on what I consider to be sound technical analysis principles. They represent my own opinion and are not meant to be construed as trading or investment advice, but are offered as an analytical point f view which might be of interest to those who follow stock market cycles and technical analysis.
share
share
share
share
share

When Andre Gratian was a stock broker years ago, a friend introduced him to technical analysis of the market. Consequently, it is not an exaggeration to say that Andre fell in love with this approach! Ever since then, it has become an increasingly important part of his professional life. Gratian has studied the works of Wyckoff, Edwards & Magee, Edward J. Dewey (cycles) and many others. However, one of my most profitable undertaking has probably been to study Point & Figure charting, which he finds invaluable in analyzing stocks and indices. If he were restricted to one methodology, this is the one that he would choose. This well-rounded background has given him what he feels to be a special insight into the stock market, facilitating the recognition of meaningful patterns and the ‘turning points’ in all trends, whether they be short or long term. Andre feels very comfortable discussing the stock market and passing on meaningful information to others. His subscribers include individuals and money managers throughout the world. Moreover, his Newsletters are currently published on several financial sites, here and abroad.


