There’s More Than Silver, People!


Silver, silver, and silver – that’s all there seems to matter to the more short-term oriented investors. But, there’s so much more that’s going on than just the rally in the white metal! The dynamics in the precious metals market extend well beyond the above and the signal that’s coming from silver – as important as it is for the short-run – is just one of many puzzles that create the entire precious metals picture. In today’s analysis, we’ll discuss the less popular, but still important factors that are worth considering whether one is investing in gold, silver or mining stocks, or just considering it.
This article is based on numerous questions that we received in the past several days from our subscribers. It’s quite likely that they represent the questions and doubts of many other gold and silver investors, so we thought that you’d appreciate getting to know replies and insights from those, who’ve been investigating this exciting and promising market for more than a decade. Let’s move right to them.
Q: Does your analysis take into account global gold and silver ETF holdings and additions?
A: Yes, we analyzed this issue and we found that the moves in the ETF holdings are the result – not the cause of moves in the price of gold. For instance, just because the GLD ETF added a billion dollars in new money doesn’t make the outlook any more bullish than knowing that the price of gold increased.
Is an increase in price always bullish? No. For instance, a rally on very low volume is bearish and the same goes for silver’s quick outperformance. Also, please note that one wants to sell close to the tops, not bottoms and tops are formed after the price increases. Were the GLD ETF flows tiny before the 2011 top? Of course not.
Either way, that’s why we don’t cover the ETF inflows and outflows on a regular basis. You can read a detailed analysis along with a very informative chart in our April 15, 2016 article.
Q: Does your analysis take into account silver / gold backwardation in the futures market?
A: As it is the case with ETF holdings, we investigated this issue and – again – we found nothing extraordinary. As serious as this issue may appear at first sight, it seems that “backwardation” and “contango” are words that gold promoters use to scare people and make it appear that the precious metals market is going to explode immediately, and thus either sell more bullion inventory or make people sign up for services that are perma-bullish toward gold. Before you ask, we are not perma-gold-bears as we expect gold and silver to soar in the coming years and to move above their 2011 highs and we had been bullish on gold for the long term until April of 2013 – you will find details on this chart.
Q: In your analysis, do you consider option expirations dates, close to delivery months?
A: Yes, that’s what we included in one of our investment tools – True Seasonals. That’s seasonality that’s enriched with the effect of the expiration dates of futures, options, and stock options. You will find the True Seasonal patterns for this quarter on the following chart.
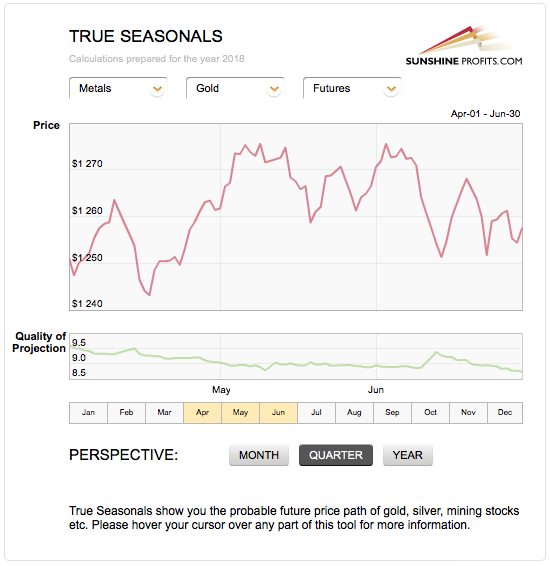
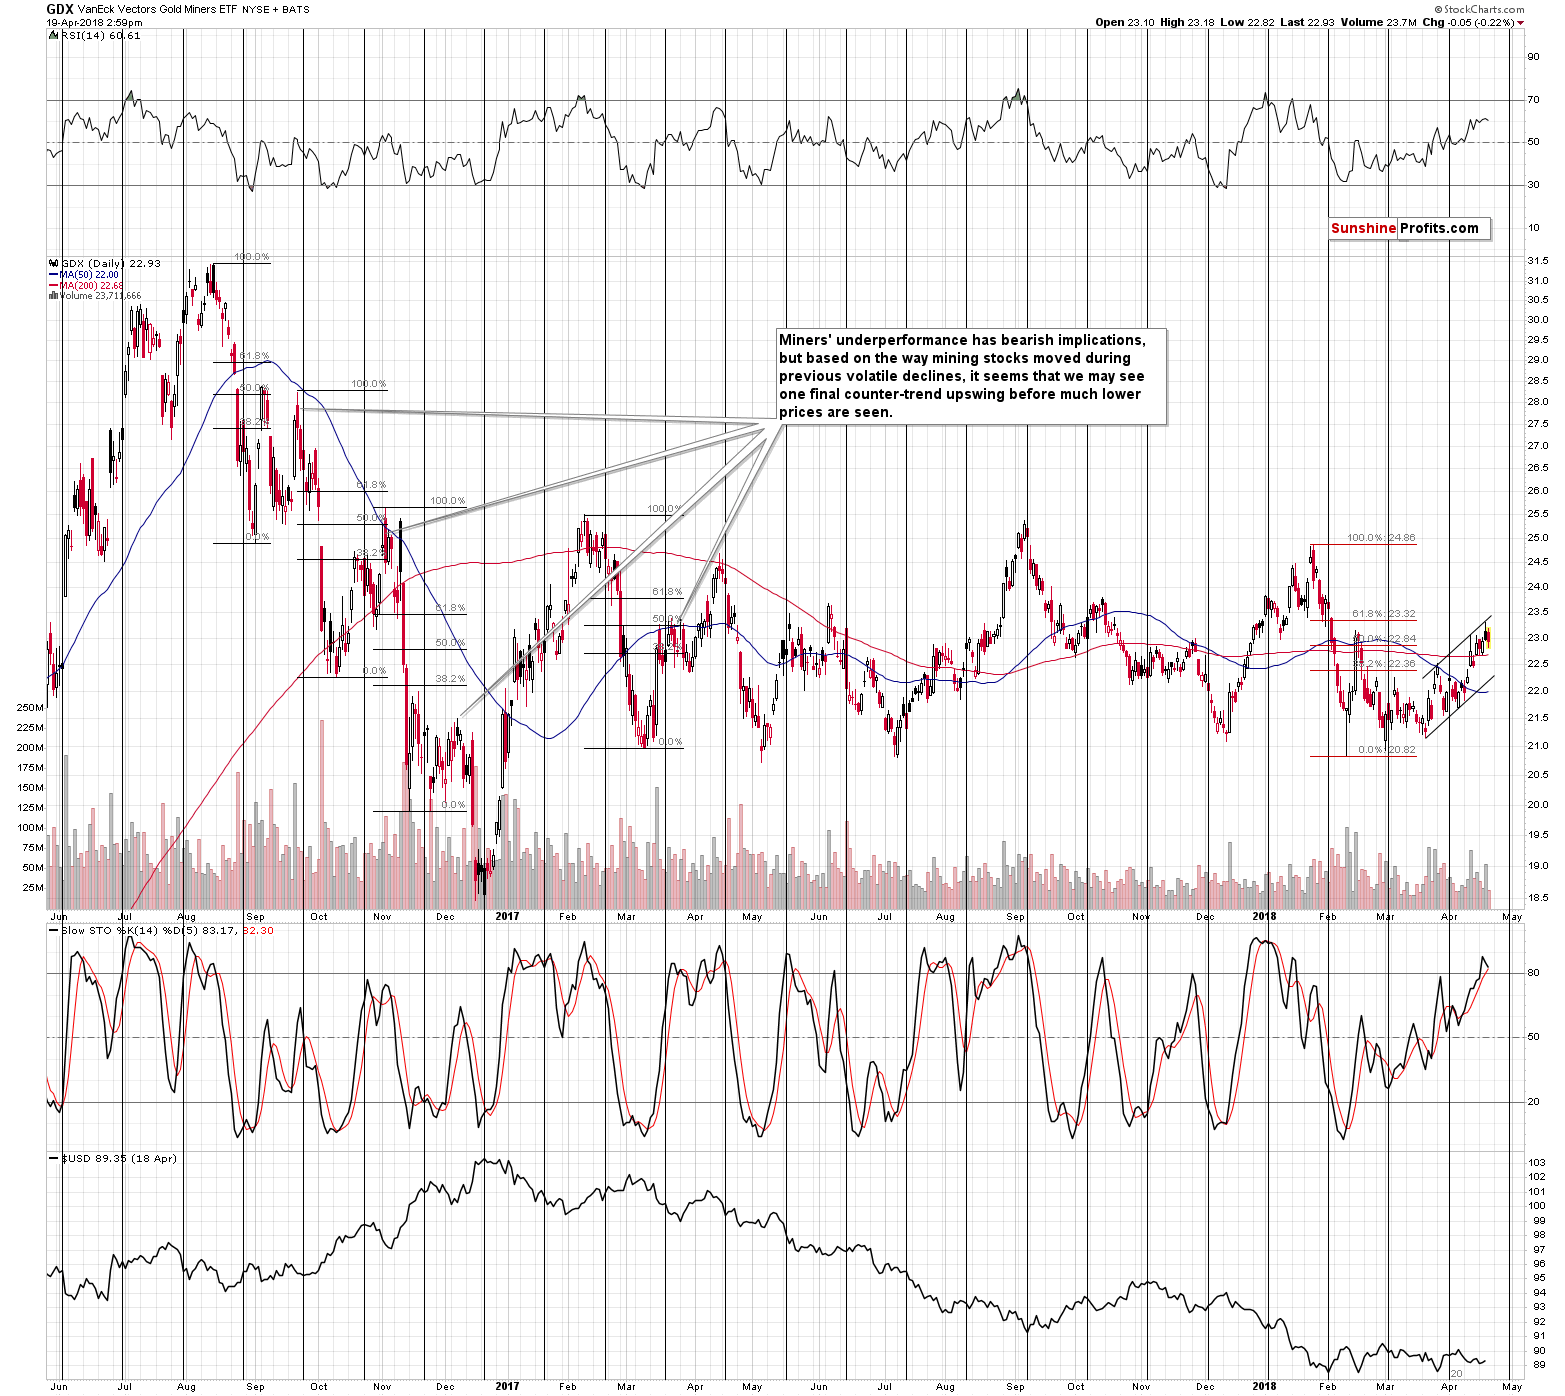
So far, the current quarter’s performance is in tune with the True Seasonal pattern. Please note that these patterns work best when there are no strong tendencies in the market and the long-term underperformance of mining stocks and the situation in the currency market suggests that there is a very big chance for the PM sector to move lower – that’s not something that even enriched seasonality should be able to change.
Q: While miners have underperformed for some time, can it be that miners are starting to play catch up, particularly since gold and silver prices have been fairly stable for the past month while the USD has also remained fairly stable?
A: It could be the case, but it’s not likely the case.
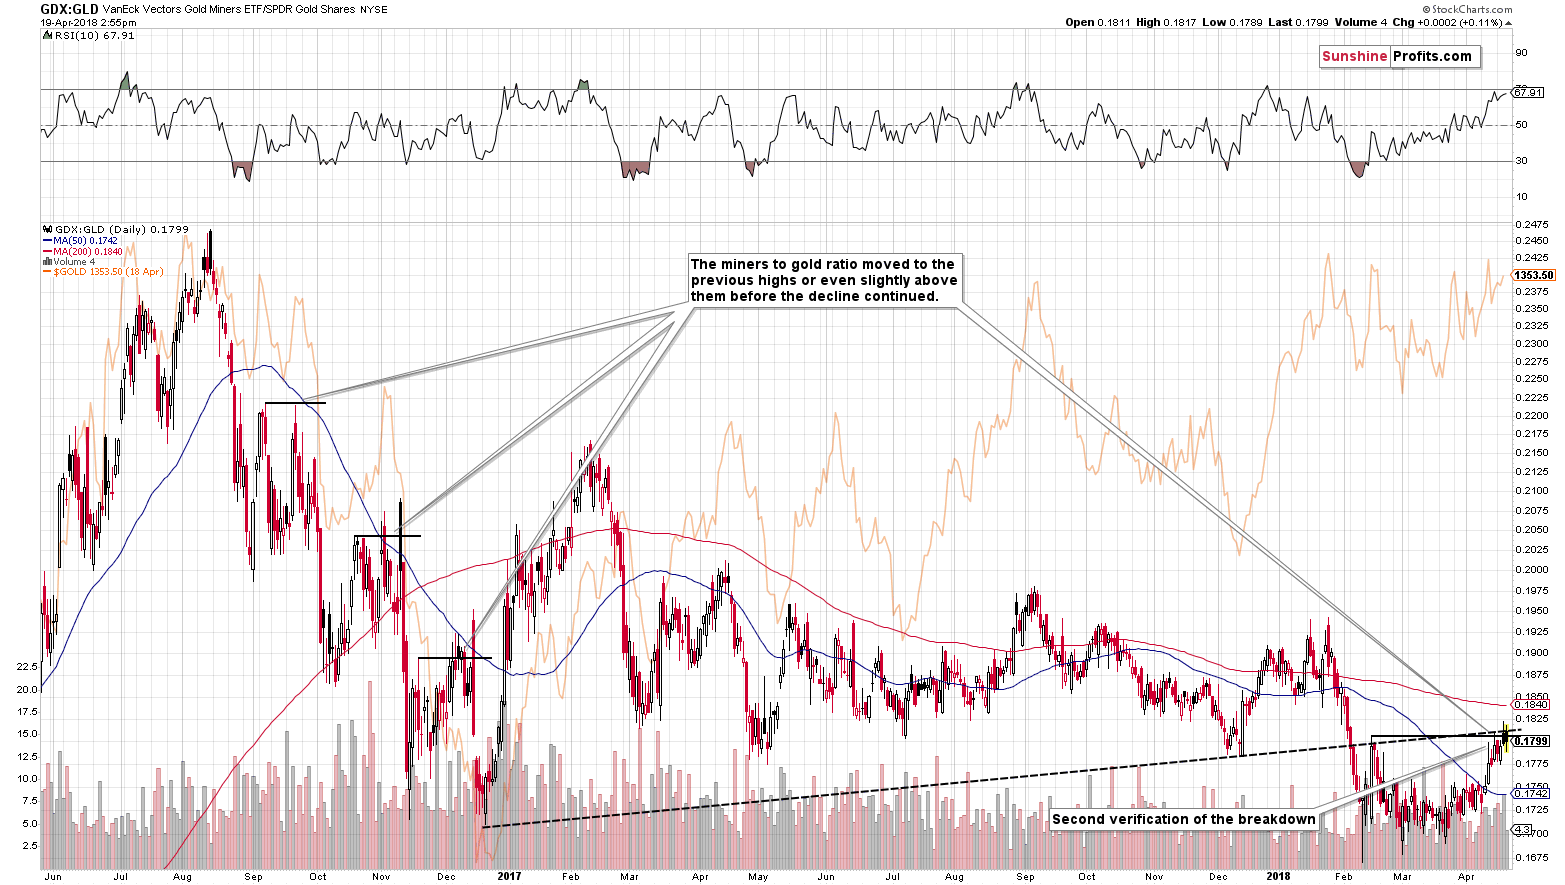
There’s nothing special about the recent upswing in the ratio between mining stocks and gold. The ratio did move to the mid-February high, which does indeed appear to be a sign of strength. But is this really a bullish development? As is usually the case, the context provides the key details.
We already wrote multiple times that during the previous big decline, the GDX moved to its previous local high before continuing to move lower.
This comment is still visible on the above GDX ETF chart. The point is that this kind of performance was not only seen in the GDX – it was also seen in the case of the GDX to gold ratio.
We marked the previous highs and the resistance that it created with short, horizontal black lines. In the first case, the miners reversed right after touching it briefly (just as we saw on Friday) and in the last two cases, miners moved slightly above it only to decline back below it shortly thereafter. That’s what we saw at the beginning of November 2016 and in December. The early November was the time when gold formed a major top and the case in December was followed by a decline in gold.
Moreover, from the purely technical point of view, this month’s upswing in the ratio was simply another verification of the breakdown below the medium-term resistance line based on the 2016 and late-2017 bottoms. The breakdown was not invalidated, so its implications remain bearish.
Therefore, can we say that the implications of the recent move higher in the GDX to gold ratio really have bullish implications? Not at all.
Q: Unlike years past miners are generating positive free cash flow does this factor into your analysis?
A: It actually confirms it. Positive free cash flows are definitely positive news that should generate medium-term strength. The emphasis is on medium term, as that’s not short-term or temporary news that could drive the prices higher for a day or two. We are not only not seeing this strength in the medium term, but we are actually seeing mining stocks underperforming gold. The fact that they underperform even despite positive free cash flows makes the underperformance even clearer and even more bearish.
Q: With prices of all commodities increasing could gold and silver be anticipating future inflation?
A: Good question. Indeed, gold is believed to be a hedge against inflation, which is not the full truth. The price of the yellow metal is also viewed as an indicator of inflationary pressures. And indeed, the chart below seems to partially confirm this thesis (notice the 2009-2011 period).
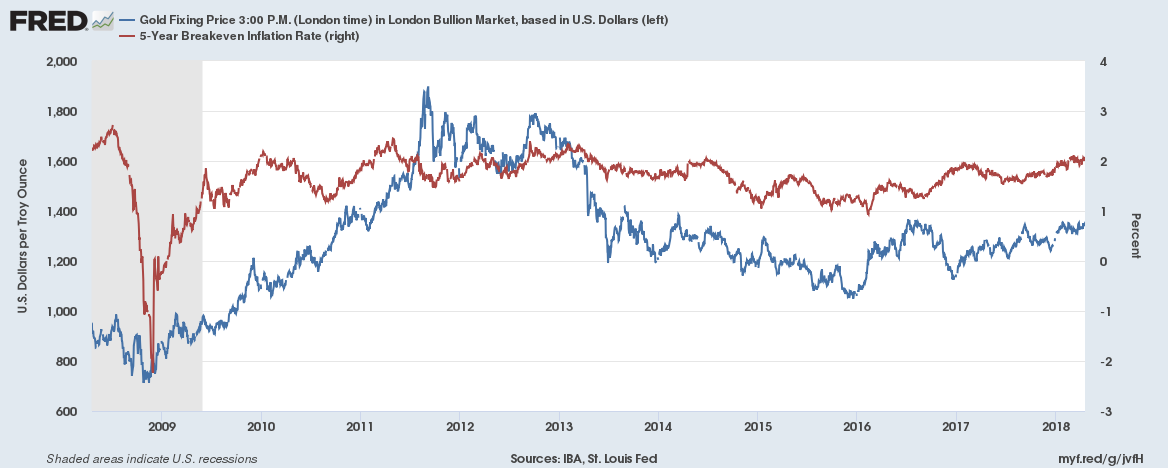
However, the correlation is far from being perfect. The decline in gold prices in 2011-2015 can hardly be explained by inflationary expectations. We believe that, at the moment, gold prices rather reflect a weak U.S. dollar. With a stronger greenback, the price of the yellow metal would be lower, despite a certain rebound in inflation. Gold shines most brightly during high and accelerating inflation - and we are not yet at this point. Inflation could rise this year, but it will most likely not get out of control.
Q: Is the back and forth in miners and PM simply a reflection of global uncertainty?
A: Most likely not. The precious metals sector should theoretically rally in uncertain times and has not so far – even though the USD moved to new lows, gold didn’t move to new highs and miners are underperforming.
We were also asked to comment on the dynamics in the juniors to gold ratio.
GDXJ to Gold Ratio
In particular, we were asked to comment on the following quote:
“GDXJ has strongly outperformed Gold over the past seven trading days. The GDXJ to Gold ratio has reached its highest mark since the start of February. That sudden relative strength is significant considering Gold is within spitting distance of a major breakout” according to ETF Daily News.
First of all, it seems better to use GLD than gold for comparison in order to make sure that the price moves are indeed comparable. The same data source and the same market ensure comparable closing prices.
When we first read that question, we were surprised. “How did we miss that” was the initial comment. The reason is that GDXJ:GDX and GDXJ:SPY are the two charts that we’re looking at on a daily basis ever since we researched them years ago. At times, they provide interesting anomalies, but it’s not the case very often (usually no more than a few times per year). The only reason that we were not following the GDXJ:GLD ratio is that we didn’t find anything exceptional in it that would add value to what we are monitoring through the GDX:GLD and GDX:SPY ratio. So, either we missed something, or the ETF Daily News analyst(s) is/are excited over something that is not really exciting. Or there was some kind of new development that we hadn’t seen previously. Either way, it’s worth re-examining the situation.
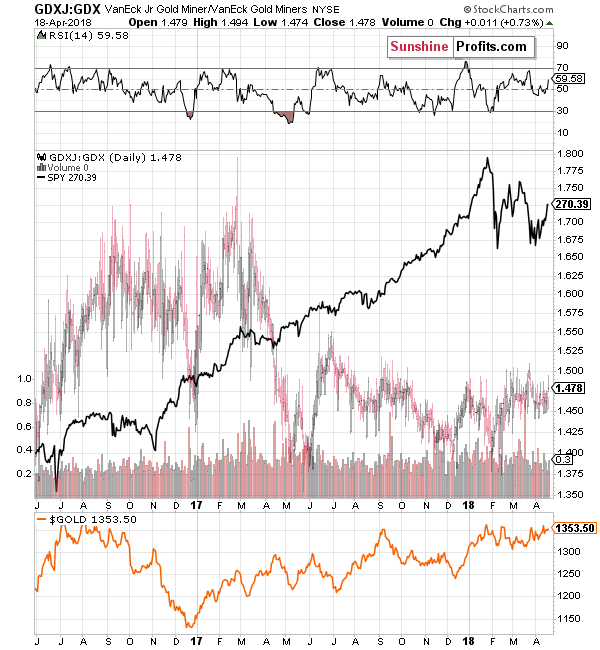
The juniors (GDXJ) to seniors (GDX) ratio has been moving back and forth in the trading range between 1.375 and 1.550 since mid-2017. The recent price move didn’t make the ratio move to new highs, it was very ordinary. The ratio has indeed moved higher from the beginning of February, but that doesn’t seem to have any implications. It also moved higher from December 2017 to early January 2018 and it didn’t cause any changes in the price of gold. There were other rallies in the ratio and they didn’t really result in anything specific – the outcomes varied. Is this bullish? Not really, especially if you factor in the fact that the biggest rally in the ratio (in mid-2016) preceded the biggest decline in gold that we’ve seen in the recent years.
The RSI indicator doesn’t show anything special about the current situation either.
Ok, but the question was about the GDXJ to gold ratio, not the one between GDXJ and GDX.
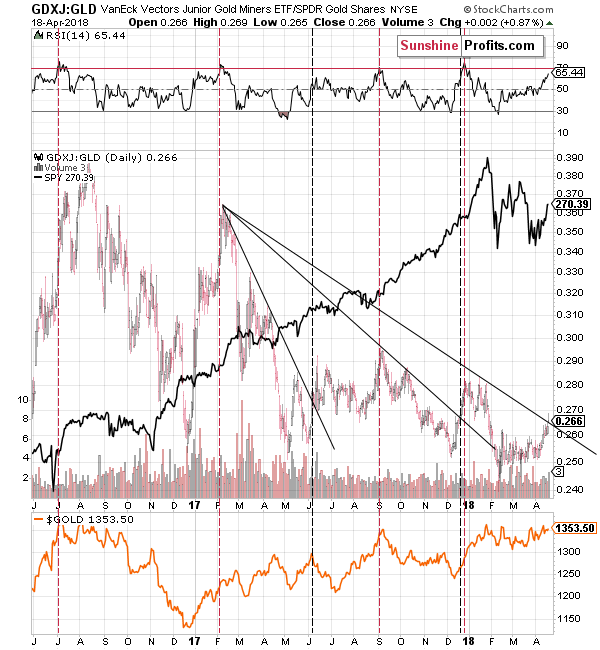
At first sight there seems to be nothing special about the above chart – the rally that we recently saw is in tune with the previous rallies (actually, a bit smaller). The problem is that these rallies were followed by different price behavior in gold – just like what we saw on the previous chart. For instance, from November 2016 to December 2016, the ratio rallied while gold declined.
But the ratio is breaking above the declining black resistance line!
That’s true, but it broke above analogous declining black resistance lines already twice in the recent past and we marked those cases with vertical black dashed lines. In one case the breakout took place at gold’s top (June 2017) and in the other case, the breakout took place during gold’s rally (December 2017). Therefore, there is no clarity regarding how we should interpret the recent breakout and thus it’s not a reliable signal. It doesn’t seem to help in predicting gold prices at all.
But the RSI is moving toward 70 – it’s showing strength!
Again, it’s true, but it doesn’t imply anything. We marked cases when the RSI based on the ratio was moving to or above 70 and there were 4 such cases. In 2 cases, gold topped at that time, and in 2 cases gold continued to move higher. That’s exactly the opposite of the performance that we would like to see in a signal. Gold could be topping, but it could also rally further – this signal doesn’t seem to tell us anything reliable.
Summary
Summing up, investing in and trading the precious metals market is much more difficult than it appears at the first sight as some of the mechanics are counter-intuitive. Soaring and outperforming silver seems bullish, but it really isn’t, positive free cash flows that mining stocks generate seem bullish at the first sight, but when compared to the actual price moves of the mining shares, they become a bearish factor, and implications of rallying junior mining stocks are actually nonexistent even though higher prices seem quite promising.
It’s easy to get carried away by emotions when volatility spikes, but if one want’s to make serious profits in any market, including the precious metals market, the key trading tip that one needs to keep in mind is to make sure that one follows cold logic when making investment decisions, not emotions. The stoic approach to investing is likely to pay off with both: peace of mind and sizable returns. In this case, looking at the big picture and considering many factors should prove much more beneficial than trying to catch the silver market during its volatile upswing.
Please note that the above is based on the data that was available when this essay was published, and we might change our views on the market in the following weeks. In order to stay updated on our thoughts regarding the precious metals market and our free articles we suggest that you sign up to our gold & silver mailing list – it’s free and if you don’t like it, you can unsubscribe anytime.
Przemyslaw Radomski, CFA
Founder, Editor-in-chief, Gold & Silver Fund Manager
Sunshine Profits - Gold & Silver Investment
* * * * *
All essays, research and information found above represent analyses and opinions of Przemyslaw Radomski, CFA and Sunshine Profits' associates only. As such, it may prove wrong and be a subject to change without notice. Opinions and analyses were based on data available to authors of respective essays at the time of writing. Although the information provided above is based on careful research and sources that are believed to be accurate, Przemyslaw Radomski, CFA and his associates do not guarantee the accuracy or thoroughness of the data or information reported. The opinions published above are neither an offer nor a recommendation to purchase or sell any securities. Mr. Radomski is not a Registered Securities Advisor. By reading Przemyslaw Radomski's, CFA reports you fully agree that he will not be held responsible or liable for any decisions you make regarding any information provided in these reports. Investing, trading and speculation in any financial markets may involve high risk of loss. Przemyslaw Radomski, CFA, Sunshine Profits' employees and affiliates as well as members of their families may have a short or long position in any securities, including those mentioned in any of the reports or essays, and may make additional purchases and/or sales of those securities without notice.
********
 Przemyslaw Radomski, CFA, is the founder, owner and the main editor of SunshineProfits.com. You can reach Przemyslaw at: http://www.sunshineprofits.com/help/contact-us/.


