There Is A Time For Everything


. . . And a season for every activity under the heavens. So too, a time for the bull and a time for the bear and it would seem we are in for a change of the seasons. A change of that nature is not a one day affair, but is spread over time. We are well aware of the changes of day and night as these happen visibly and according to the cycle of our activities as informed by our watches. Yet, even using a calendar one cannot say yesterday was still summer and today it is autumn. Similarly, observers of financial markets cannot pronounce a market as bearish just a week or two after having viewed it as bullish. Hindsight is needed to be certain of the change. The odds favour however that we soon will be able to look back and say, “Wall Street is a bear. Gold and silver are bulls.”
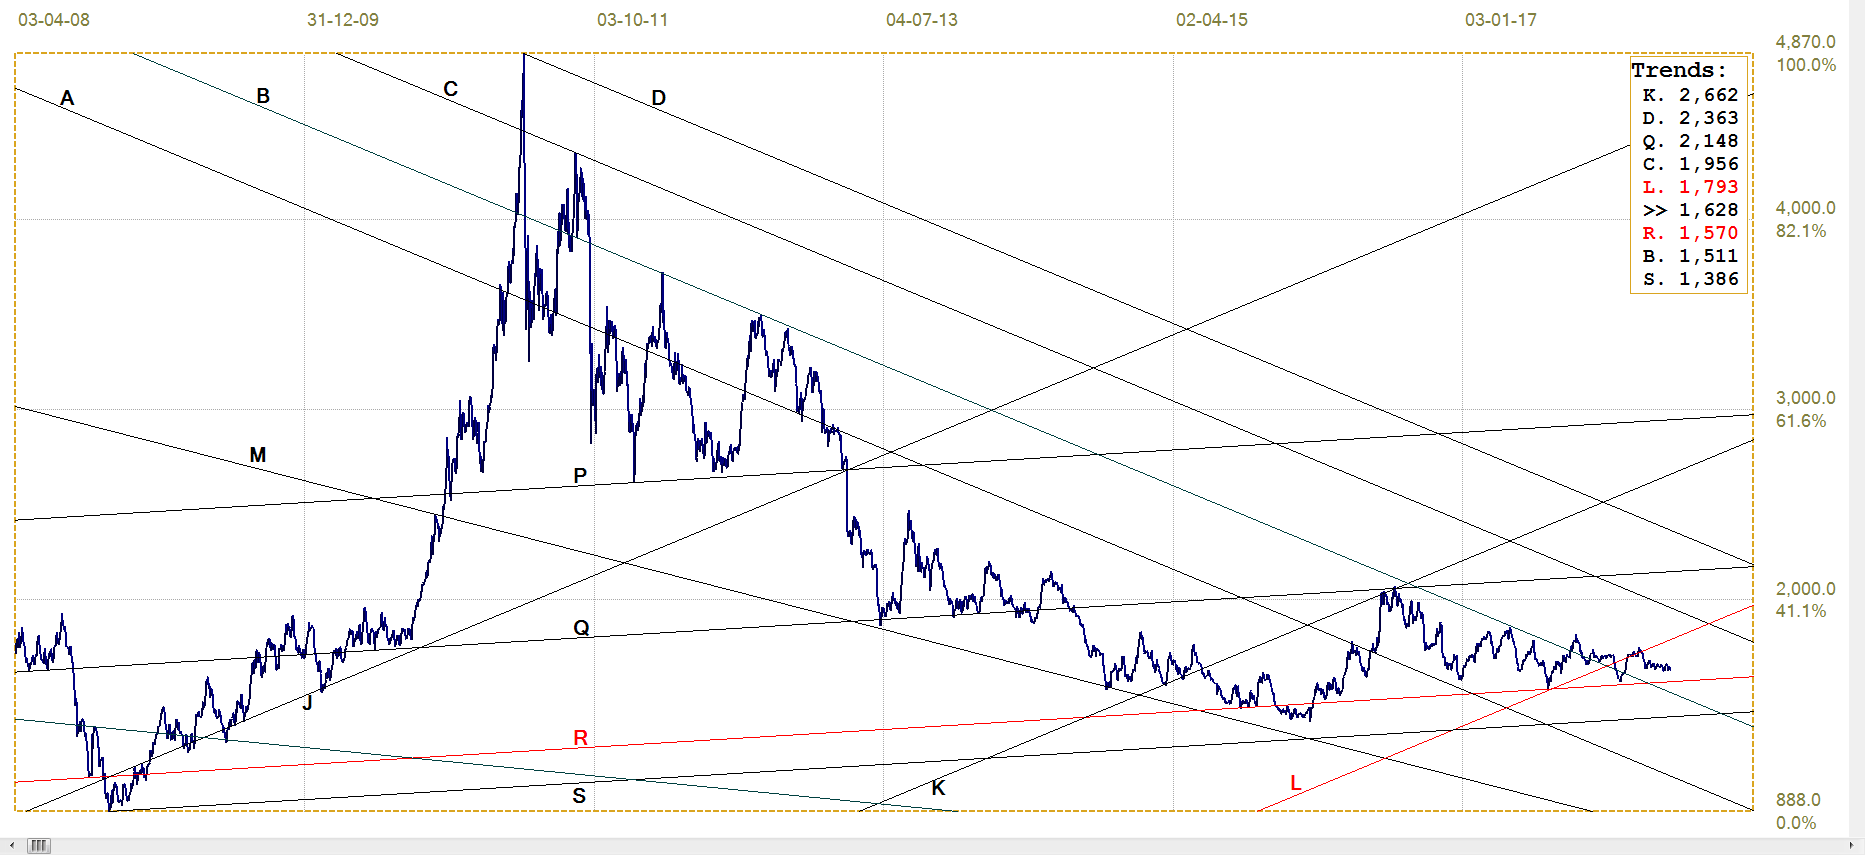
Regarding the health of Wall Street as reported by the SP500, the steep support line since the end of 2016 on the chart of monthly averages of the SP500 shown last week is at 2667 points by the end of April. After a close at 2604 on Friday, the average for the first five trading days of April stands at 2621.62. There is still three weeks to the end of April; if the recent volatility with a bearish bias continues, there should be clear break below the steep monthly support line when April ends.
The 20% decline from the all-time high which supposedly confirms a bear market, requires a daily close below 2298, which is still some distance away and is likely to spark real panic should the SP500 even approach that level. Technically, though, confirmation of the bear is at a much higher level, with strong rising support for the end of April at 2435, only another 6.5% to go.
While the Wall Street bull market had started in March 2009, with a massive rescue package for the financial system from the Federal Reserve, the silver bear market started in early April 2011, already 7 years ago, and for gold in early September of that year. Both metals began to rally late in 2015 and improved substantially by mid-2016, when the prices ran into a wall and fell steeply again. Since a new low, the price of gold began a new if shallower rally, while the price of silver continued lower to settle in a very tight range barely above $16 – a perplexing dichotomy of behaviour between the metals that now has many heads being scratched trying to explain the reasons for this situation.
This dichotomy extends beyond the price behaviour to the relative changes in the open interest of the metals on Comex. The 2015/16 rally had open interest for gold up at about 620k and for silver close to 230k. Subsequently and after their prices fell to lows by the end of 2016, the open interest for gold drifted much lower and in early March this year briefly dipped below 500k. Just after mid-March the gold OI had jumped back to above 570k, but last week it ended below 500k again.
The silver OI also showed volatility, but recently it experiences steady increases and now – with the silver price steady near its recent lows – the OI has set a new all time high above 240k contracts to represent 1.2 billion ounces with a nominal value of about $20 billion dollars and with a premium cost of about $850m. The estimated production of silver in 2017 was 25 000 tons, about 800 million ounces. The OI, supposed to be immediately deliverable by the seller if a buyer so requests, exceeds annual production by 50%.
Under the circumstances this is very strange, counter-intuitive. The situation as far as gold is concerned is closer to normal, at least to a degree; the lower price of gold earlier this year would have seen longs leave the market, which they did do to have the gold OI below 500k. The jump in the OI that followed, can be explained by the start of the recent gold rally, but then the sudden decline back below 500k is unexpected. Unless, of course, the lack of direction the past week or two has sent the large number of about 70k longs to close and sit it out on the sidelines.
The really strange is the large inflow of capital into the silver OI while the price is so low and showing no sign of going anywhere except sideways and trying to test $16. Since the beginning of the year, the silver OI has hovered near the 190k level, with a brief foray above 200k in mid February and then down to 190k again. From early March there was a near constant increase in the OI to take it to 243k on the early statistics on Friday. That is better than 50k new contracts in about a month. This is not due to many small players entering the market, each on their own deciding to disregard silver’s poor performance and to purchase contracts just on a hunch.
It implies that the fresh buying is likely to be either by a large institution acting on its own or a small coterie of wealthy individuals who have shared their knowledge about some situation that favours a jump in the price of silver. The increase in OI represents more than 250 million ounces of silver with a nominal value in excess of $4 billion. Even JPM will have to take cognizance of that amount of new risk for the shorts – which might include short selling by hedge funds. who will not wait very long to cover their positions if the price rallies, as the new longs anticipate.
This all should strongly imply that the current low volatility as metal prices track mostly sideways is only a prelude to a significant new bull trend. With most of the silver OI in the May and July months, it is not that long a time to wait.
Markets other than Wall Street are rather quiet, with relatively few changes from last week. Wall Street with its ups and downs also has not changed that much, but it had a torrid time last week with high intra-day volatility and large daily swings. Given the steep decline on Friday, many equity investors surely did not have an enjoyable weekend as most of the US is saying goodbye to winter – perhaps.
Euro-Dollar
The euro is holding support of line H ($1.2252), but is just below line Q ($1.2297), still within a tight sideways consolidation. There is nothing really to say until a new trend emerges – possibly bullish, at least while line H holds.
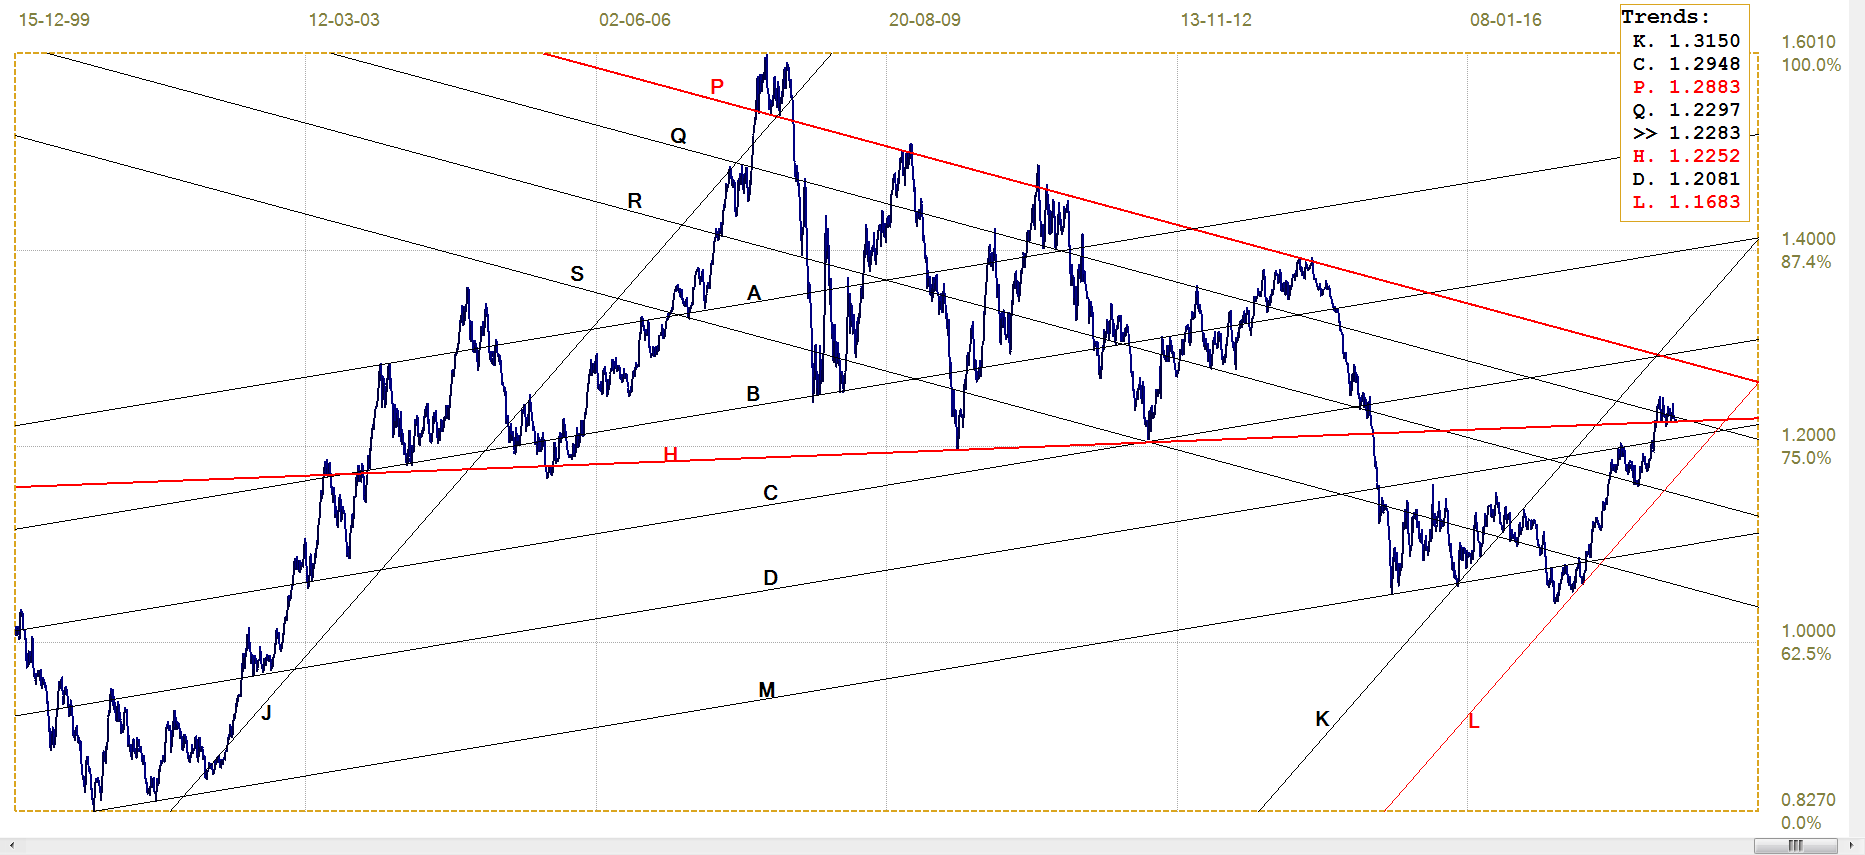
Euro-dollar, last = $1.2283 (www.investing.com )
DJIA
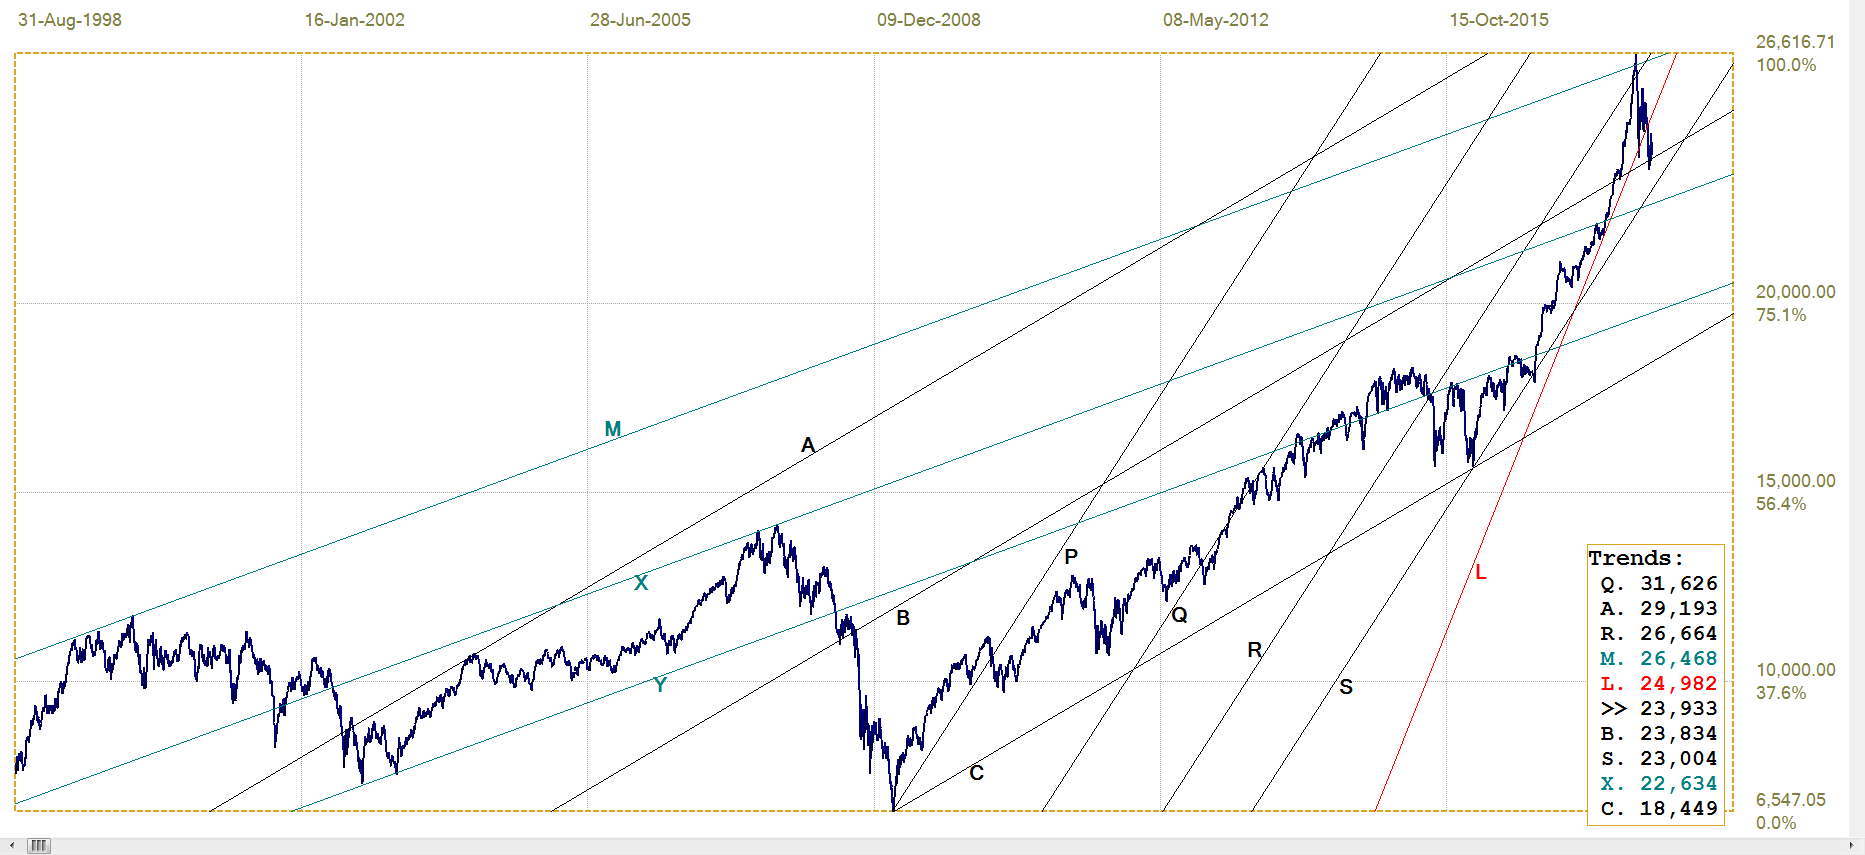
DJIA, last = 23932.76 (money.cnn.com)
The DJIA has now twice broken below the key support along line B (23834) – the second time on Monday 2nd April – and then immediately rallied back, Neither rally could manage a recovery back above the steep line L (24982). Friday’s sell-off of more than 500 points is still a 100 points above line B. While a break below line S would be bearish, it still requires a break below bull channel RS (23004) to give a full warning that the bear has taken over.
Gold PM fix - Dollars
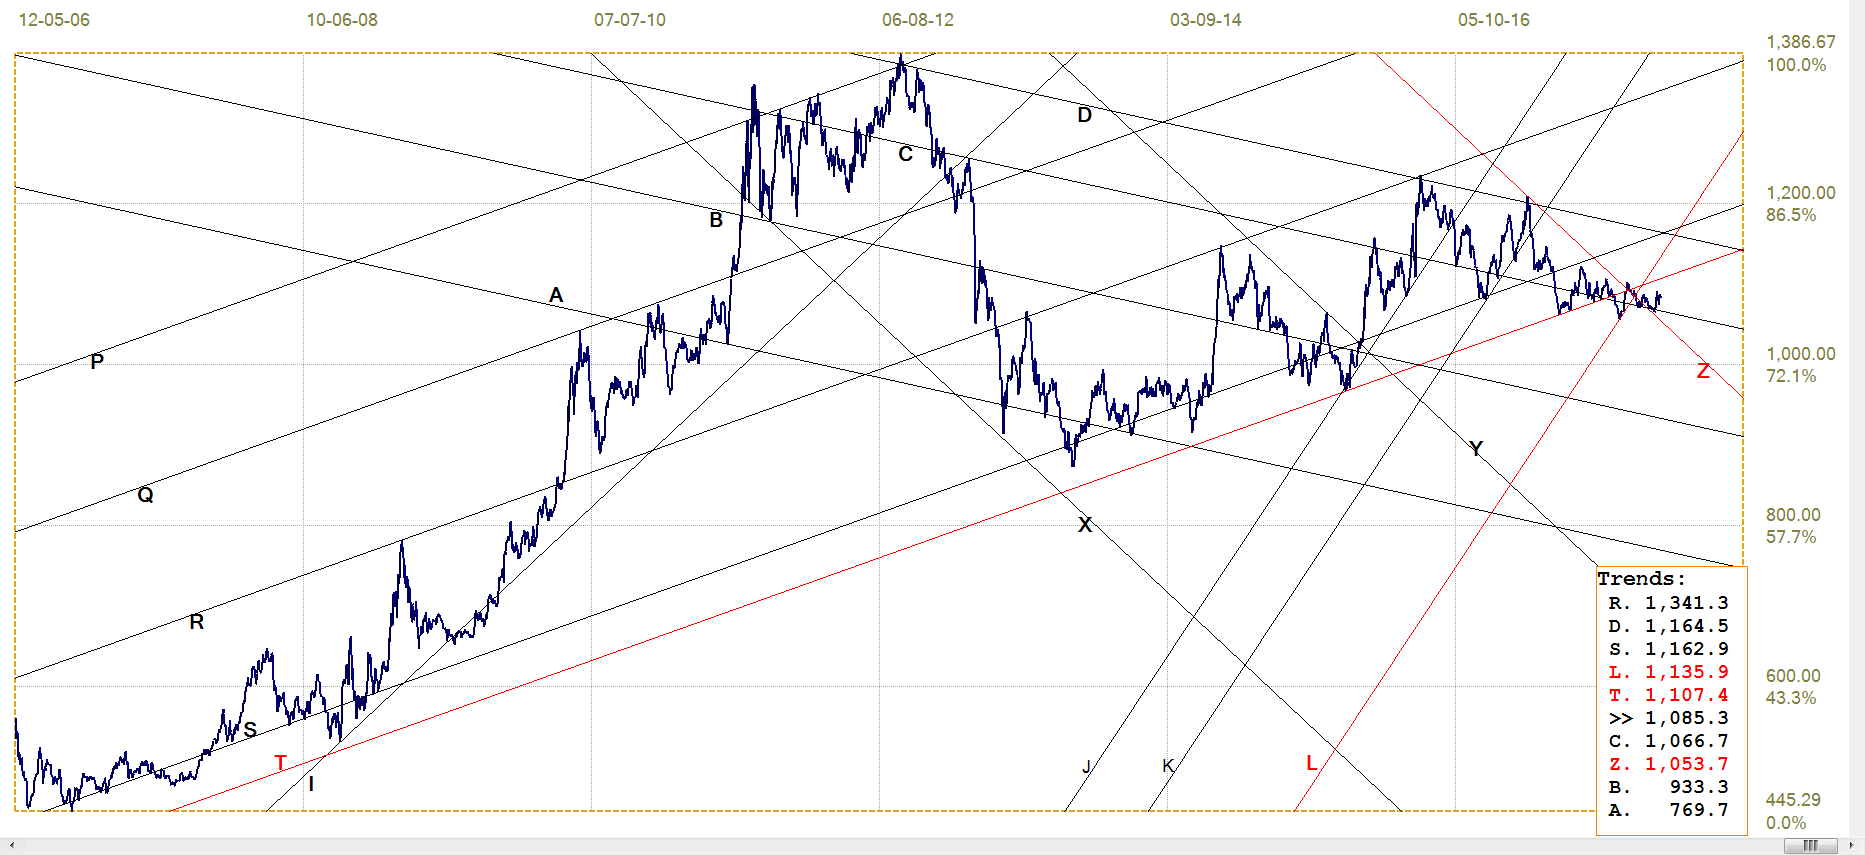
Last week saw an unsteady recovery after the price of gold tested support along line L ($1326), jumping higher only to slip back, but at least holding clear of line L. With the OI again below the 500k mark, it is anyone’s guess whether the longs will continue to desert the metal and have the price dipping below the support.
Gold price – London PM fix, last = $1331,20 (www.kitco.com )
Euro-Gold PM fix
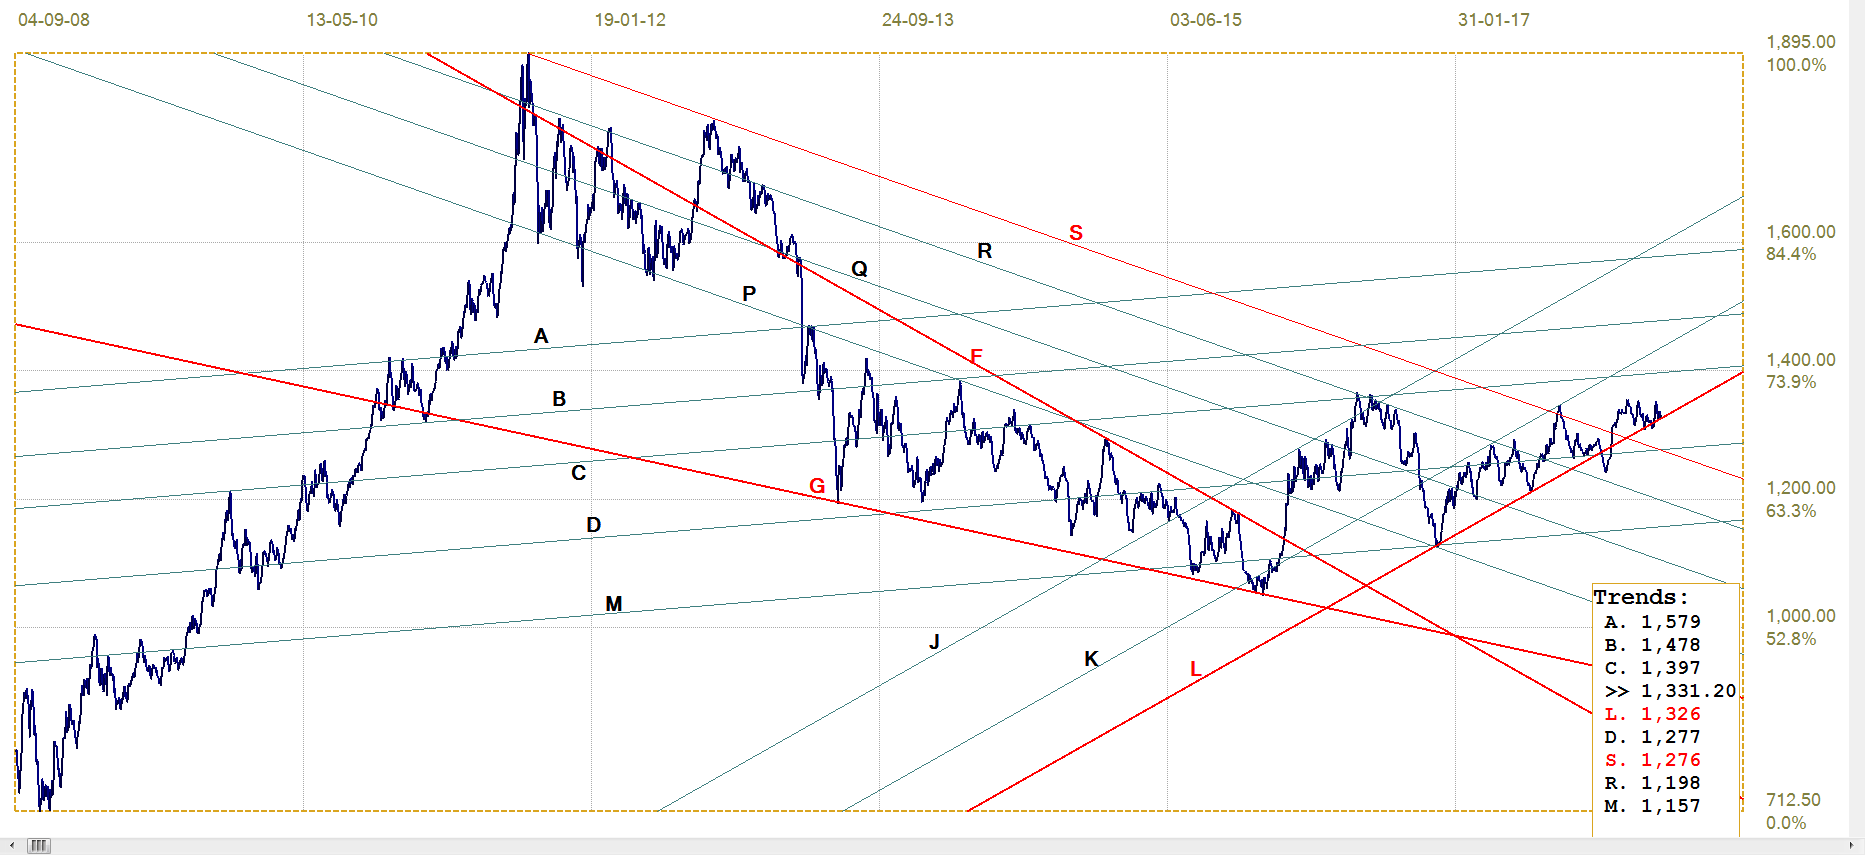
Much like the price of gold and the euro have done, the euro price of gold is caught in a tight range and showing no sign of direction. It has moved higher off declining support along line C (€1066.7), but then lost way to sit almost unchanged. Small gains from any improvement in the price of gold is balanced by the changes of the euro against the dollar. It seems that the gyrations on Wall Street are mesmerising to such a degree that other markets have come to a standstill. Perhaps when Wall Street settles in a definite direction this will change.
Euro Gold Price – PM fix in Euro, last = €1085.3 ( www.kitco.com)
Silver Daily London Fix
Silver daily London fix, last = $16.28 (www.kitco.com)
The strange developments around the silver open interest were discussed in the introduction. One explanation could be that the sellers have turned up the effort to pressure the price of silver and have become very aggressive. But that would not explain why the price has been in such a very tight range since the second week in February – which includes the initial surge off 190k in the OI and a brief decline back to 190k and then the sustained increase to 243k on Friday.
The other explanation is that there has been a sustained increase in demand for the silver contracts and that much effort is being expended to keep the price of silver following that of gold – as if there is fear that an obvious rising trend in silver could trigger a Bitcoin effect, with buyers flocking into the market to buy at any price.
US 10-year Treasury Note
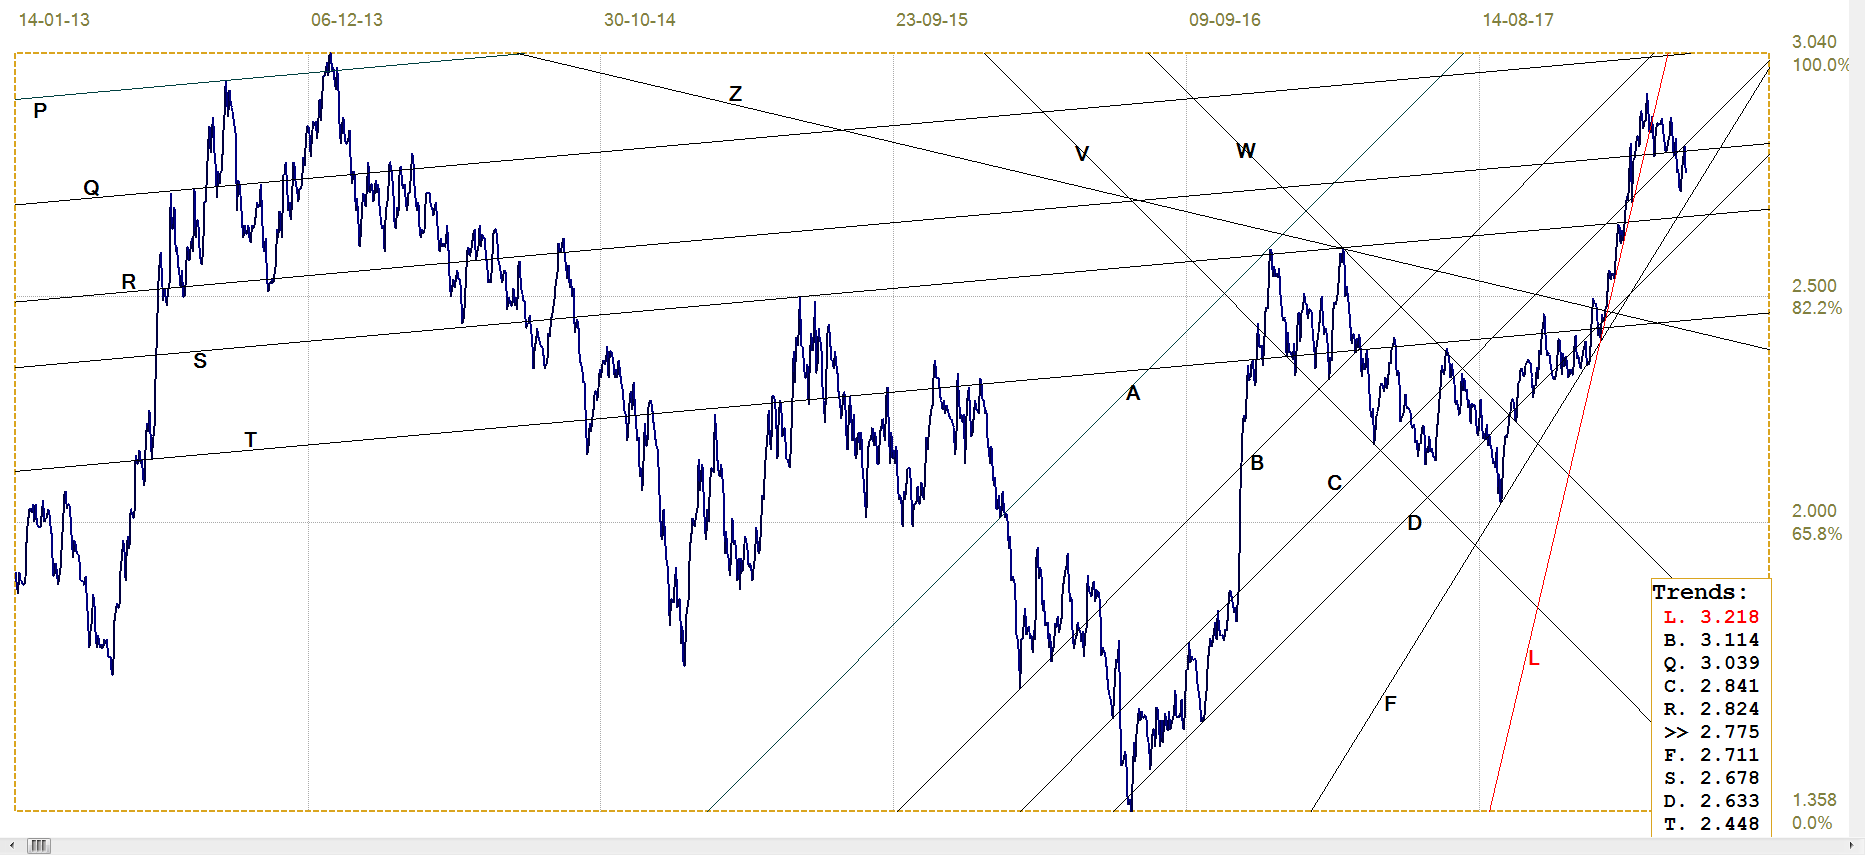
U.S. 10-year Treasury note, last = 2.775% (www.investing.com )
After the very steep bear trend that kept above the steep line L (3.218%) topped out an broke below the steep support, the yield turned volatile; at first failing to break back below line R (2.824%) and when a steep break did happen, reversing as quickly back above line R to touch line C (2.841%). Last week the yield again broke below line R to show some market strength.
Technically, the behaviour since the top of the spike resembles a steep and tight flag formation which, typically, develops as temporary consolidation in a sustained trend. If that were to be the case here, the bear trend would resume, probably to hold above line F (2.711%).
West Texas Intermediate crude. Daily close
Here is another market that recently enjoyed a good rally, keeping away from the support along line L ($60.71) until the price had broken above the resistance along line R ($62.83). Soon after, the rally ended and the price began to shift sideways with no clear direction. Twice dipping back below line R only to rally higher again, it ended last week just marginally below line R again.
As has been said more than once, it appears as if the interplay between OPEC and the frackers and changing supply and demand has for some time reached a state of near equilibrium, with minor changes having a relatively small effect on the price. It does not seem to be a very stable state, given the nature of the main players and the key factors that determine the price, but the next direction in the price is not easy to anticipate.
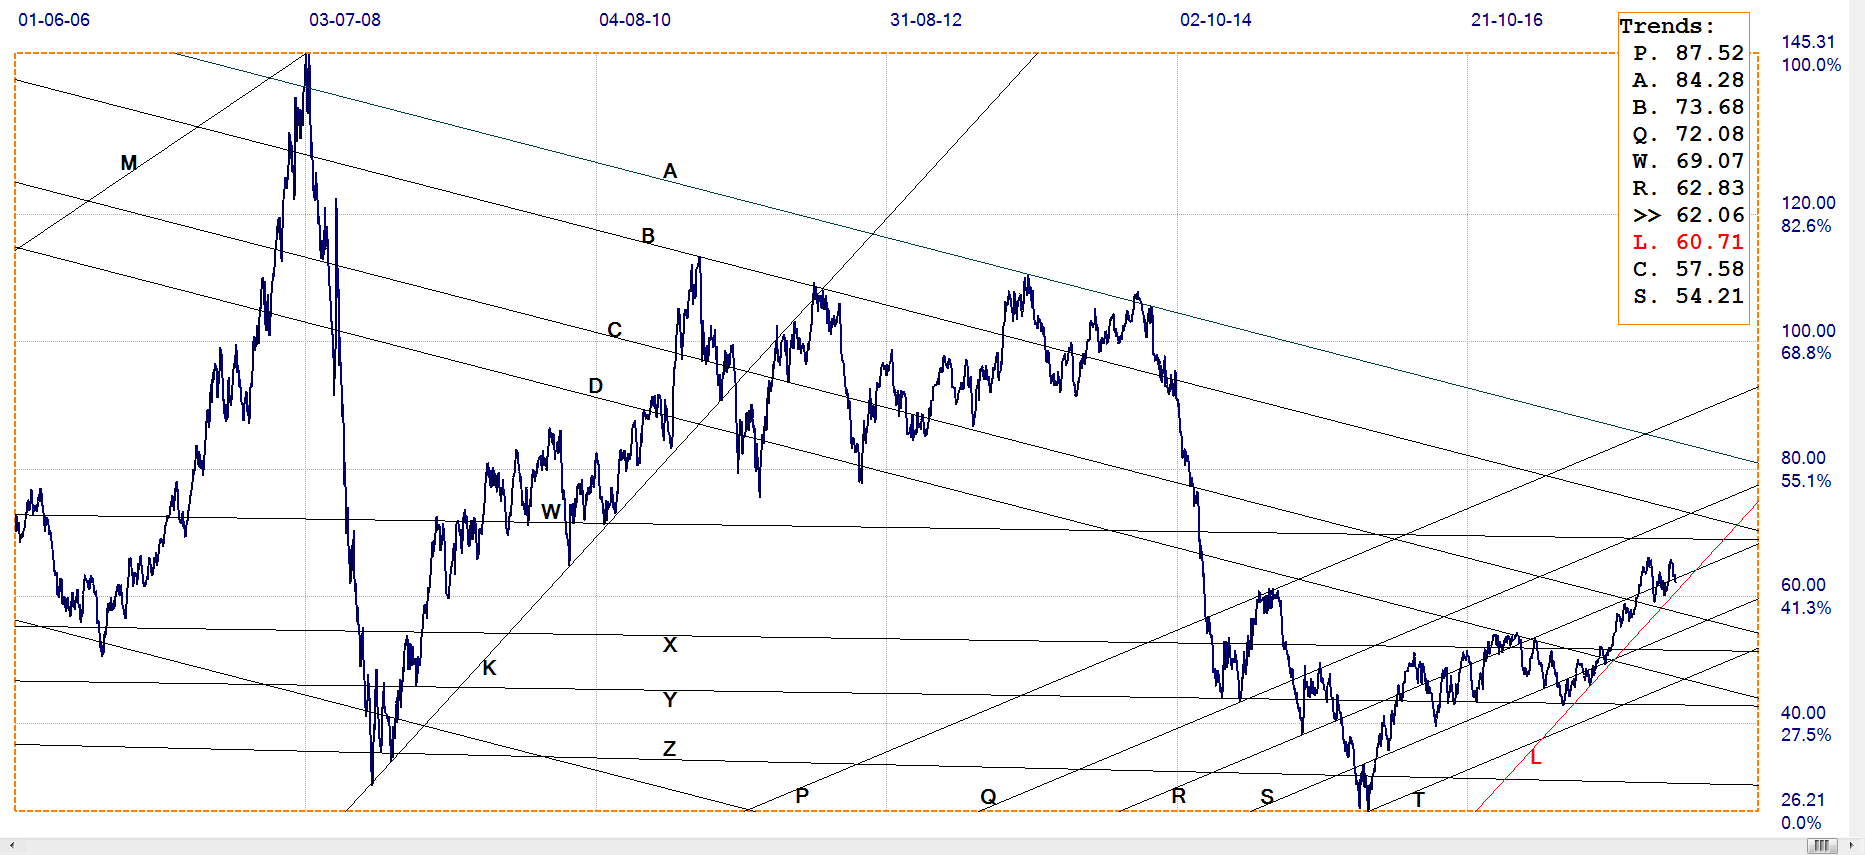
WTI crude – Daily close, last = $62.06 (www.investing.com )
********
More from Gold-Eagle


