Tis A Gold Trifecta!!!


What a wonderful week for Gold! In settling yesterday (Friday) at 1516, 'twas Gold's best week by both percentage (+2.2%) and points (+33) since than ending 09 August. And it brought with it a terrific trifecta! Here we go!
First Place: Santa comes through! Our 30 November query "Shall Santa Gift Gold at 1500?" was answered in the affirmative and moreover with exquisite timing, ole St. Nick delivering the goods with just three trading hours to spare before the Christmas break, the price of 1500 being regained at precisely 07:11 Pacific Time (15:11 GMT) leading into the "night of nights", after having fallen from that level back on 05 November and only to then to have been saved by the sublime "support shelf" at 1454-1434. Further, since last tapping that shelf on Thanksgiving Eve (27 November), Gold is now +4.3%, Silver is +5.6%, and amongst the top quality precious metals equities, Newmont Goldcorp (NEM) is +11.9% and Pan American Silver (PAAS) is +23.8%. Got leverage? The king is in his counting house!
Second Place: 'Tis a Gold Update Scoreboard Milestone! See it up there a-flashin' in green? Our valuation of Gold given currency debasement per the StateSide money supply measure of M2, even as offset for the increase in the supply of Gold itself, has crossed above the $3,000/oz level! So much upside distance by which to regress toward getting back in sync with the "faux dough"! And as is our wont to say, that's before the overshoot!
Third Place: Gold has sufficiently muscled up such that we're ready to reveal our forecast high for next year: 1675. Discounting the two remaining trading days for this year -- and they could be doozies regardless of direction -- 1675 from here yields a gain during 2020 of 10%. On the heels of this year's overall run to as much as +22%, that may seem conservative to some, but 'tis that very 1650-1700 zone which was rife with fits n' starts n' support n' resistance in each of 2011, 2012 and 2013.
To wit as we turn to our chart of Gold by the 100s (this time animated so as to see "The Gap" getting filled in a bit), the 1600s represent the top of that span. 'Course, bust up into the 1700s and the Great Drive to 2000 will be on! But initially, let's look to 1675 as a realistic, indeed admirable, goal for 2020:

But wait: there's more! Guess what technical Gold staple just flipped from Short to Long?
"Gold's weekly parabolics, mmb..."
Our man Squire right there nailing the answer to the rhetorical question! But 'tis a beautiful thing as well, this next chart of Gold's weekly bars. In brilliant ebb-and-flow rhythm from one year ago-to-date we've seen price's retaking of Base Camp 1377 en route to meeting our conservative forecast high of 1434 (in turn becoming the base of the rectangular "support shelf") followed by the turbo-charged boost to the aggressive forecast high at 1526 (and, although briefly, then some). Here's the graphic, the first new encircled blue dot of the Long trend pointing the way higher. "Miss Gibbs? Could you please reach out to the Louvre as to their taking this one on loan?"
Impressive, or better stated excessive -- and extremely so by every technical tool ever devised -- is the stock market as measured by the S&P 500. Not to esoterically drag you through the weeds, but for each of the past five trading days we've recorded "extreme" overbought S&P readings by Bollinger Bands, Relative Strength, and Stochastics. The last day we had five such successive extreme readings on all three studies was 11 April, after which the S&P then fell from 2918 to 2729 (-6.5%) come 03 June. Just sayin', party boy, as we next bring in the Economic Barometer (blue line) and S&P 500 (red line) year-over-year:
'Twas a quiet week for incoming data as evidenced by the Baro's rightmost flatlining, no news in turn being good news for the S&P. That noted, the "agreed to Phase 1" United States/China trade deal has yet to actually be inked, whilst elsewhere (according to a FinTimes poll of 34 economists) EuroZone economic growth for next year is forecast to average less than +1%; (the Stateside averaged annualized Gross Domestic Product growth rate through this year's three quarters is +2.4%).
Now as for you skeptics out there whose inarguable belief is that Gold and the stock market trade in opposite directions, let's take a quick peek at the yellow metal's performance vs. that of the S&P from one month ago-to-date (21 trading days). Well looky there ... Gold is +3.6% and the S&P +2.7% as they renew their pas de deux:
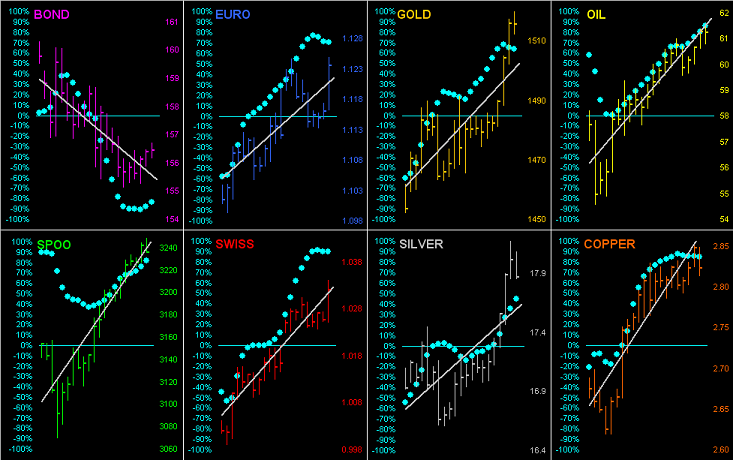
'Course year-to-date, those gains are at present +18.2% and +29.2% respectively. And unless you're Mr. Bond, this last month has been "nuthin' but up" as we go 'round the horn for all eight components that make up the BEGOS Markets. Here are their daily bars and "Baby Blues", the dots that indicate the consistency of each market's 21-day linear regression trend: And at the Bond's demise, the balance of the bunch have been on the rise:
To our final technical graphic for this year, the 10-day Market Profiles for Gold on the left and Silver on the right. 'Tis said "Life is good at the top" where (with but those two trading days remaining in 2019) 'twill be a wrap for the precious metals:
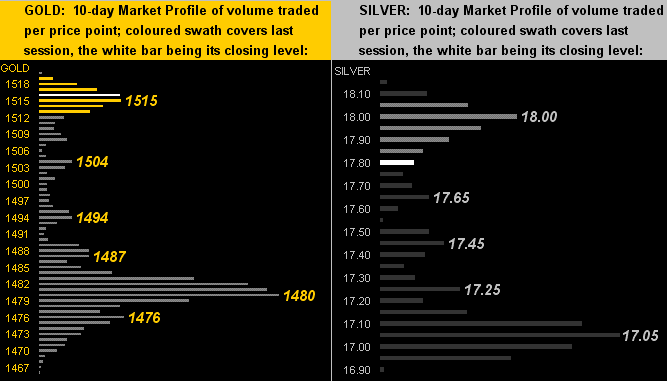
A fairly forthright upward 2019 for Gold. With 250 trading days now in the books, Gold (obviously not consecutively) settled 64 of them in the 1200s, 57 of them in the 1300s, 81 of them in the 1400s, and 48 of them in the 1500s. As noted earlier, from low-to-high Gold has gained as much as 22%; but Sister Silver wins that contest springing from as low as 14.265 (28 May) to as high as 19.750 (04 September): that's a +38.5% span.
Next week is another fairly light one for the Econ Baro, albeit by consensus expectations, it looks to work a bit higher. Also we'll have our month-end version of The Gold Update highlighting the final 2019 standings of the BEGOS Markets along with the year's performance of Gold and its high-level equities brethren. We'll also see as to where our forecast 1675 Gold high for next year fits into the broad-based structure chart. 'Tis gonna be fun so stay tuned for that one!
A Safe and Happy New Year and Thank You to all of our beloved, cherished, valued readers. For Squire, Miss Gibbs, Gold Nanny and all those who've gotten us plugged in wherever we've been, your following, linking to and republishing these weekly missives through these many years means more than you know. Now on to 2020 with Gold to Go!
www.deMeadville.com
www.TheGoldUpdate.com
********

Mark Mead Baillie has had an extensive business career beginning in banking and financial services for two years with Banque Nationale de Paris to corporate research for three years at Barclays Bank and then for six years as an analyst and corporate lender with Société Générale.
For the last 22 years he has expanded his financial expertise by creating his own financial services company, de Meadville International, which comprehensively follows his BEGOS complex of markets (Bond/Euro/Gold/Oil/S&P) and the trading of the futures therein. He is recognized within the financial community of demonstrating creative technical skills that surpass industry standards toward making highly informed market assessments and his work is featured in Merrill Lynch Wealth Management client presentations. He has adapted such skills into becoming the popular author each week of the prolific “The Gold Update” and is known in the financial website community as “mmb” and “deMeadville”.
Mr. Baillie holds a BS in Business from the University of Southern California and an MBA in Finance from Golden Gate University.


