Volatility Index VIX And SP500 Comparison Vis-a-vis 2008 Market Top
 share
share
 share
share
 share
share
 share
share
 share
share
I like to share my thoughts about the S&P500 index, the volatility index and what I believe will be the trigger/event, which sends stock markets around the world to new multi-year lows.
While the charts shown here are very simple there is a lot of information behind the scenes that backup the analysis/predictions made below.
For example, the sentiment of the average market participant remains extremely bullish on the market. The majority of investors think and feel stocks will continue to rise in the coming year. Typically, when the majority of investors think the same thing, it tends to be a contrarian signal that the opposite will soon take place.
Cycle analysis is telling us that the seven-year cycle, which is one of the most powerful cycles that reoccurs in the stock market is now topping. What does this mean? It means we should expect a 1-3 year stock market correction.
The market breadth has been slowly deteriorating over the past year. Fewer stocks are making new highs -- and many leading sectors are already in bear markets.
So it is just a matter of time before the US large-cap stocks roll over, breakdown and start a new bear market.
As of Friday (July 9) we've seen the stock market momentum show signs of a short squeeze. Moreover, the majority of market participants are in a frenzy running to buy stocks. In fact, the NYSE volume ratio shows that there are 18 shares being purchased to every 1 being sold on Friday. I consider a ratio over three to be an extreme level, meaning 18 is signaling a potential significant turning point in stocks in the coming week.
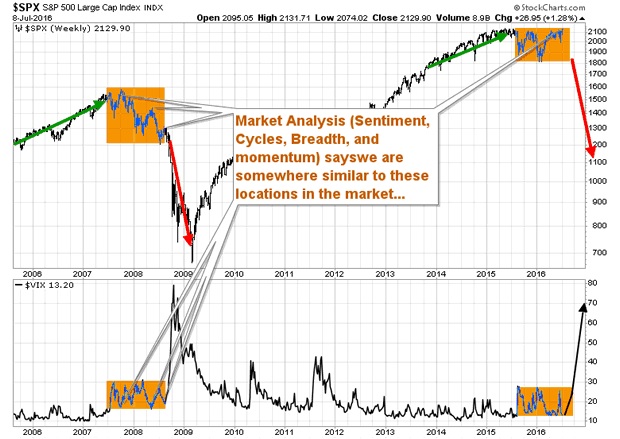
S&P500 And Volatility Index (VIX) Weekly Comparison Chart
If you take a look at the chart below, you can see where I feel the stock market is currently trading in terms of its 2007 to 2008 market top. The volatility index is also showing similar patterns to what we saw before the 2008 bear market.
Based on the current price action of the S&P500 index and the volatility index, it appears that a sharp decline in shares is likely to unfold in the coming weeks.
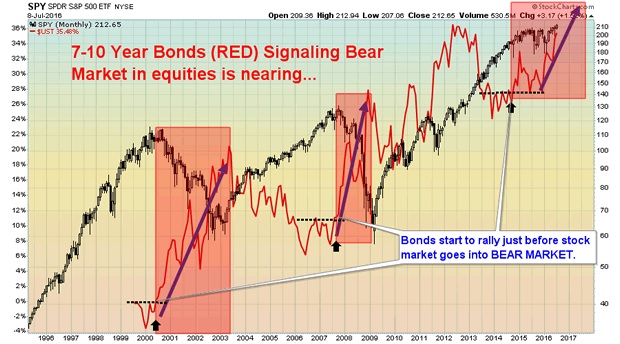
SP500 And Bond Price Comparison – Bonds rally before…i.e. lead Bear Markets
Take a look at the chart below. The red line is the price of US bonds. The black candlestick chart is the S&P500 index which is the US large-cap stocks. As you can see the price of bonds start to rally way before the US stock market rolls over and sells off.
Why does this happen? I believe that the smart money is rotating their money slowly out of equities and into bonds in anticipation of the bear market collapse. Bonds act as a safe haven during times of weakness in both the economy and stock market.
US equities still have a long way to fall before they are technically in a confirmed bear market. The recent rally in bonds is just the beginning for what is to happen.
The Trigger/Event/Tipping Point for A Global Equities Crash
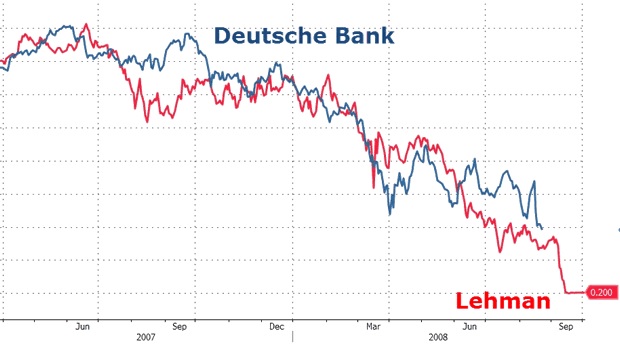
In a recent article called "Deutsche Bank To Initiate The Next Financial Crisis! ", I wrote about how Deutsche Bank is going down the exact same road as Lehman Brothers. In short, both stocks are declining in a similar fashion in terms of share price.
But here is the kicker... If you thought Lehman Brothers was bad, you haven't seen anything yet. The big differences this time around is that the current banking crisis is 40 times larger than Lehman Brothers -- and will directly affect almost all key countries and banks around the world. And this time, countries are in far worse shape financially than they were in 2008 during the Lehman Brothers bankruptcy.
My Concluding Thoughts
In short, the US stock market is trying to hold up and convince investors everything is fine. While stocks are testing all-time highs, I know as a technical analyst that the market is much weaker than it appears.
A lot of things are coming together to form a major market top but like all previous stock market tops, they require a lot of time to mature before they breakdown and new nominal highs are normal to see.
Related Article:
Derivatives Crisis Of Banks…Worldwide
A Bear Market In US Stocks Looms…Indeed A Déjà vu 2007-2008
Courtesy of www.TheGoldAndOilGuy.com
share
share
share
share
share

Chris Vermeulen has been involved in the markets since 1997 and is the founder of Technical Traders Ltd. He is an internationally recognized technical analyst, trader, and is the author of the book: 7 Steps to Win With Logic
Through years of research, trading and helping individual traders around the world. He learned that many traders have great trading ideas, but they lack one thing, they struggle to execute trades in a systematic way for consistent results. Chris helps educate traders with a three-hour video course that can change your trading results for the better.
His mission is to help his clients boost their trading performance while reducing market exposure and portfolio volatility.
He is a regular speaker on HoweStreet.com, and the FinancialSurvivorNetwork radio shows. Chris was also featured on the cover of AmalgaTrader Magazine, and contributes articles to several financial hubs like MoneyShow.com.
More from Gold-Eagle