Whither The Dollar?


The US dollar, as the reserve currency of the world, is the single most important entity in global trade and finance. Assisted by the US 10-year rate and the level and trend of Wall Street, the sate of these three markets , either separately or in combination, dominate conditions for any across border transaction of significant size in the western world. Probably in Asia as well. There has been much talk of the dollar performing a (near?) Weimar in the not too distant future. Does a long term technical look at the dollar support or deny such a view?
Last week, the number of new COVID cases spiked a little higher to record numbers higher than any others since mid August. On Wednesday there were almost 61 000 new cases. While the increase has not lasted long enough to be regarded as a start of a ‘second wave’, the next 2-3 weeks should answer that question. This increase also is too brief to have effect on the number of deaths last week, which remained at about the same number as the week before.
In taking a look at the longe term history of the dollar, it is not wise to consider an individual currency pair of the dollar against another major currency; the charts are too strongly influenced by the local economic and other relevant conditions of the second currency to be accurate for a long term forecast. Since 1973, the US Federal Reserve has maintained various dollar indices against a basket of other currencies. The currencies in the baskets were weighted by the volume of the two-way trade between the US and the other country.
Reacting intuitively, the components of this index should vary so independently it cannot display any pattern or structure; particularly over the longer term as the economies of different countries develop at different rates, patterns of consumer shopping and people’s other habits change to as well as many other factors that could influence either the exchange rates or the volumes of trade. It nevertheless turns out that the weighted indexes display accurate channel patterns over a long time that are similar to what I have seen in all other analyses of many charts.
The original time series starting in 1973 were terminated by the Fed at the end o 2019. However, in 2006 the Fed began to compile new indices rather similar to the two they later terminated. Whereas my previous analysis of these older time series used monthly average, I also have their daily values and those of the newer time series. I joined the older daily time series with the new one at the change from 2005 to 2006, adjusting the older values to flow smoothly into the new series after 2005. The chart of the complete dollar weighted exchange rate index from 1973 to Friday 2 October (the last update by the Fed) was then analysed.
The Fed describes the two series on their data files as:
DTWEXM - Trade Weighted U.S. Dollar Index: Major Currencies, Goods (DISCONTINUED), Index Mar 1973=100, Daily, Not Seasonally Adjusted
DTWEXAFEGS - Trade Weighted U.S. Dollar Index: Advanced Foreign Economies, Goods and Services, Index Jan 2006=100, Daily, Not Seasonally Adjusted which does not provide much information.
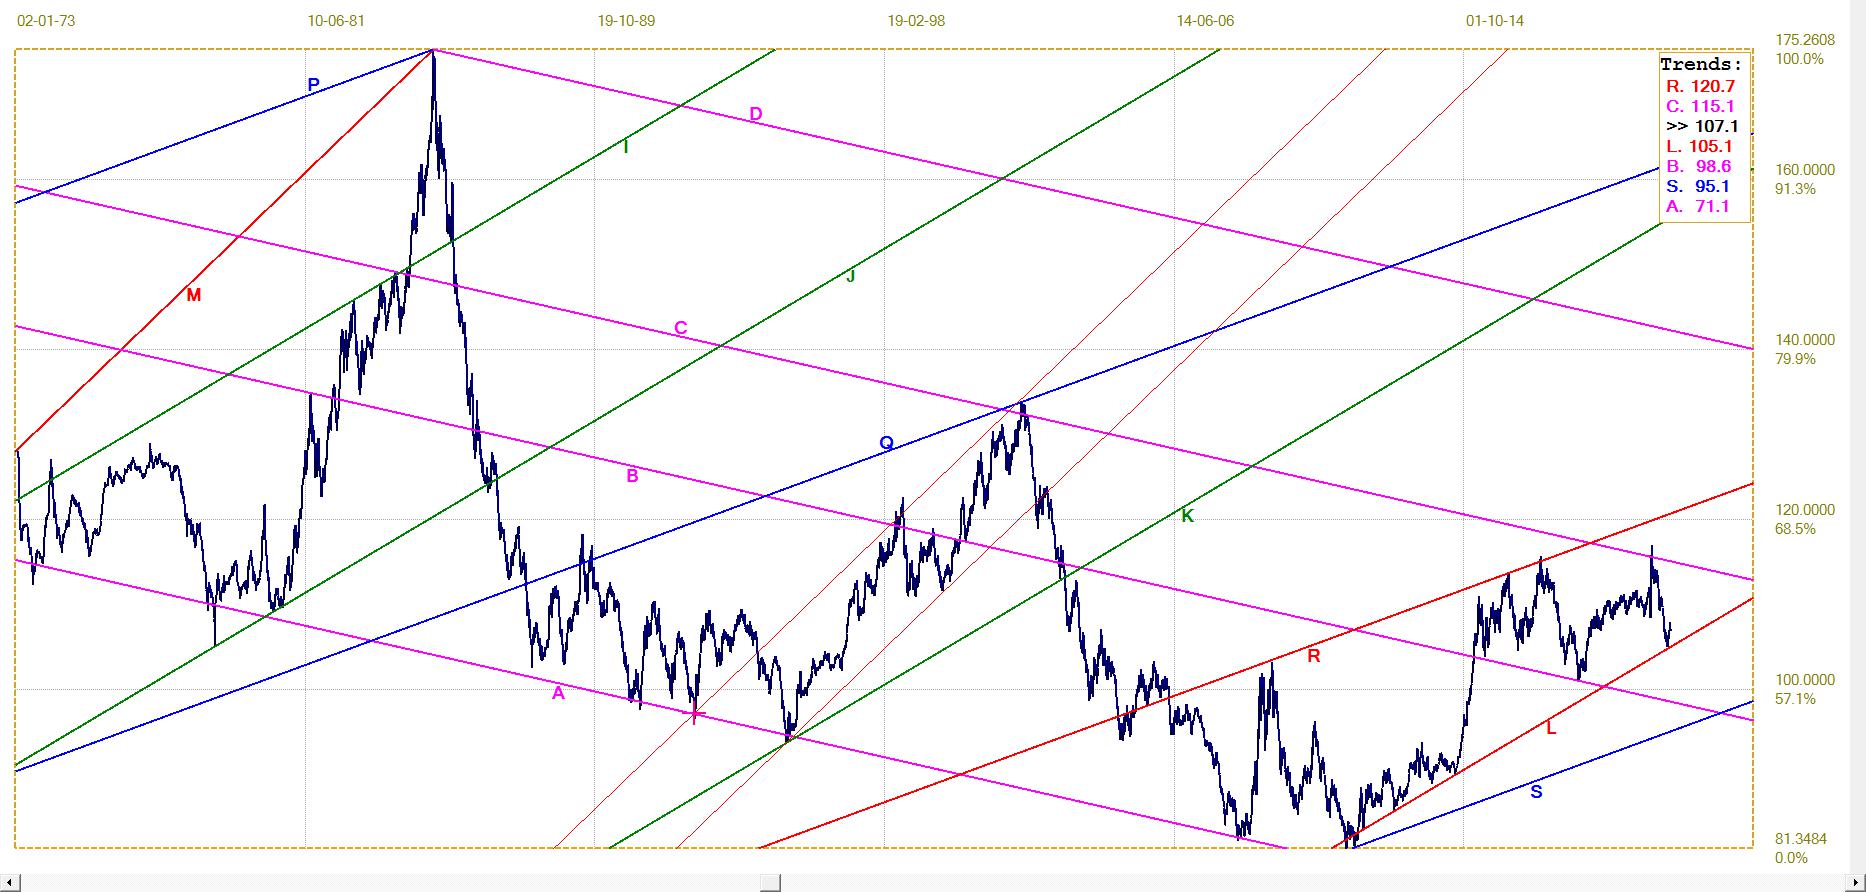
US Trade weighted index Daily – Jan 1973 to October 2020 (normalised)
Master gradient, M, from which all other trend lines are derived, is defined between the first data point of the time series and its all time high – a definition that when it was used for many other long term time series consistently delivered good results.
There are three channel systems on the chart: ABCD, IJKL, PQRS, each of which consists of four trend lines and therefore contains two channel pairs. All six channel pairs have known ratios, five of which are close to the Fibonacci ratio (382:618), with channel pair JKL (504:496) being the outlier with the ratio of a broad channel that is divided into two halves.
The rising trend from line A to line Q in the center of the chart lies between two thin red lines, to be not too distracting from the rest of the chart. Technical analysts will consider this a ‘flag’ formation that developed within the dollar bear trend after the all-time high. A flag formation, within a channel that has a direction opposite to the ruling trend, is a continuation formation – the main trend will resume after the price had completed five waves from side to side within the flag channel, which is exactly what did happen.
Flags are less common than pennants, which serve exactly the same purpose as the flag and differ in that their boundaries slope towards each other. They typically also complete five moves from side to side before there is a break to resume the original trend. On rather rare occasions, the price breaks in the required direction without having completed leg four to touch the opposite side of the pennant, or flag.
The pennant between the red lines R and L has just completed leg four. To conform to the pattern, there must be a dollar rally that reaches to line R. Because both these trend lines are members of a larger set with valid channel ratios, they are properly located. That would be a premature break and it often happens with such breaks that the resulting move is both steep and sustained.
The value of line L is 105.1 at the beginning of last week, with the last data for October 2nd. A definite break to below, say, a value of 104 would warn that the dollar is confirming the bear trend. In that case, either line B or line S, with values of 98.6 and 95.1 respectively for last Monday, could be targets for the medium term. If these support levels should fail to hold, a target of below 85 at line A is possible for the longer term.
It has been widely commented since at least May this year that the Cartel is in deep trouble and have been doing all they can since the end of July to get out of as many of their short positions as possible. Since that time, the waterfall attacks happened on multiple occasions on most days, much as before. However, the Cartel surely knows that doing so run the risk of (mostly?) day trading buyers sitting in ambush to pile in at the lower prices, but with a good many longe term bulls also waiting eagerly for bargain prices.
Their solution was to implement a two-tier – and often three-tier – method to their attacks; The price would be pushed lower and then the selling tapers off to allow the price to bounce so that the eager buyers take a bite at the apple – or is it to gobble the bait? As soon as enough new buyers have bought into the market, the real bear attack hits the market, much more intense than the first one. The three Kitco gold intraday charts below are from Monday, 12 October.

The first chart shows the banks were ready and waiting to take the price lower as soon as the market opened in Asia. But the buyers were also ready and waiting to get in right at the open; the price spiked higher, catching the banks unawares. Then the banks mustered their reserves and really depressed the price of gold all the way down to $1922. Between the time of the second chart – with the price just recovering to break $1924 again – and the third chart, to begin the new day, the buyers must have been active for the price to rally higher to $1932. Then the banks struck in earnest, taking the price lower again and doing so again in two waves.
On Friday, the preliminary OI for gold was 559168 and two weeks earlier it was . 559438. For silver the OI was 159110 on Friday compared to 153395 two weeks ago. September started with the OI at 547704 and 166449. The gold OI increased during September, while that of silver declined. During the past two weeks, both the metals experienced an increase in OI.
The decline in silver’s OI during September could be because the longs were being squeezed by higher margin calls as prices fell steeply, compelling them to close at least some positions. It is also possible that some banks who wanted to limit their exposure also closed at least some of their short positions while the price of silver was lower than they might ave expected to see. The increase in gold’s OI during this period and that of silver during the past two weeks put the banks between the proverbial rock and a hard place. The metal longs are standing up better against the attacks even when they are forced to close positions as the price of silver fall far. They are also keen to get back into the market when it looks as if the fall is over.
If these speculations happen to be correct, the month of October might still live up to its reputation as a good time for the precious metals – more so if October again turns out to be a crisis month for Wall Street, if the Fed would allow such to happen during the three weeks to go before the election. A bear market ion Wall Street will see many investors and traders switching into alternatives – which includes gold and silver.
Euro–Dollar
The euro recently also began contributing to the weaker trend in the trade weighted dollar since late in March after the high volatility when COVID took hold. While the dollar has been bearish since the aborted COVID rally in response to a dollar sell-off in March, the euro only turned bullish three weeks ago – obviously for much of the time conditions in Europe were believed to be worse than in the US.
The euro has gained good ground, but now hast to break clear of the resistance at the top of channel XYZ ($1.1827); then also at lines D ($1.1854) and R ($1.1863) to resume the medium term bull trend.
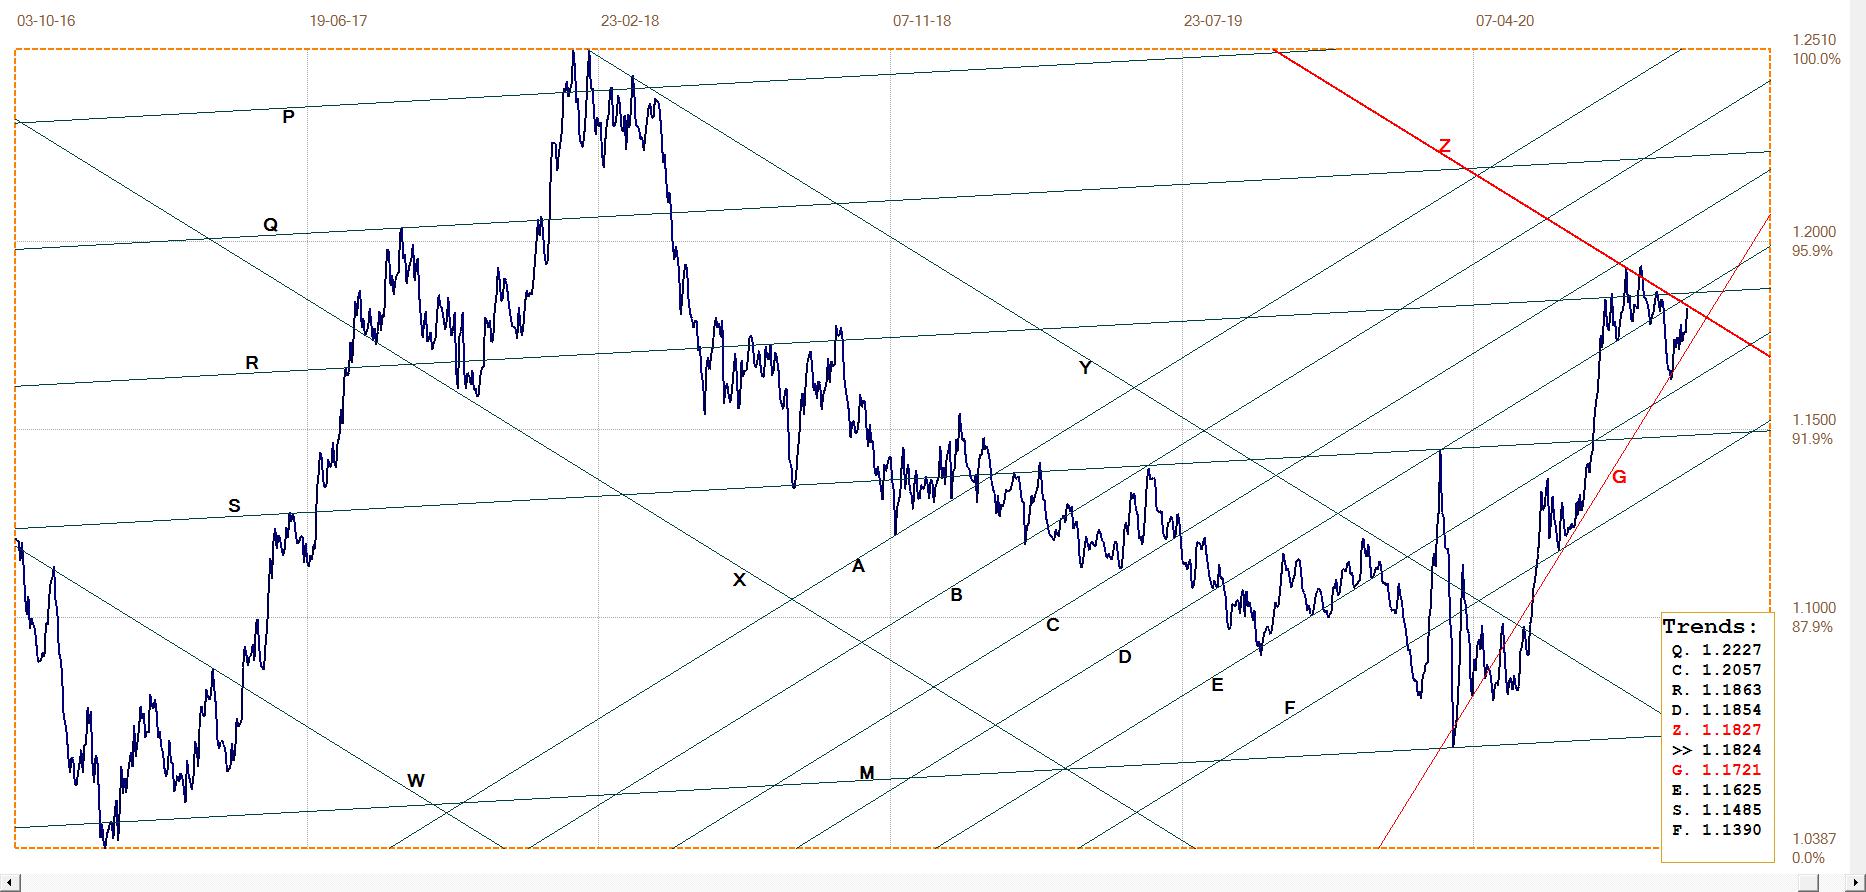
Euro–dollar, last = $1.1824 (www.investing.com)
DJIA Daily close
The DJIA has broken below the medium very steep support of line G to give a bear signal, but then held at rebounded at line T to extend above line A. The new bullish bias still has to confirm at lines U and M to break again above the longer term bull channel. The previous two breaks failed to hold and preceded the steep decline in March.
The sustained effort to give a positive spin to the state of the economy during the next three weeks might run up to against the effects of a potential ‘second COVID wave’, should the increase in the number of COVID cases experienced last week be the start of a trend that holds for some weeks.
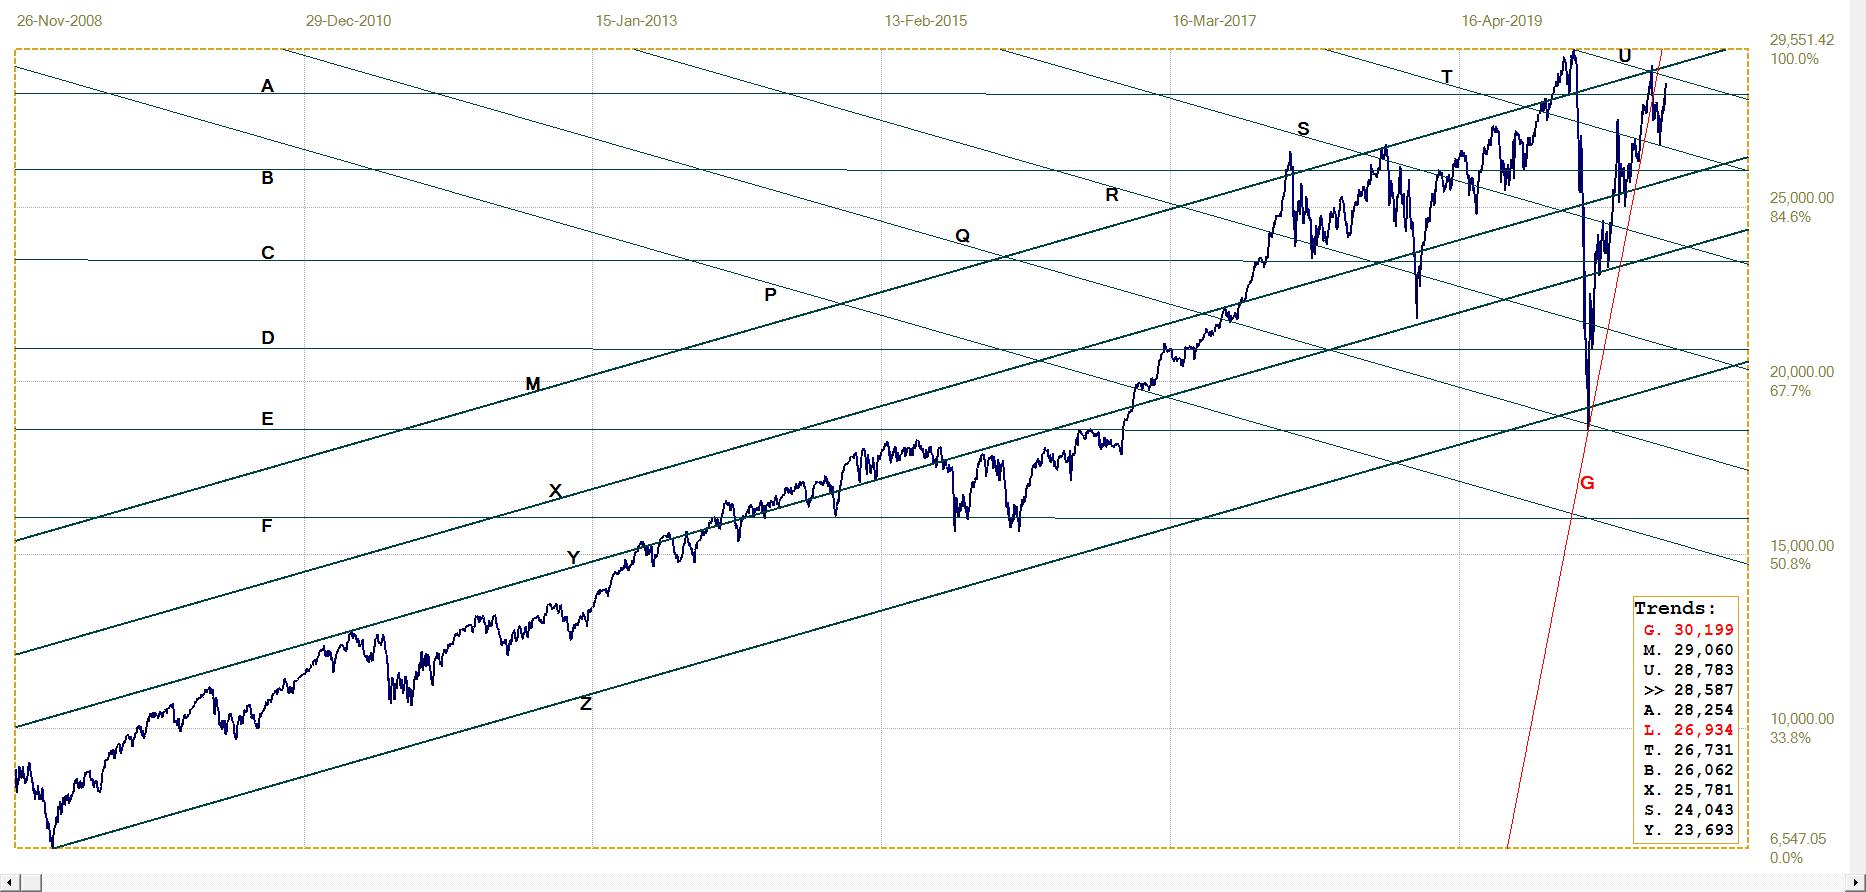
DJIA, last = 28586.90 (money.cnn.com)
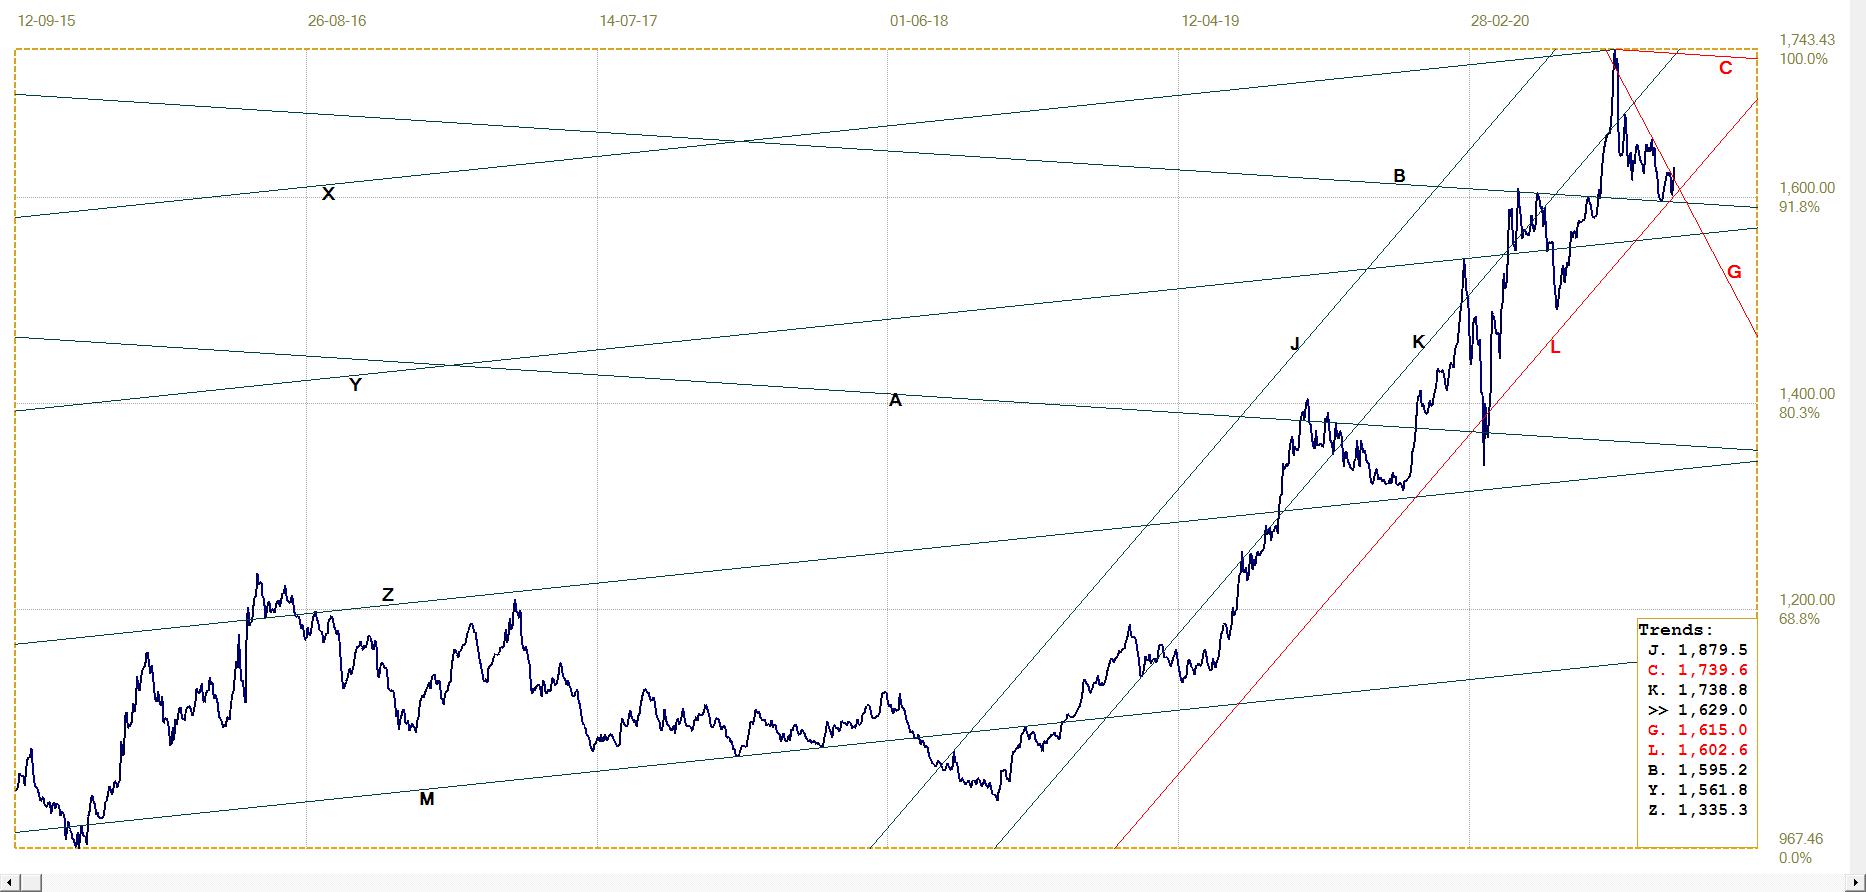
Gold London PM fix – Dollars
Gold failed to hold above line Z ($1879) and spiked lower to be fixed in London at $1853.95; it recovered to line K ($1915), but was again pushed lower, not as low as before. The new rebound ended with the PM fix on Friday at $1923.25 – above line Z again and barely below the steep resistance at line E ($1927).
We now wait for a clear break higher to confirm that the new rally still has legs.
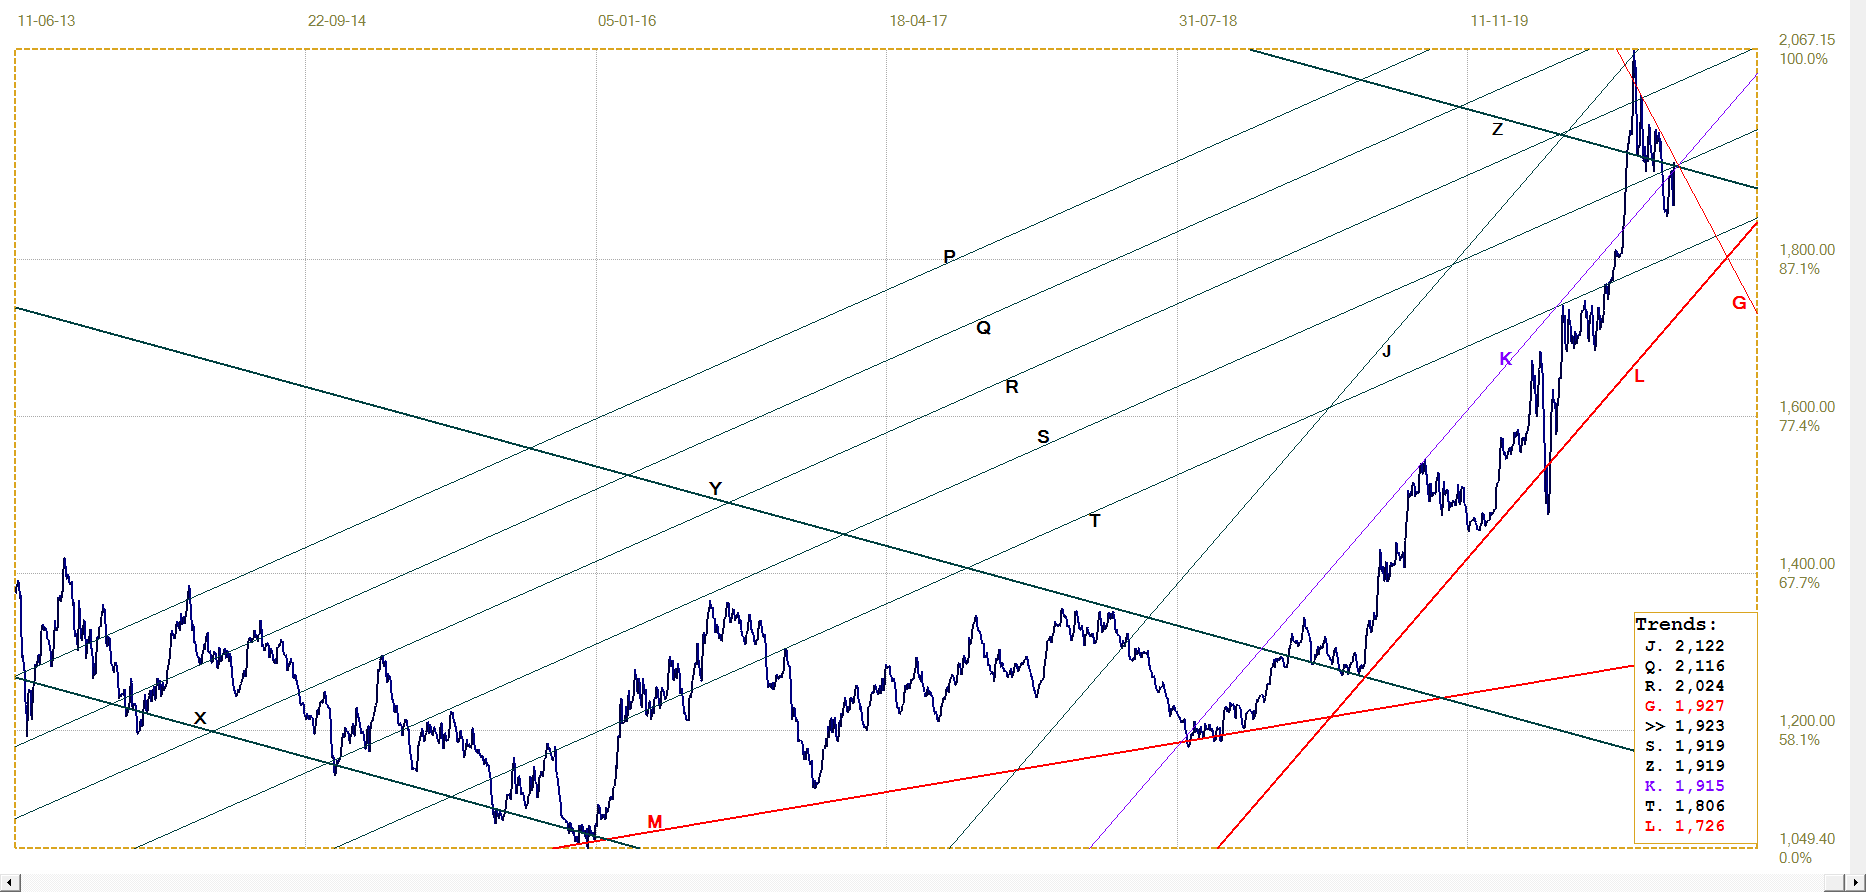
Gold price – London PM fix, last = $1923.25 (www.kitco.com)
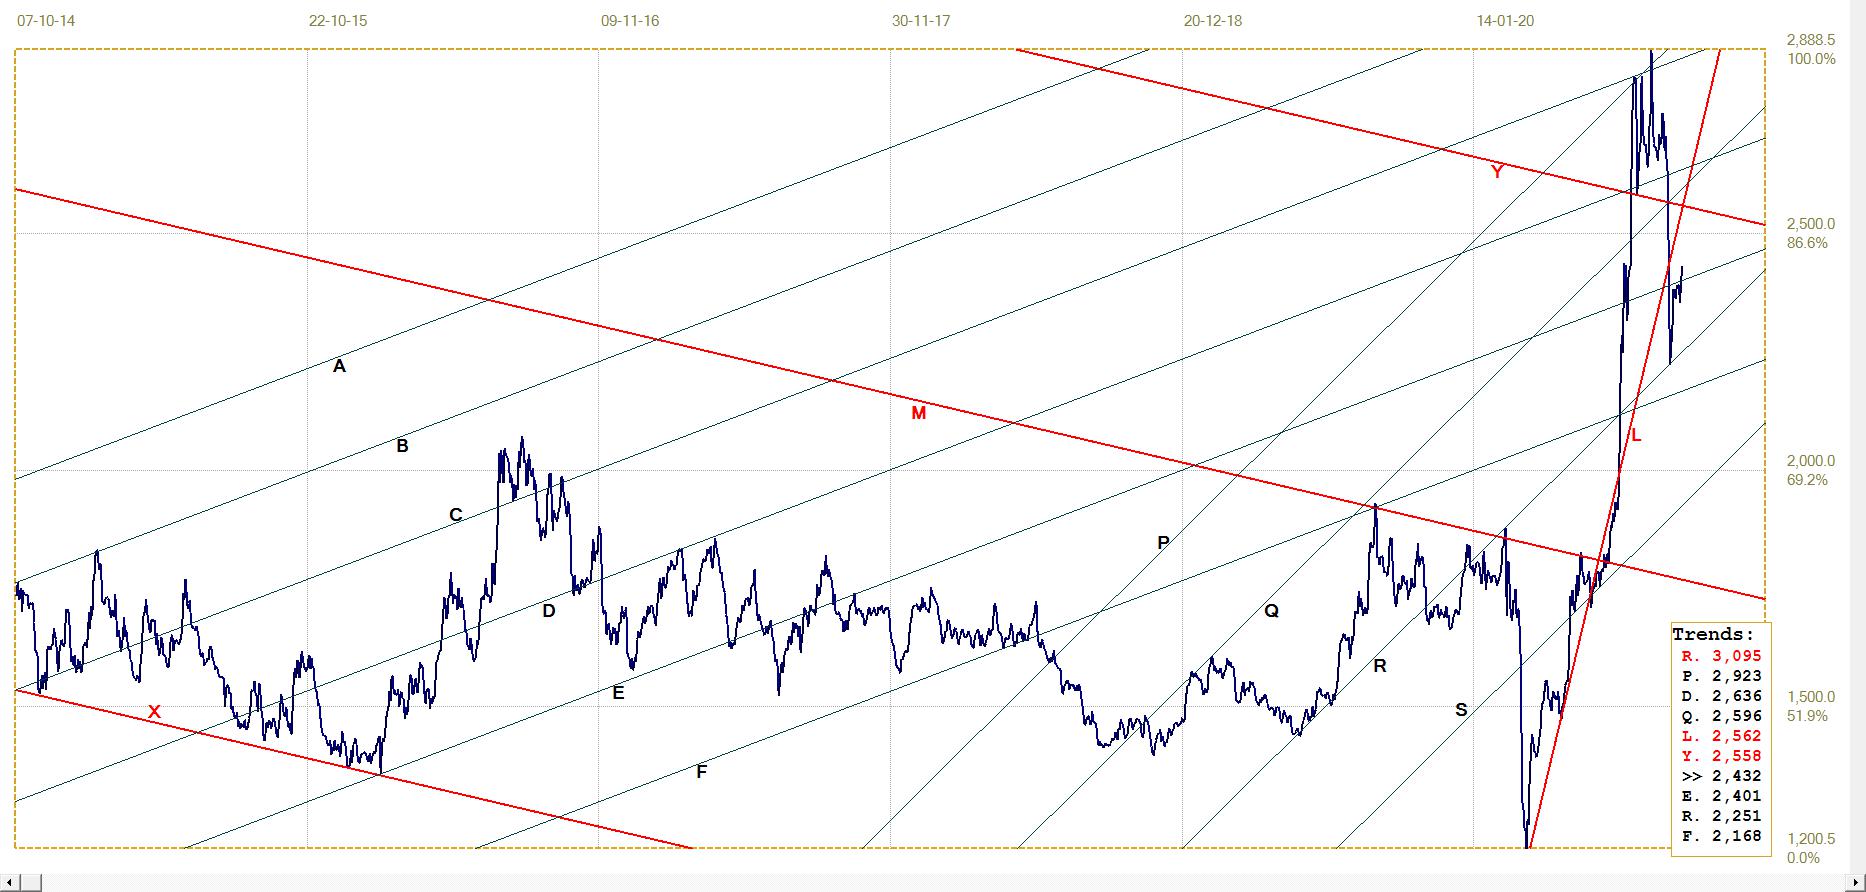
Euro–gold PM fix
Euro gold price – PM fix in Euro, last = €1629.99 (www.kitco.com)
The euro price of gold was being squeezed between support at lines B (€1595) and L (€1602) and resistance at line G (€1615) and has broken marginally above line G with Friday’s pm fix. This happened while the euro was firmer against the dollar. Perhaps the inherent strength of the price of gold will be sufficient to effect a break higher in both dollar and euro gold.
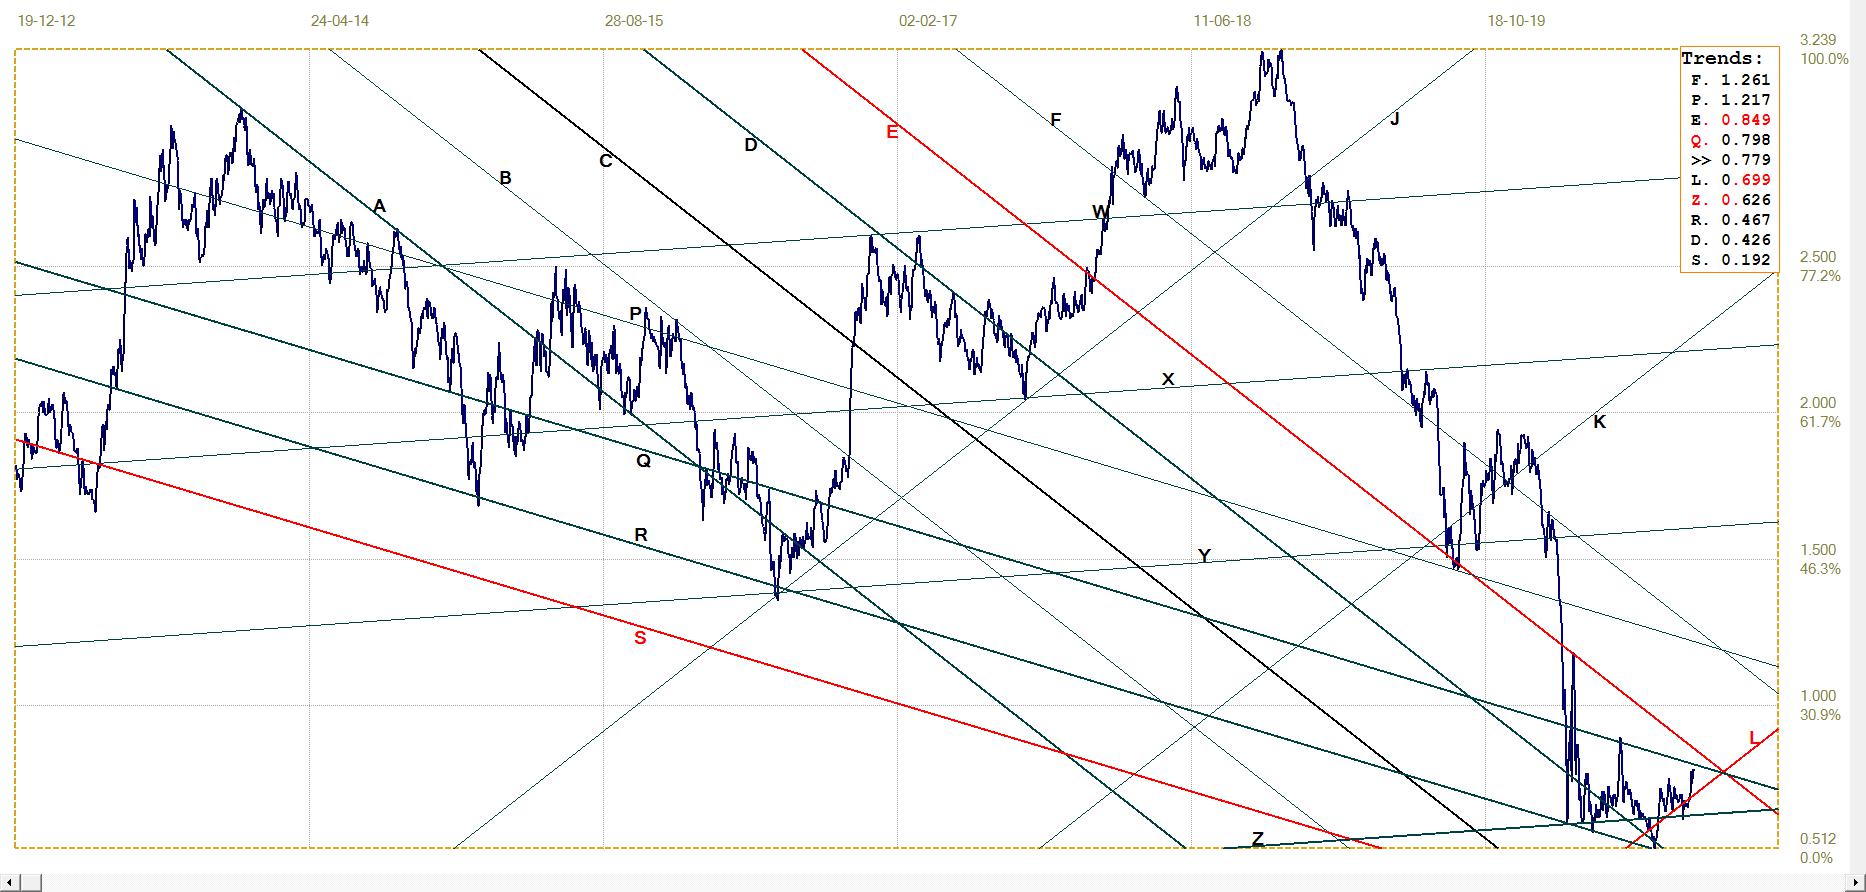
Silver Daily London Fix
Poor silver, as (mostly) always, has been more depressed than gold, finally finding support at the bottom of channel QR. While dollar gold has recovered to support at the level of earlier consolidation and euro gold has held above key support and is close to breaking above resistance, the price of silver by Friday’s London fix rallied less than half to where it had broken below key support at line Y ($25.96). At the time of writing – on Monday, after having being without electricity for all of Sunday until late the evening – silver has been holding above $25 since late on Friday and it might even challenge line Y later today at the London silver fix.
Silver daily London fix, last = $24.315 (www.kitco.com)
U.S. 10–year Treasury Note
The yield on the US 19-year Treasury note ended last week with a small increase to take to barely below resistance at line Q (0.798%) where it held since Wednesday. The prices of bonds at these levels of yield, mostly well below their coupons, are as stellar as the indices on Wall Street.
As discussed last week, this implies the bonds are sensitive for any sign of inflation – the official version, at least. We are all living as in the fable of the Emperor’s New Clothes after his new tailor made him an outfit that could not be seen or felt, but was mos impressive. When he appeared naked in public for the first time, all of his sycophants exclaimed in praise of his magnificent clothes and lauded the skill and craft of his new tailor. In the same way economist, employers and commentators on the markets accept that the official CPI serves just as well as a cost of living index for the increases given to employees of all levels.
What will happen when it is no longer possible to ‘dress the CPI in new clothes’ and it becomes clear to not only the few with clear eyes and open minds that inflation has taken off for much higher numbers, is anyone’s guess. And not only for the US Treasuries. The panic reaction will spread faster than the infection of COVID!
U.S. 10–year Treasury note, last = 0.779% (www.investing.com )
West Texas Intermediate crude. Daily close
The price of crude turned a little lower off resistance at line Q ($41.56) but it then turned sideways off support along line G ($37.44). Clearly, a sustained resurgence in economic activity will have a bullish effect on the price of energy. On the other hand, sustained rhetoric about how strong the economy is, how close soon the V-bottom will complete to have everyone back at work make it difficult to short oil.
As with so much else, one should not expect too much to happen during the next two weeks until the election happens; or for the next few months while we all wait for a final result.
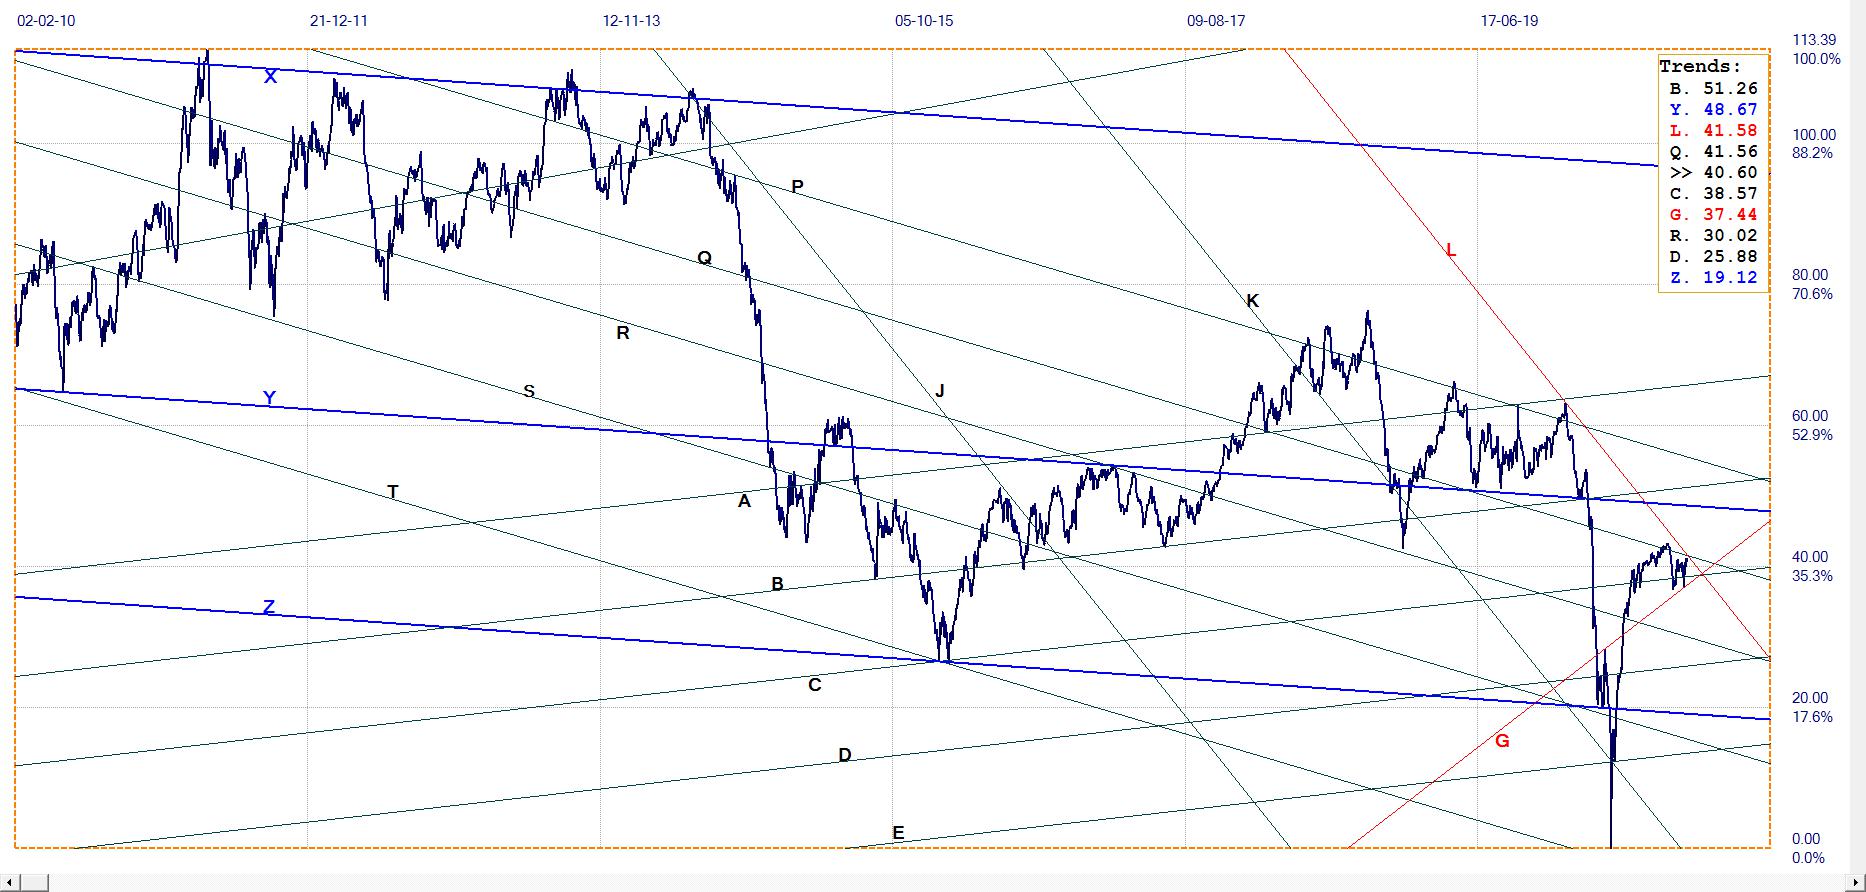
WTI crude – Daily close, last = $40.60 (www.investing.com )
© 2020 daan joubert
********


