Why A Strong Dollar Isn't A Death Sentence For The Gold Price


Summary
- Dollar strength is keeping gold stuck in its lateral trading range.
- Yet, gold's currency component is no longer a seriously limiting factor.
- Gold's multi-year high suggests the establishment of a new bull market.
After a failed breakout attempt, the price of gold has fallen back into the holding pattern which was established last month. While it may be frustrating for some investors that gold remains locked in a tight trading range, the lack of forward progress in recent weeks has actually done the market some favors. For one thing, it has cooled off the excess heat generated by its June rally. It has also allowed the bulls to consolidate their control over gold’s dominant intermediate-term (3-6 month) trend.
In today’s report, I’ll argue that the longer gold remains in this holding pattern, it increases its chances for another surge higher later this summer when the metal’s historically bullish seasonal tendencies kick in. I’ll further make the case that recent strength in the U.S. dollar is no longer a major concern for longer-term gold investors.
It’s imperative for investors to never lose sight of the big picture outlook for gold. Even if your trading time frame is abbreviated, a periodic glance at the long-term charts is a useful exercise for putting gold’s short-term moves into perspective. Below is a graph of gold’s performance in just the last few months. This chart shows in detail the 11% rally in the metal’s price following a sluggish period of underperformance earlier this spring.
It should be noted that the gold price closed slightly under its 15-day moving average on July 25, the first time that gold’s immediate-term trendline has been violated in this fashion since the rally began two months ago. Normally, I would consider a close below the 15-day MA after such a steep run-up in the gold price as a break in the immediate-term (1-4 week) trend. However, the violation of the 15-day MA was slight enough to where we can extend the benefit of the doubt to gold. But if gold closes decisively under the 15-day MA on Friday, July 26, it will constitute the first weekly close beneath this important trendline since May. This in turn would signal that gold’s strength is beginning to be sapped by the stronger U.S. dollar.
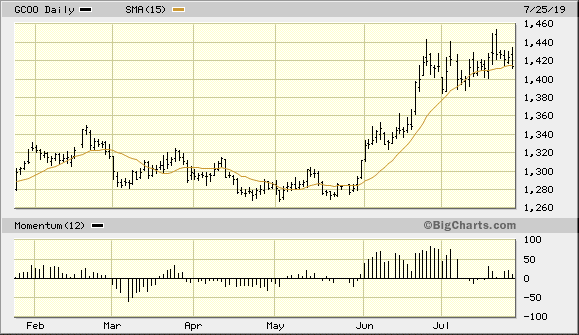
Source: BigCharts
But would a violation of the 15-day moving average necessarily give the bears control over gold? I would answer no, for the longer-term trend as evidenced in the following graph shows that gold still enjoys a large degree of forward momentum and strong safe-haven demand. Here you can see gold from a longer-term perspective, and the upward progress of the metal’s price since the late 2016 price low is impressive. In breaking out decisively above the $1,360 level this summer, gold has managed a feat which it hasn’t been able to accomplish since its last major peak in 2011. Specifically, gold has now established a pattern of higher highs over a 3-year period.
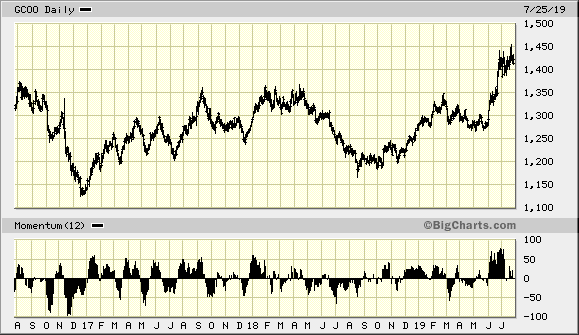
Source: BigCharts
This implies that investors are no longer justified in assuming a worst-case scenario for gold every time it encounters price weakness in the immediate term. Thus, gold’s latest pullback into its multi-week trading range isn’t a death sentence for the metal. It likely represents a continuation of its consolidation phase since late June, or a “pause that refreshes” to use the colloquial term. The main point I’m driving at here is that temporary weakness in gold’s currency component need not distress gold investors. For it’s clear that gold has established a new long-term bull market, and it should survive those periodic U.S. dollar rallies with its upward trend intact.
Speaking of the dollar, let’s take a glance at what’s happening in the greenback. The following graph shows the Invesco DB USD Bullish ETF (UUP), which is my favorite dollar-tracking ETF. I’ve found that UUP often leads the dollar index (DXY), thus the latest rally to new highs in UUP can be regarded as instructive for DXY. While the actual U.S. dollar index hasn’t yet established a new high for the year, the latest rally in the UUP price line suggests that DXY will soon follow suit.
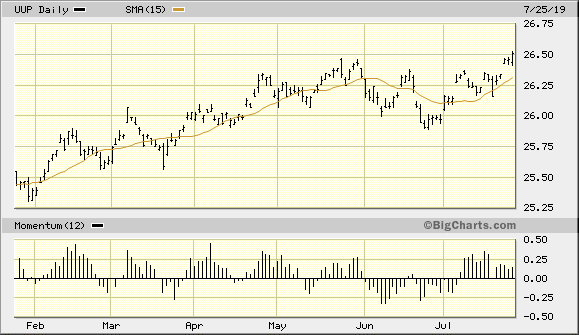
Source: BigCharts
The most important takeaway from the above chart is that with the dollar ETF surging higher, gold is now faced with a fairly serious short-term impediment. Gold’s currency component is now weaker, and this will likely keep the gold price locked in the above mentioned lateral trading range for a while longer.
The dollar’s strength at this point can no longer be regarded as simply safety-related demand. Other foreign currencies which usually rally when investors fear for their safety – including the Swiss franc and the Japanese yen – have shown some weakness lately. Meanwhile, U.S. high-yield corporate debt (i.e. junk bonds) haven’t been subject to selling pressure of late. This can be seen in the SPDR Bloomberg Barclays High Yield Bond ETF (JNK) below. Normally in times of financial market distress, junk bonds are one of the first asset categories to be liquidated in anticipation of future market volatility.
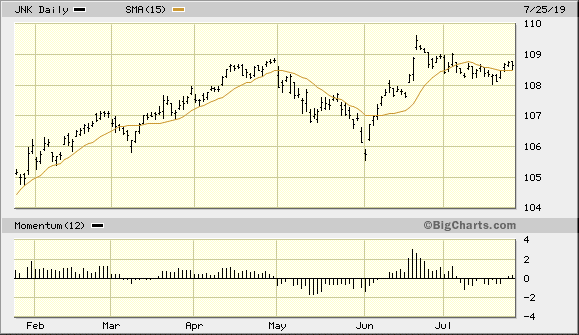
Source: BigCharts
Yet, junk bonds, along with U.S. equities, are still in demand right now. There’s a certain degree of fear and uncertainty among investors this summer, especially as it concerns the U.S.-China trade outlook. This fear in part accounts for gold’s safety-related demand of recent months. But the strength in the U.S. equity and corporate debt markets – and the corresponding rally in the U.S. dollar – is also a reflection of the confidence that investors have in the U.S. economy. The dollar’s strength, in other words, can be viewed as a sign that investors believe the U.S. economy will survive this year’s global economic volatility with its upward trend intact.
So while gold’s long-term rebound won’t be seriously threatened by the dollar, periodic short-term rallies in the dollar index will serve as a temporary headwind for the metal. Now is one of those times, and I recommend that investors accordingly hold off on initiating any new purchases in gold until the dollar index pulls back. Longer-term positions in gold and gold ETFs can be retained, however, along with intermediate-term (3-6 month) positions in gold mining stocks.
On a strategic note, I’m currently long gold via the VanEck Vectors Gold Miners ETF (GDX). For this ETF, I’m using a level slightly under $26.00 as a stop-loss on an intraday basis. Participants who haven’t done so should also book some profit in GDX after its impressive run of the last few weeks.
Disclosure: I am/we are long GDX. I wrote this article myself, and it expresses my own opinions. I am not receiving compensation for it (other than from Seeking Alpha). I have no business relationship with any company whose stock is mentioned in this article.
********
More from Gold-Eagle


