Will It Be A Bang Or A Whimper?


The first week of October is history and the DJIA closed all of 11 points lower than it did the week before. As we well know, statistics can be deceptive. The 11 point change in the DJIA over the full week conceals the fact that the DJIA futures ranged between an intra-week high at 26982 and a low of 26328 for a swing of 654 points – and large parts of that range were covered twice. It was again evident from intra- day trading that the market was not being allowed to enter full bear mode. Yet, if the reason for the wild performance really is the break above 3% of the yield on the US 10-year Treasury, the forces working hard at holding up Wall Street must be facing a losing battle. Perhaps even in October.
In historical terms, 3% is quite on the low side as interest rates go, but it is more than twice the yield of 1.358% at the low point in mid 2016. It was mostly below 2.5% from 2014 to early 2018. While a jump above 3% might not be a stretch, the load of debt carried by all sectors of the economy is much larger today that it was four years ago or ten years ago at the time of the Crisis and 3% by all accounts is not going to be a ceiling, but a warning the rising trend is in place. The 20% higher cost of debt since 2014 is not the end of it.
It is widely known and mostly accepted that with the rage for passive investing and the concentration of investor funds in the FAANGs, Wall Street has become more vulnerable to a selling panic in which most potential buyers are trapped at the exit and with not enough funds to help halt the rush. Link to that the belief already 30 at least years old that when Wall Street is a bit shaky a drop on Thursday followed by another one of some size on Friday is a portent that Monday could see fireworks of the wrong kind.
That was the case early in September, when the stock market was not open on the Monday after two down days, but started the Tuesday very deep in the red as if on the way to a much lower close. The close on the Friday was at 25965 and the early low on the Tuesday was 25806, 159 points down from the close. That was as far as she was allowed to go. The recovery commenced to reach a high of 25972, with a close at 25952. Will it be the same on Monday this week, or is there going to be a new scenario that unfolds – one that confirms that the Bear is back?
The pressure to hold Wall Street near current high levels is immense. Trump uses a strong stock market as a sign of his successes while a recent report stated that the situation with state and city pension funds critically depends on the gains the funds have made with investments in equities – the only game in town that delivers. The reaction of current and future pensioners when their pension funds go deeper under actuarial water could become difficult to control, with their fingers being collectively pointed at government as the guilty party. Something that simply must not happen in the month before the midterm elections. Monday should be interesting – either a bang or a whimper or perhaps even a small miracle.
The situation of the precious metals has been anomalous for decades. With trading volumes and even open interest at extreme levels compared to annual production volumes, they spike out relative to other commodities – with little or no attention being paid to normal position limits that apply to commodity futures. Silver is the more extreme of the two, in terms of the suppression since 2011 as well as its ever large open interest.
The hopes of precious metal bulls for something to trigger a new and sustained bull trend have long been disappointed as every attempt of the prices to rally soon gets hammered back by massive selling. The past few weeks have seen the silver price creeping higher from its low near $14, doing so in fits and starts, but, where in the past such an attack would leave silver sideways near its new lows, the price now is more resilient. It dips when attacked, but then bounces back again. This is welcome new behaviour and would be more so if October could see the rising trend continue to perhaps break above $15 in a new sign of strength.
So far on the face of it October has been quite mild. But there are still three more weeks to go before the final days of the month and much can happen in only a day or two. Political tension will increase as the elections become a reality and when the Democrats are certain to think of things to do as they try to regain some initiative following the Kavanaugh fiasco. October could still become very interesting.
Euro-Dollar
The dollar is still holding strong and the euro is also still with bearish potential after the break below the key support of lines L ($1.1596) and W ($1.1540) to hold in the steep bear channel VW an below line G ($1.1608). At least it is holding above the support of line R ($1.1386) – so far.
Following the reversal higher after the bifurcated low below line M early in 2017, the euro rally broke above line R and briefly above line Q ($1.2169) to fall back to line R, with a brief spike below that trend line. The pattern that developed is the well-known head and shoulders (H&S) formation and the traditional view is that a definite break below the neck line (not shown, but line R will do) will be bearish to the same extend as the distance from the top of the head to the neck line.
The political problems in Europe – primarily the southern Mediterranean countries in opposition to the northern countries led by Germany, who sets the economic rules – have become more intense now that some in the south, led by Italy, contemplate a break with the rest of the EU, either in some aspects such as the currency or even a more complete break such as England might do if they can reach some consensus on what to do. No hard decisions appear to be on the table in Italy, as yet, but the political temperature is rising and sooner rather than later it will come to the boil.
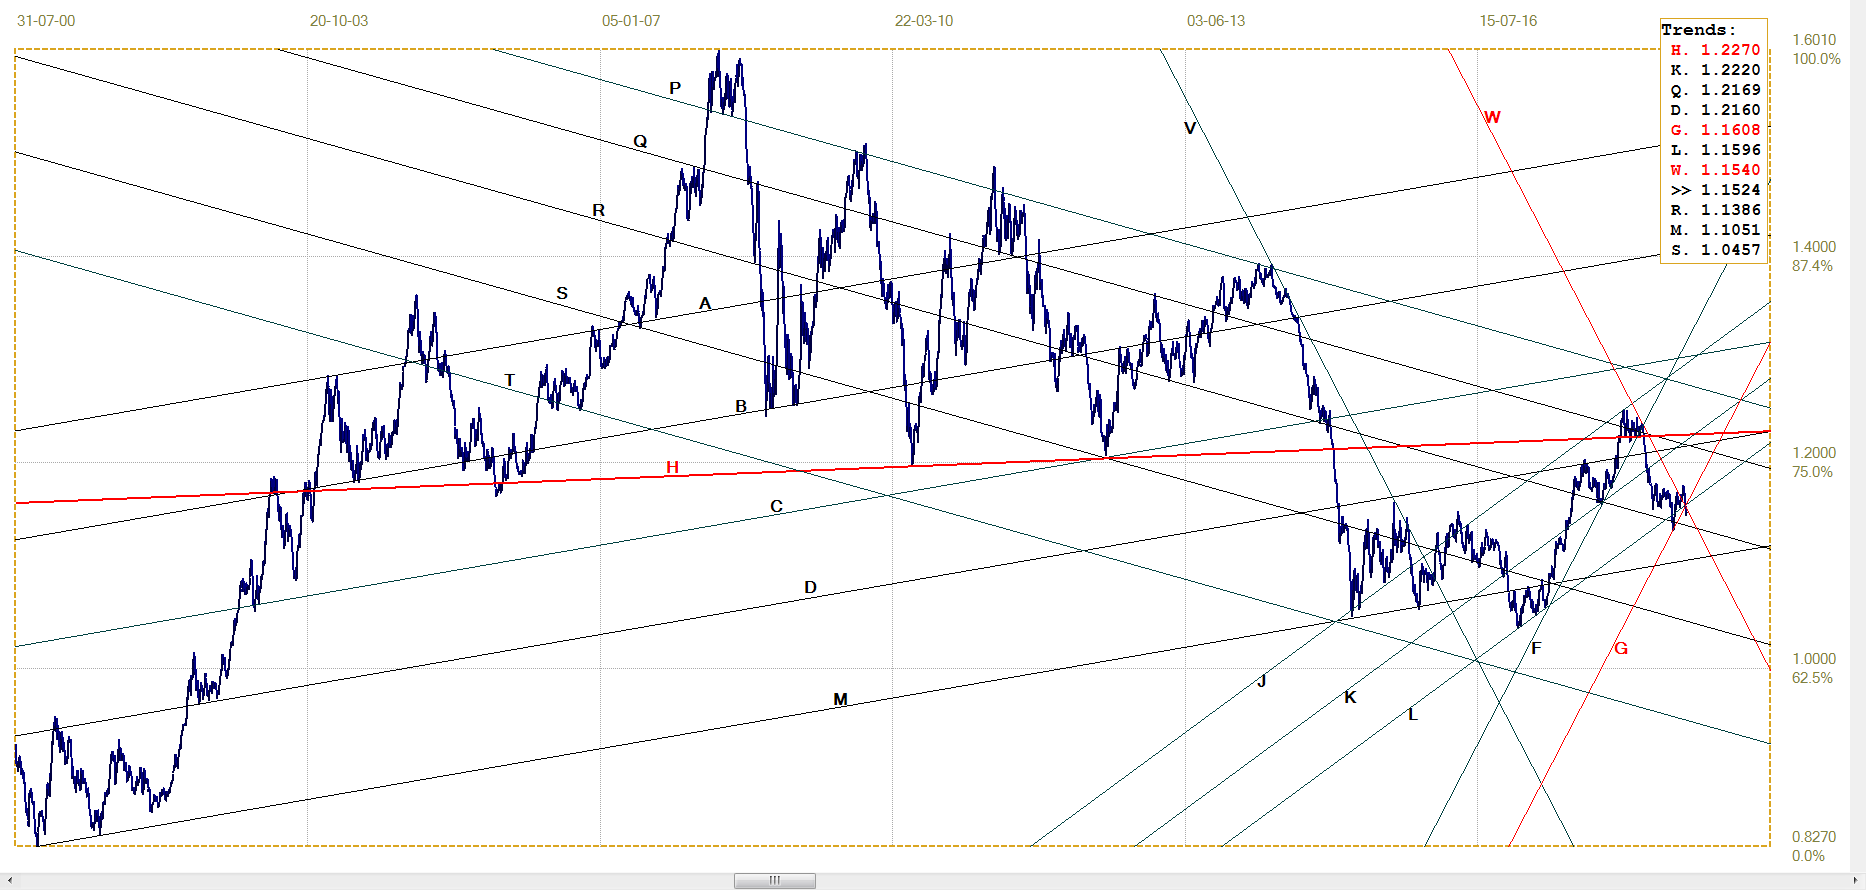
Euro-dollar, last = $1.1524 (www.investing.com)
DJIA
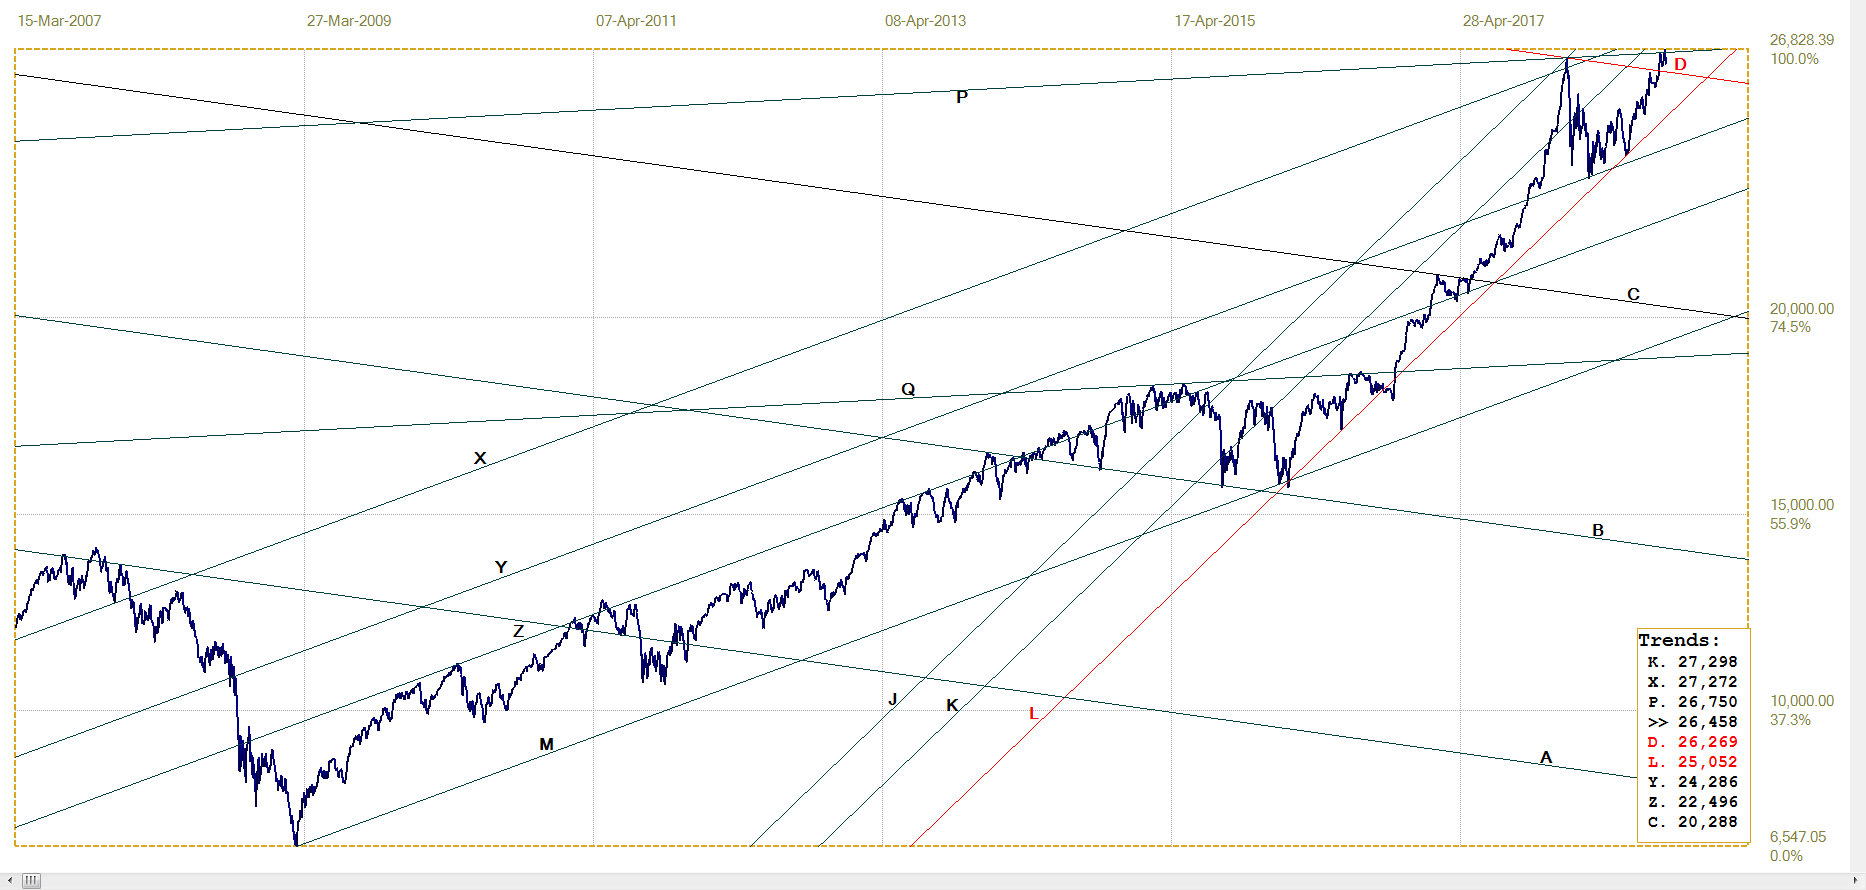
DJIA, last = 26447.05 (money.cnn.com)
Looking at the chart, it appears as if the DJIA is very tightly range bound after it had made a number of new all time highs. As is generally said, appearances can be deceptive. The massive and long lasting bull market since 2009 means the DJIA’s recent tight range of movement is vertically compressed and does not really reflect the volatility as it is being experienced from day to day.
Given all the comments about an overheated stock market, there has to be a good degree of nervousness among investors and fund managers. While they may sound optimistic about the future of the stock market in public pronouncements, joining official spokesmen and economists who also have a vested interest in keeping Wall Street bullish, their risk awareness and responsibilities must have them on edge all the time. They know the first few to arrive at the exit can get out while the market is being supported, as has been happening, can get out safely.
Thereafter it will quickly become more difficult to do so at a reasonable price and a little later it will be next to impossible to get out at almost any price. The more that the market remains tightly range more, the more people will believe it prudent to get out rather than to stay invested in the hope that the bull market can resume.
Gold PM fix - Dollars
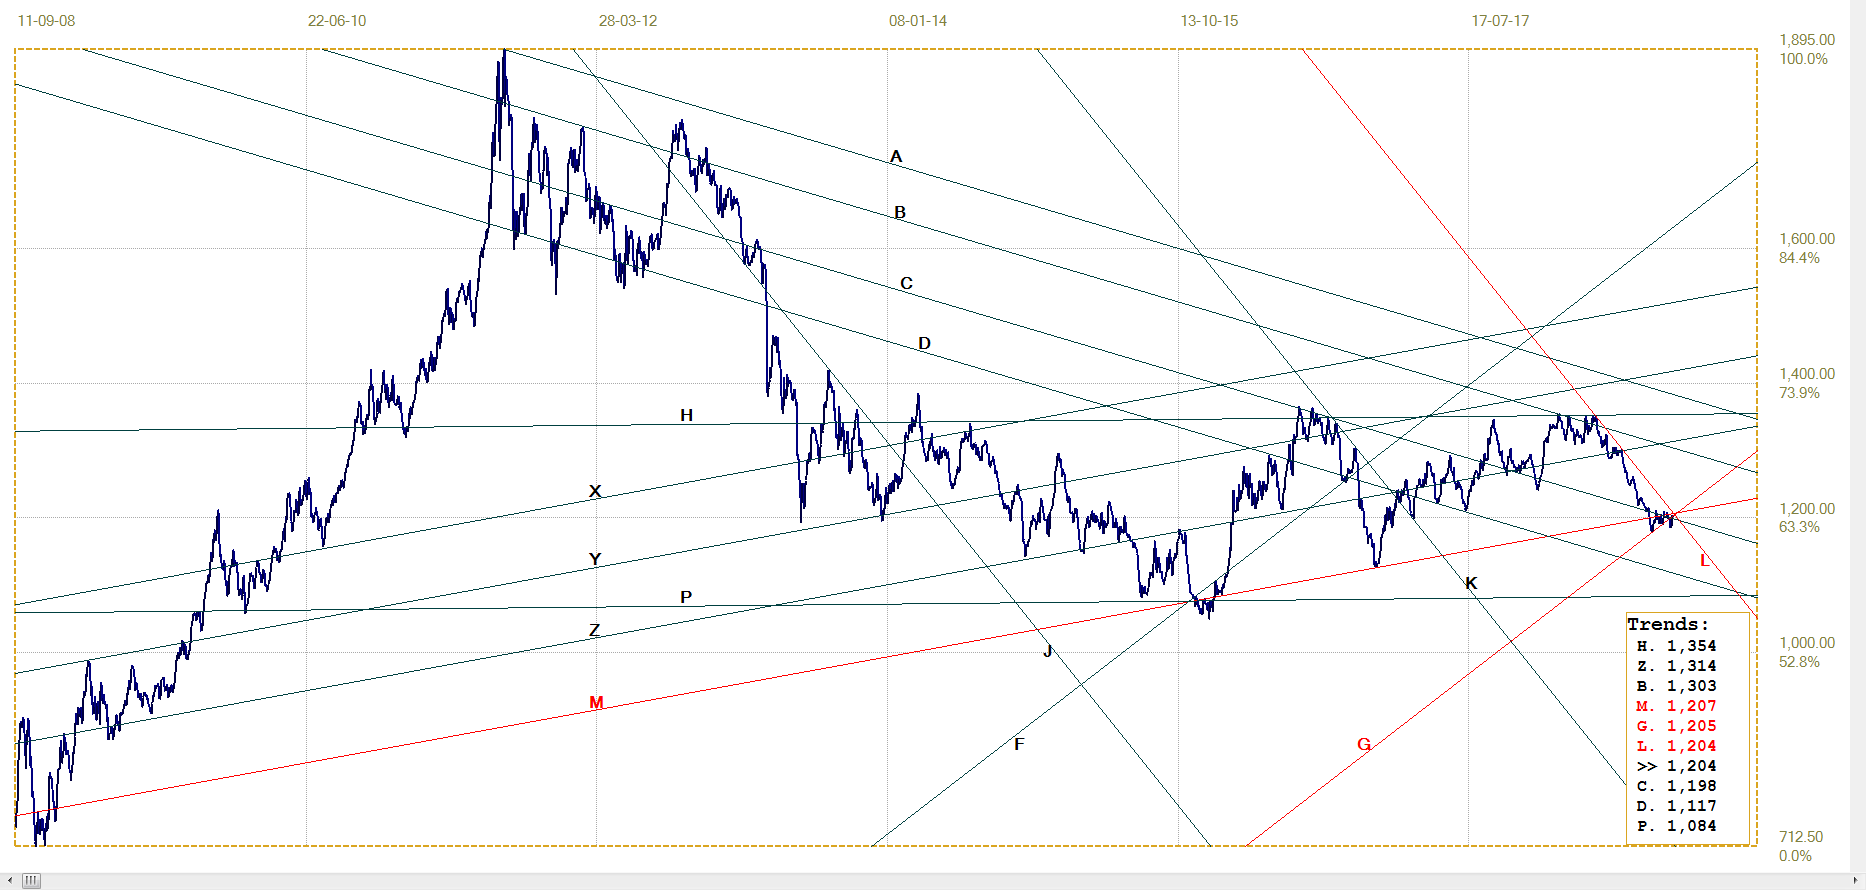
Gold price – London PM fix, last = $1203.80 (www.kitco.com )
The new spike to below lines G ($1205) and C ($1198) has recovered to above line C and the $1200 level, but gold has not been able to extend the recovery to where a new bull market seems imminent. In particular, steep bear channel KL ($1204) is still intact. A definite break clear above this channel is needed to inspire confidence.
Euro-gold PM fix
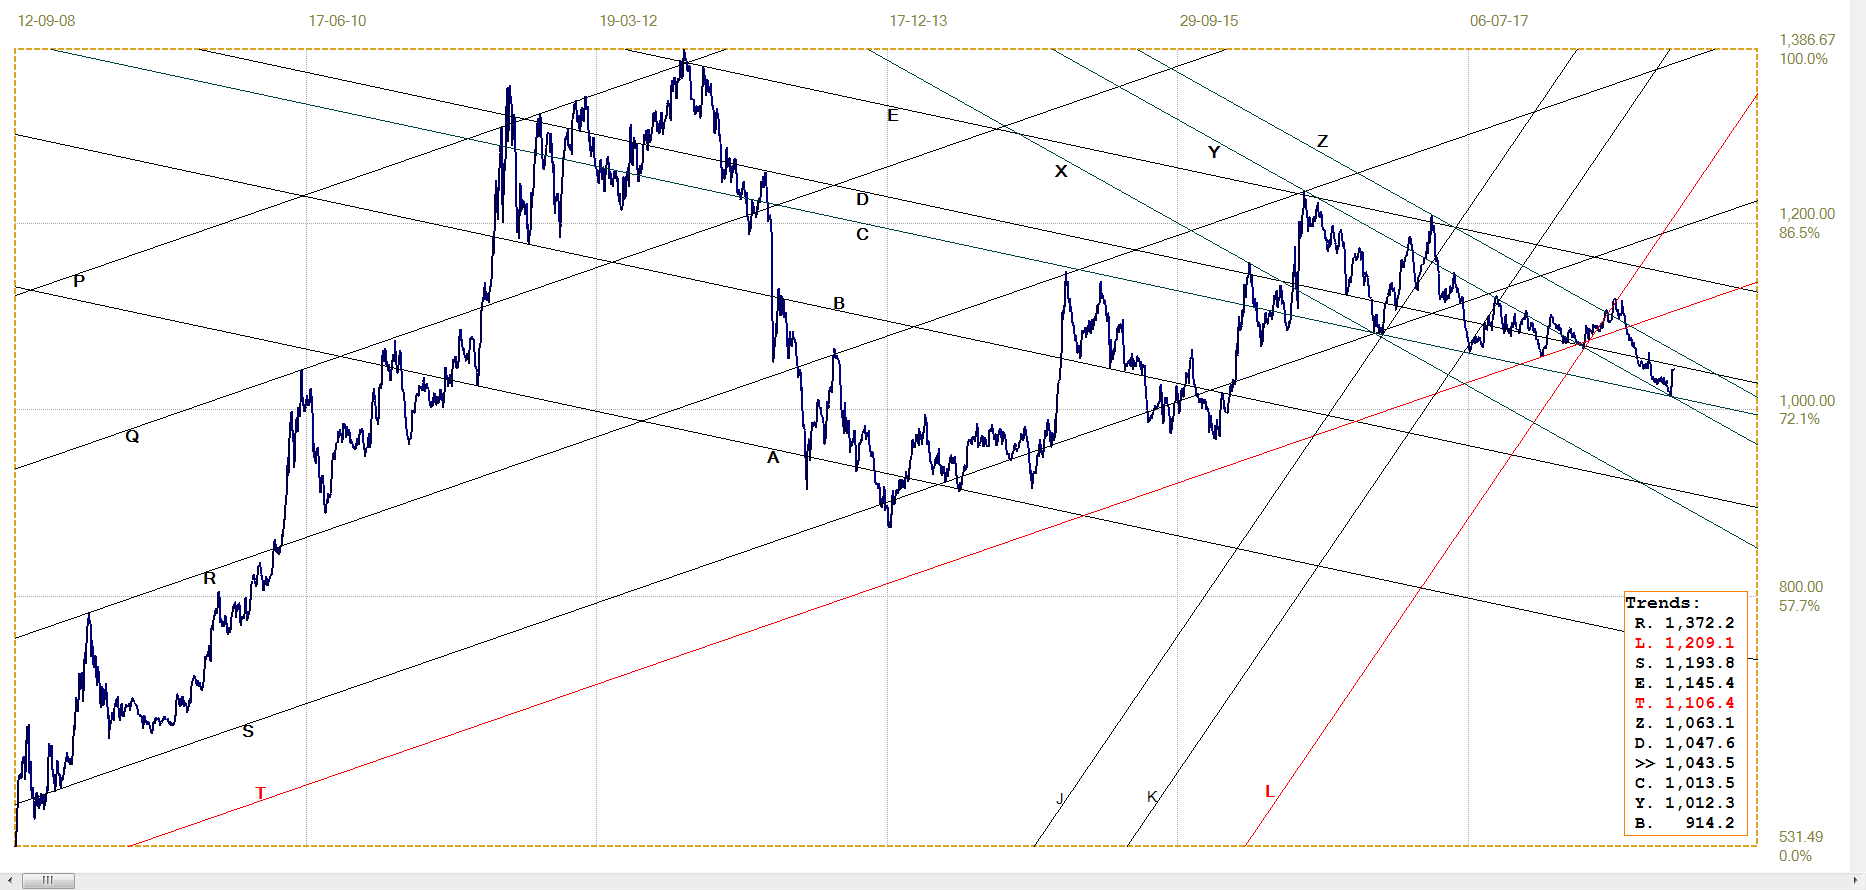
Euro gold price – PM fix in Euro, last = €1043.45 (www.kitco.com)
The euro price of gold appears to have settled in two bear channels CD (€1013) and YZ (1012). A break above channel CD (€1047) would be the first sign of a recovery in the euro price of gold. That could happen either from continued weakness in the euro or from a new rising trend in the price of gold or a combination of the two.
A stronger gold price is almost certain to be associated with a weaker dollar, unless there is some excitement about the short position on Comex that results in a jump in the dollar price of gold. A weaker dollar likely would also rescue the euro, which will counteract the higher dollar price, so that the euro price of gold remains low. A further collapse in the value of the euro, in response to increased political turmoil, may see the euro price of gold breaking higher. Based on history, that would seem to be more likely than a sudden large and sustained jump in the price of gold.
Silver Daily London Fix
As mentioned earlier, silver has been behaving a little out of form recently, showing a bit of sustained strength despite suffering from headwinds when it shows a sign of being bullish. Technically the break above channel YZ ($14.22) is bullish, but the trend has to extend to confirm and may still pull back to line Z or perhaps even line U ($14.12) for a goodbye kiss before the trend higher resumes.
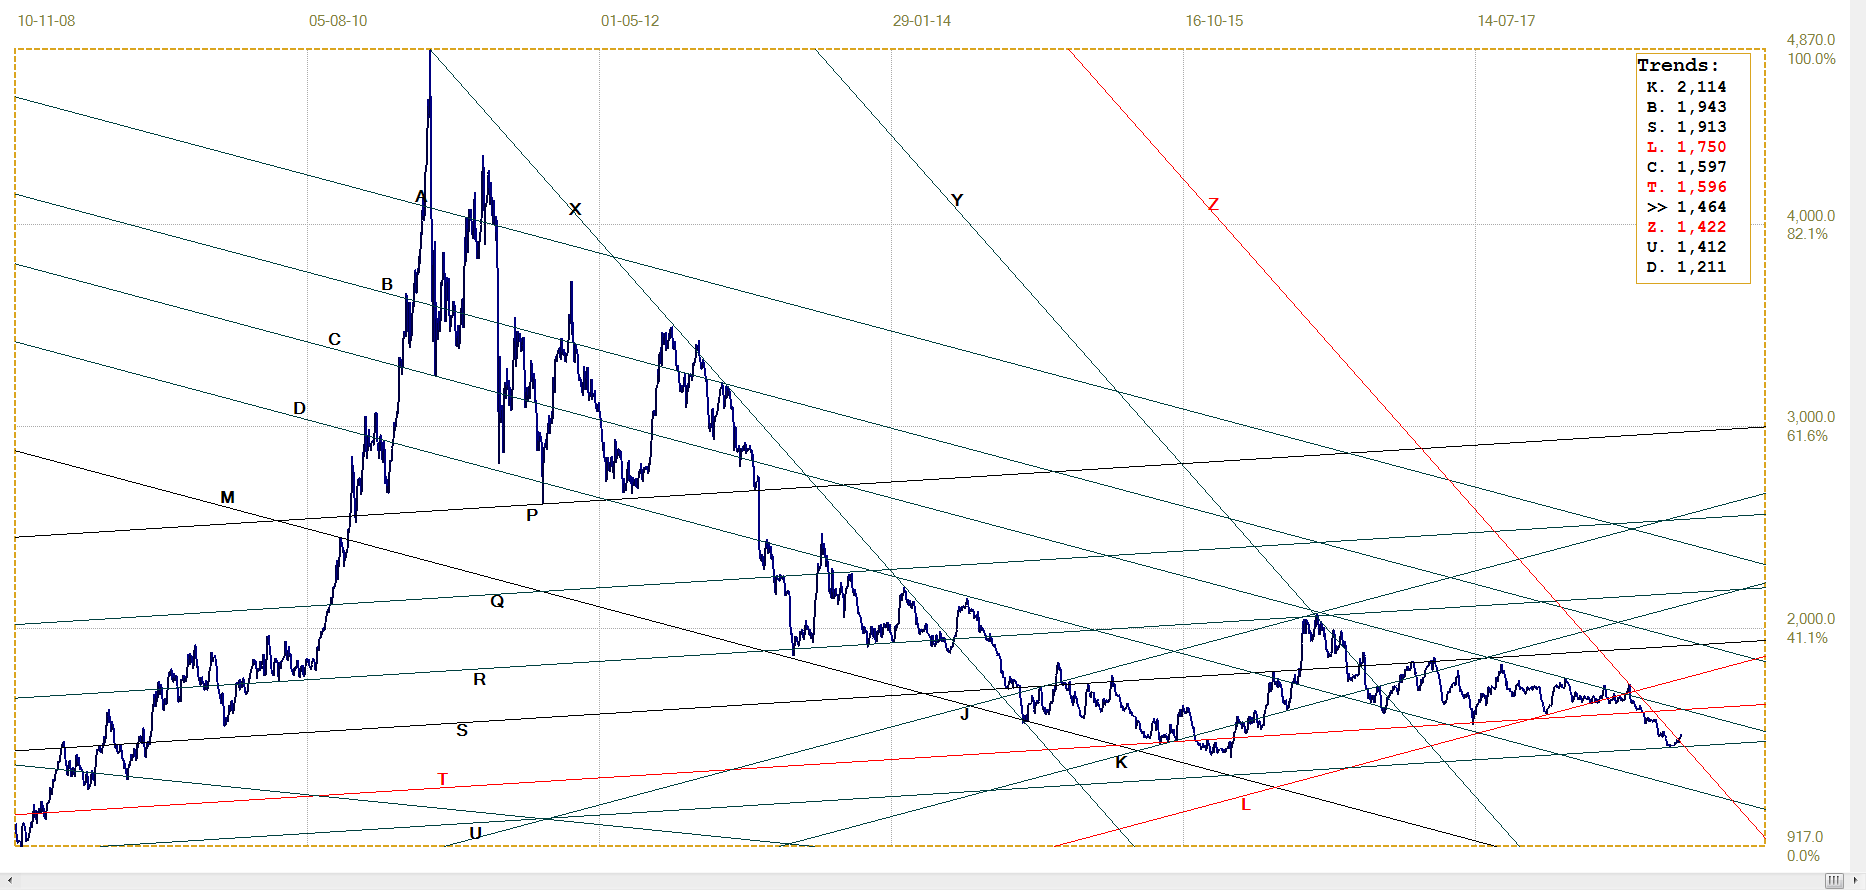
Silver daily London fix, last = $14.635 (www.kitco.com)
U.S. 10-year Treasury Note
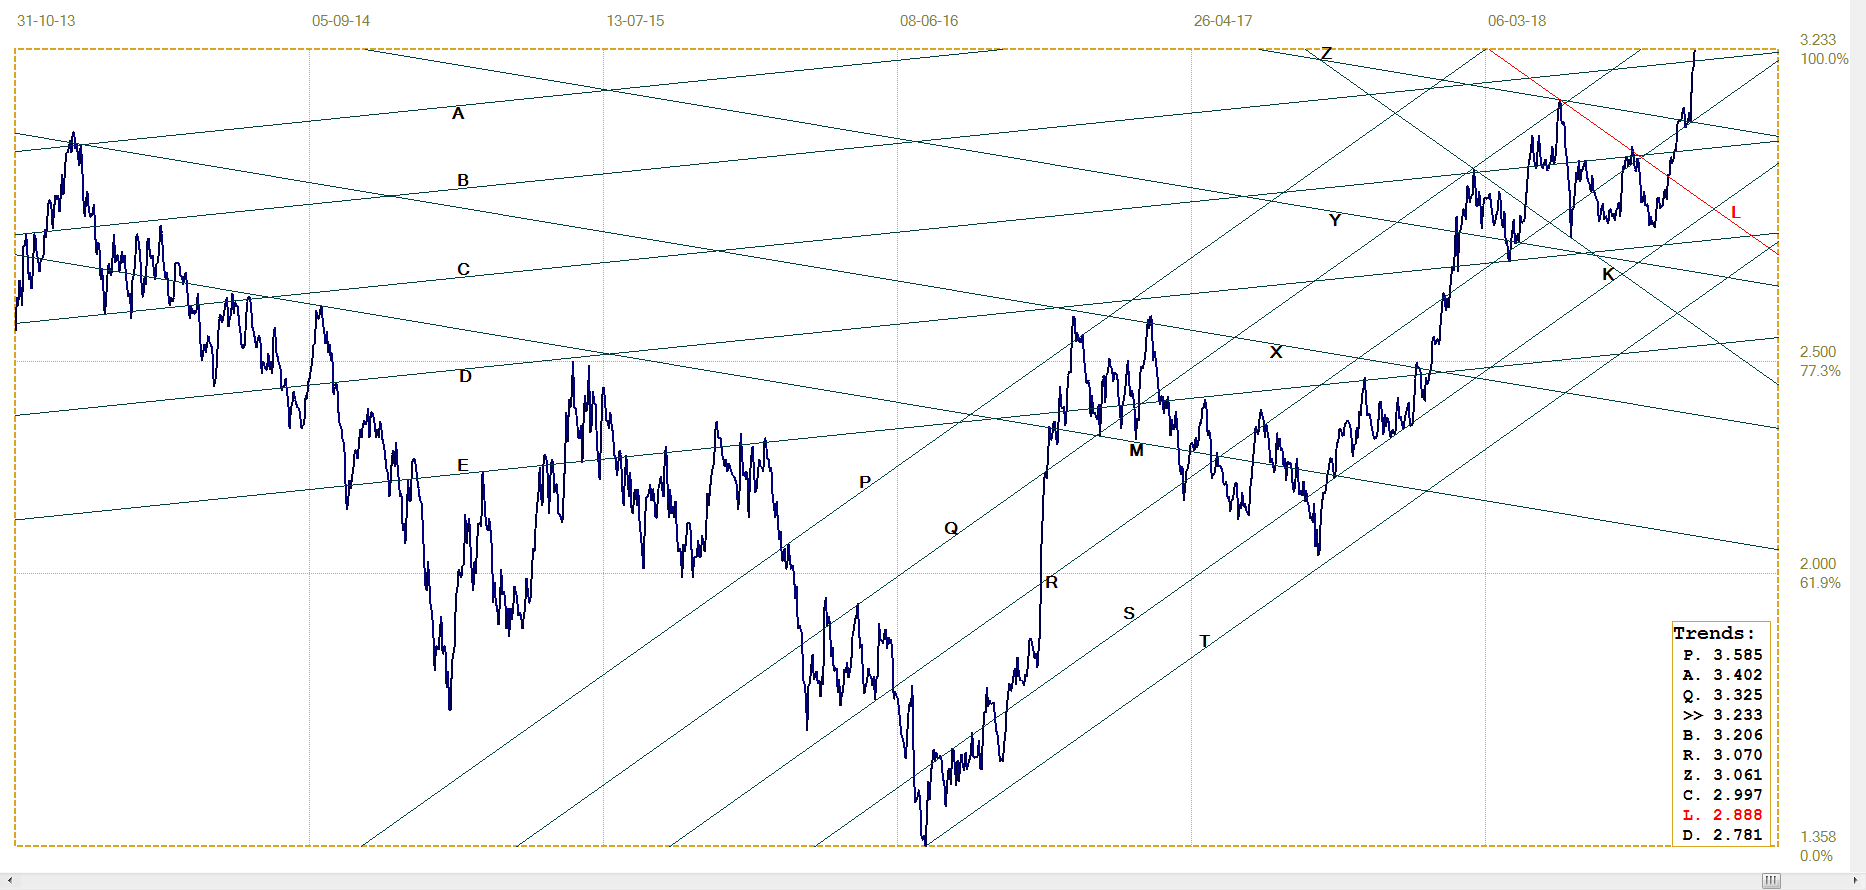
U.S. 10-year Treasury note, last = 3.233% (www.investing.com )
Not only line Z (3.061%) at the top of the recent broad sideways trading band YZ, but also line B (3.206%) were broken last week as the bond market suddenly reacted to changes in the interest rates that had been talked about for months. The delay in extending the bear trend could be based on a belief that the rates will not be lifted because the real economy that nobody speaks about is not as healthy as is being reported. Alternatively, because of a belief that the Fed will listen to Trump to keep rates as they are in order to avoid stalling the improving economy.
Now the reality is that rates are on the increase and for the time being the normal market forces will have a bearish bias as the market adjusts to the changed reality. There is unlikely to be much bullishness in the bond market without intervention – which of course cannot be excluded – and that will be unsustainable and temporary even if it does happen.
West Texas Intermediate crude. Daily close
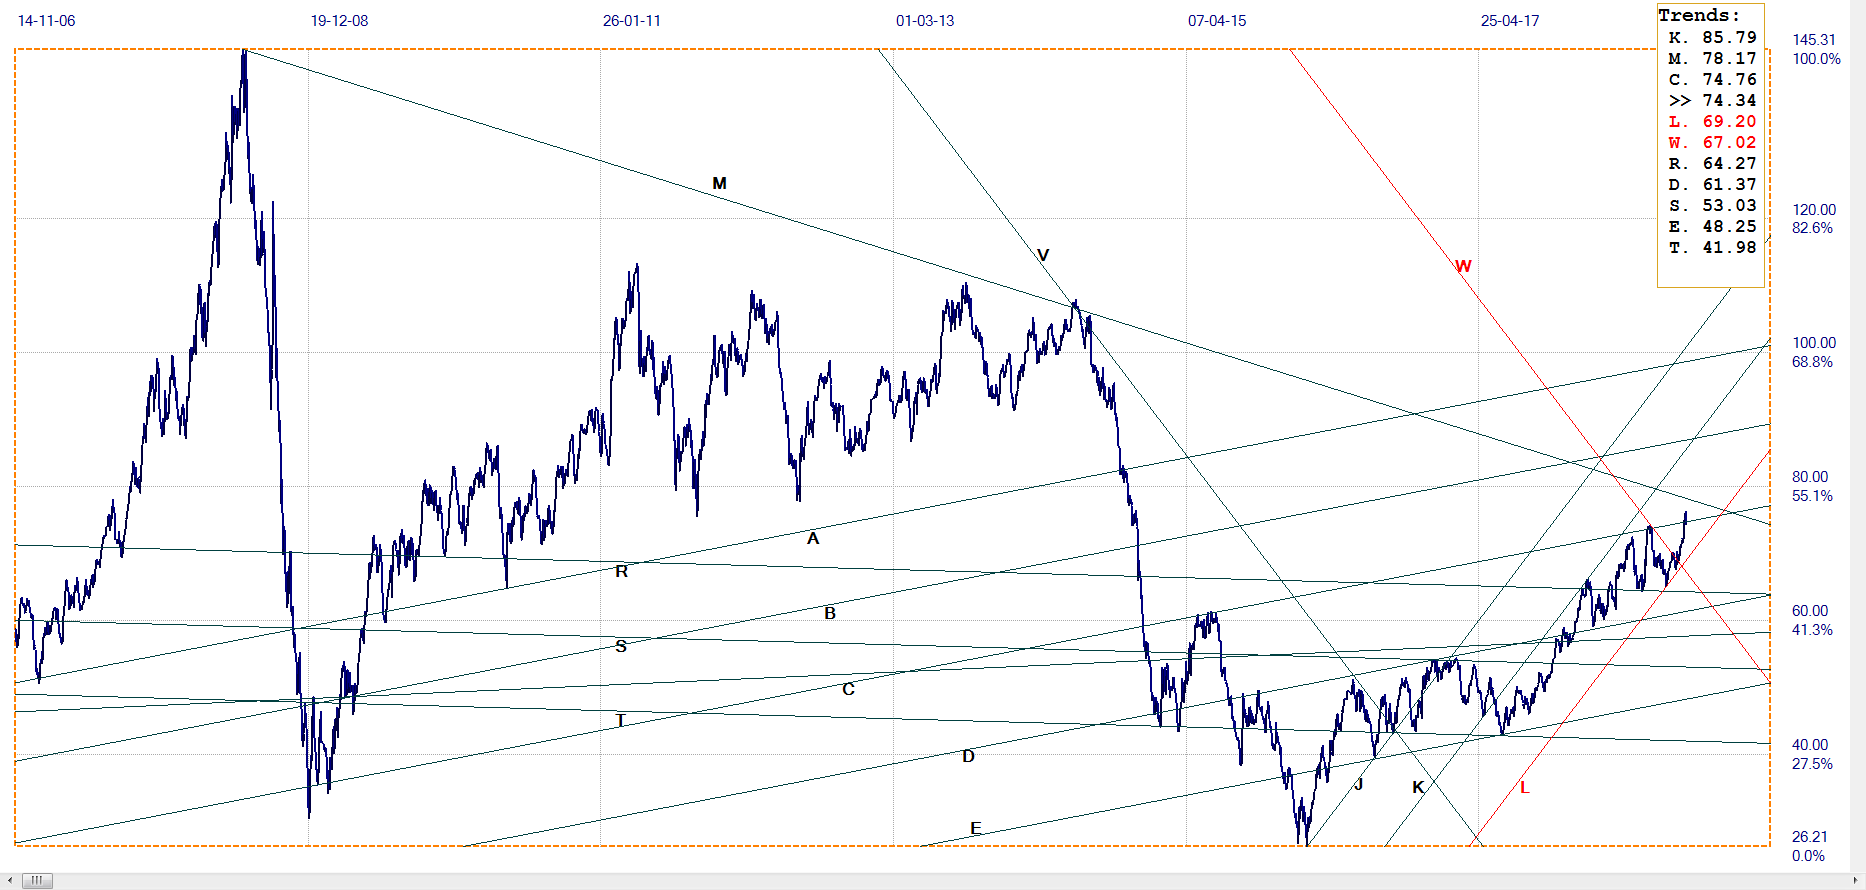
WTI crude – Daily close, last = $74.34 (www.investing.com )
Trend line C ($74.76) has been almost solid resistance for the price of crude since a brief break below the trend line back in 2008. On two occasions since then, one quite recent, the price either reversed off line C or did so after a brief and minimal break higher. Last week, crude oil broke decisively above line C to end the week at a new intermediate high.
Given recent volatility. A break back below line C, to either delay the trend higher or to postpone it for quite a long time, cannot be excluded. Continuing the trend higher to break above line M (78.17), which connects the two recent highs, would confirm that the bull market has some way to go. That will not be kindly received by people with a strong desire to see the economy on a steady growth path – and definitely not so close to an election.
********


