Gold Charts of the Year


On January 1 this year, I posted the following chart at various websites, titled "chart of the year".
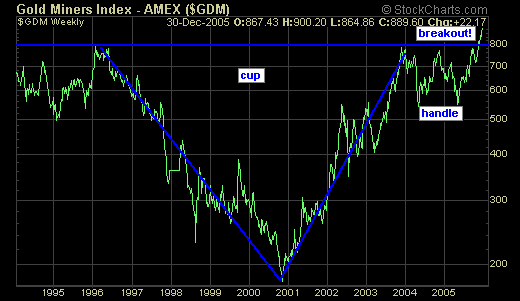
Gold chart of the year #1
A rather obscure gold stock index not many are aware of. This major breakout from a ten year "cup with handle" pattern is very bullish for years to come. My exact words were: get on board, and stay on board. So far so good.
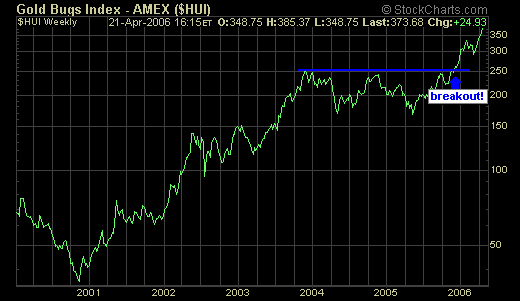
Gold chart of the year #2
The $HUI is well known to the gold camp, and it too had a major breakout around the same time as the $GDM. Of course, some chose not to believe, citing the $XAU which was lagging badly behind. $HUI is now up 50% since the breakout.
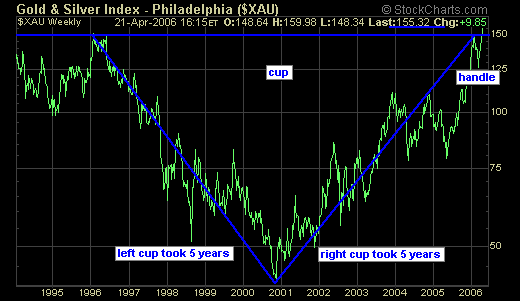
Gold chart of the year #3
Four months later, $XAU finally joined the party. By closing above 155 on a weekly basis this week, we have a legit breakout from also a ten year "cup with handle". Of course, pessimists see this as a double top, again. But most of you know the story of the "optimists and pessimists". Obviously, the strength in gold and silver stocks are direct result of multi decade highs in the metals.
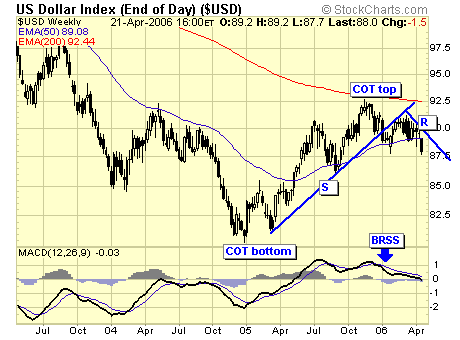
And the strength in the metals is a direct result of the weakness in the dollar. Subscribers are well aware of the major sell signal in the dollar early this year, confirming the COT top which could last a few months to a few years. But all these info mean nothing unless you have a good trading model allowing you to enter positions while risk is manageable.
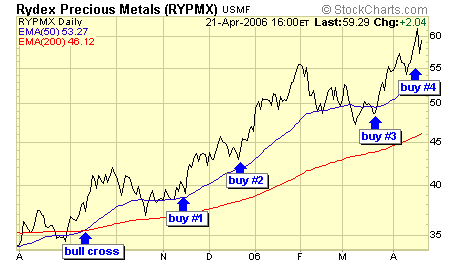
How does our trading model do so far? Subscribers with US accounts:
Buy #1 - up 50%
Buy #2 - up 35%
Buy #3 - up 15%
Buy #4 - up 2%
* we do not have a crystal ball, we simply buy the dips of a bull market.
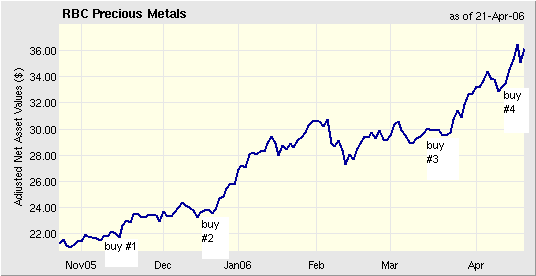
Subscribers with Canadian accounts:
Buy #1 - up 60%
Buy #2 - up 50%
Buy #3 - up 18%
Buy #4 - up 4.6%
Summary
Price action from the three gold charts of the year speak loud and clear. All three have now broken out to historic highs, with absolutely no overhead resistance. You could say the sky is the limit, but please refrain from saying "to da moon". Last time when the "to da moon" crowd was making noises, it was the beginning of a two year correction in gold stocks. (Dec 2003).
So, the question is, where do we go from here? Frankly my dear, I don't know and I don't care. We have a bull market, trend is up, pick a spot, join the party. Keep a core position at all times, take some profits every now and then, re-enter on buy signals, and go fishing. When the gold party is over, bag the chips, and we move on to the next party. Perhaps by then, stocks like Intel and Nortel are in a new bull market…..
Jack Chan at www.traderscorporation.com
29 April 2006

Jack Chan is the editor of Simply Profits, established in 2006. Chan bought his first mining stock, Hoko Exploration, in 1979, and has been active in the markets for the past 37 years. Technical analysis has helped him filter out the noise and focus on the when, and leave the why to the fundamental analysts. His proprietary trading models have enabled him to identify the NASDAQ top in 2000, the new gold bull market in 2001, the stock market top in 2007, and the US dollar bottom in 2011.


