Whither Equities And PMs?


Last week’s US Market’s asked a question about the future of the dollar, using a chart of the dollar index to find an answer. This week, a similar question is asked about equities and the answer is provided by a long term chart of the NASDAQ. As for the dollar, what the TA anticipates is not good news for that market. The same applies to what can be expected for the stock markets using the NADAQ composite index. It could be many months for the dollar index to break bearish; the weakness in the stock markets is more imminent. The time left for equities to remain high in the stratosphere is estimated at only a month or two.
Not too long ago it looked as if the local epidemic of COVID-19 was tapering off, yet still holding at a high level on a global scale. Then, just as virus news was getting stale, the infection rate picked up again. A comparison of global and US infection rates – as speculated last week – now shows that the US was getting in sync again.
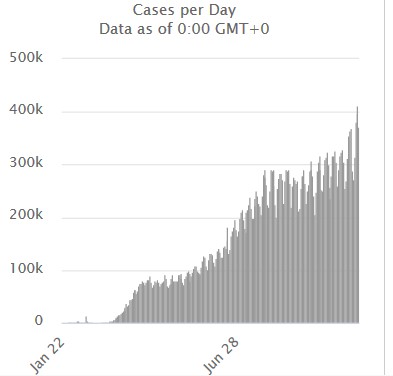
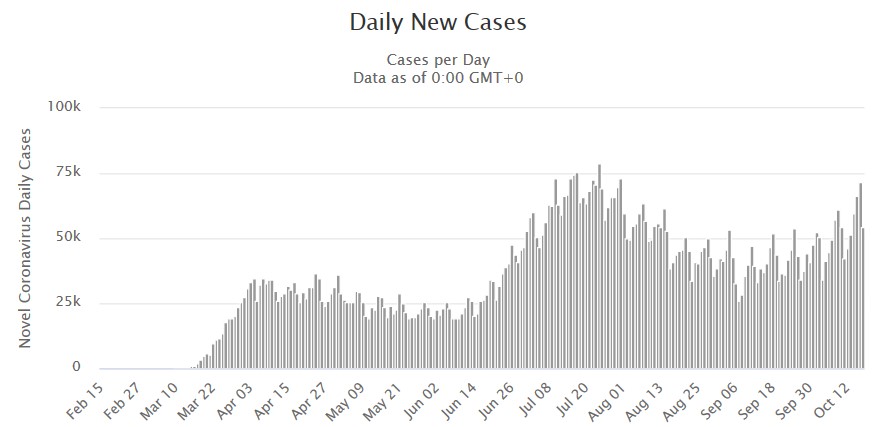
The US infection rate on the right could be why there is talk of a ‘third wave’, has been reported for some other countries If the rising trend were to continue, it could - and in various places have done so – result in new regulations including lockdown being imposed. So far, the end of COVID-19 is not yet in sight.
In many respects as far as the markets are concerned, last week was a week where nothing happened. The table shows the closing prices of the seven markets charted here for last week and the week before as well as the percentage change.
Given that we are living in somewhat more turbulent times than normal, with local and international factors creating tension and warning of significant changes in the economy to come, seeing that only one of the seven markets has changed by more than 1% during the past week is not expected.
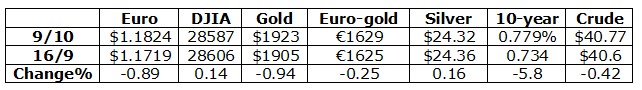
It could be argued that the reasons for the little change in six of the seven markets differ and that the stable markets therefore are not because of a global conspiracy. Europe as a whole is in much the same bind as the US to explain the little change in the euro exchange rate; crude oil is caught between expectations of fresh growth in the economy and an L-shaped recovery; the yield on the 10-year Treasury note is reacting to news and rumours from the Fed and Congress about new handouts and thus should be subject to greater volatility than the other markets.
On the other hand, we have observed that Wall Street is not being allowed to fall – at least not until after the election. There is no guarantee it will hold that long; not if my speculation about a possible bear spike, engineered to sink a Trump second term, happen to be correct. The change in the euro price of gold, with a quite stable euro, is only affected by the change in the dollar price of gold.
About the remaining two, gold and silver, we know only too well that their prices have been under tight control since the early August. That was when the OI of PM metals reached levels and a trend that spelled great financial loss for the Big Banks if these trends were to continue. From what happened since then, it is becoming clear that the Big Banks are also convinced that new bull markets have started since May in both metals, extending the one in the price of gold that was creeping higher and restarting the silver bull after the major hit on the price in March.
This effort at containing the PM prices therefore logically is intended to blunt the bull markets and initiate a new longer term sideways to bear trend as happened so many times. This longer than 2 month sustained attack can only be a rear guard action in an attempt to get the longs to run away from the market again – as they have also done regularly in the past. Many things repeat often; until they don’t. It looks as if it has become time for the “don’t” in terms of a retreat by the longs.
There was some liquidation of positions early on during the campaign, but the OIs have mostly stabilised and even show signs of increasing – bad news for the Big Banks. Are they able – and willing, in view of increased oversight – to launch a full repeat of the April 2013 attack to get out of trouble? Given the risk of a bear squeeze and the damage this will do to the shorts, and to the reputation of Comex, if the longs do not bail out, such an all out attack has be considered a possibility.
Should the gold and silver OIs begin to decline steeply, the effect on the price will show whether it is liquidation by the longs or forced closing by the shorts; initially they might do so against their own long positions, while prices are still low.
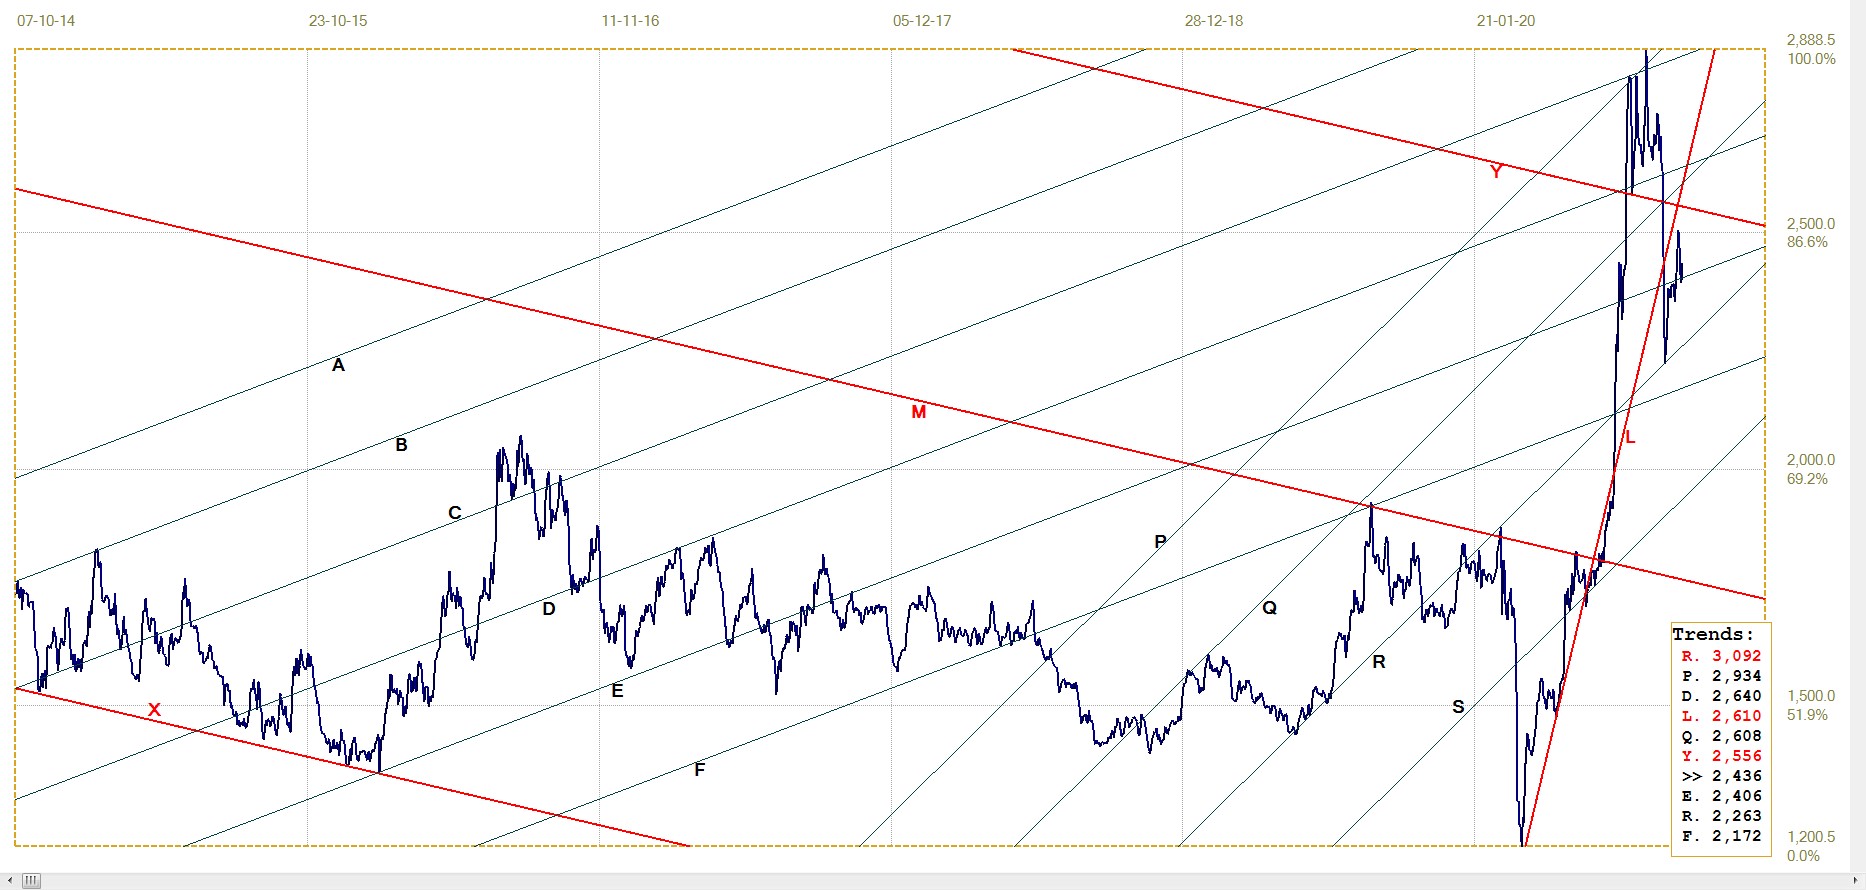
The chart of the full NASDAQ history uses a master gradient generated between the first data point and the central low point between the two highs before and during the 2000/01 Dot.com bear market.
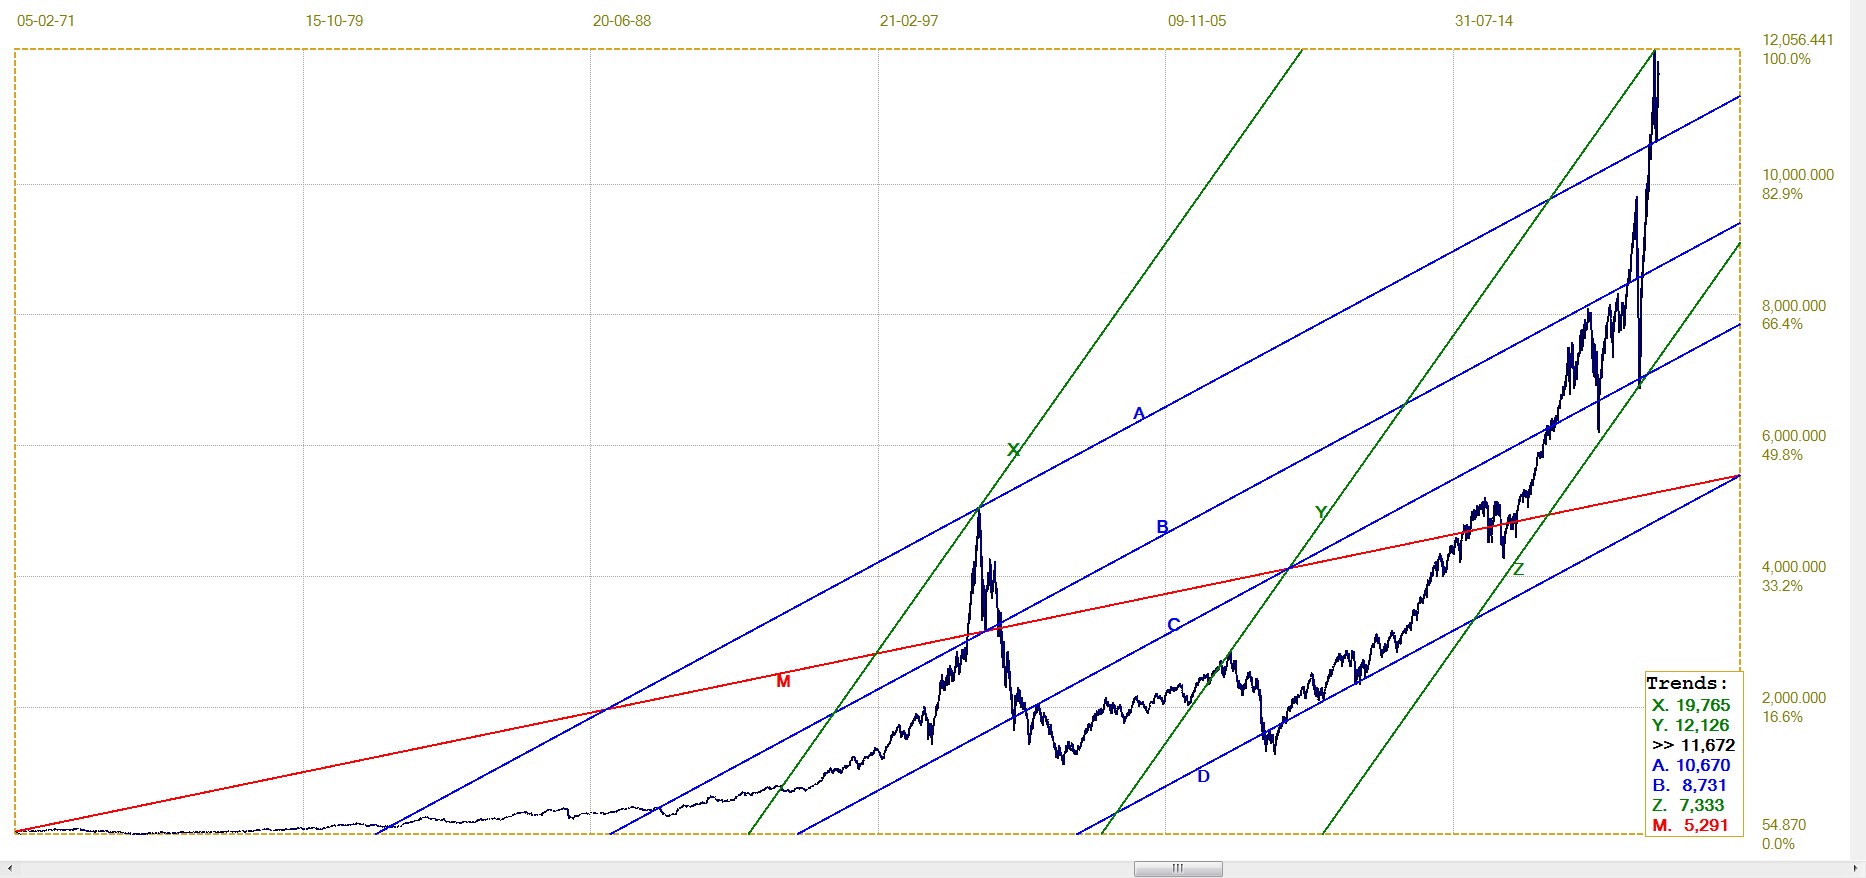
Full daily history of the NASDAQ Composite index. Last = 11872
The steep channel XYZ uses the trend lines located in the high of 2000, the high that occurred in late October 2007, and the low in March 2020. This makes line Z a tangent to the chat. Line Y passes within 0.2% of the all time high reached early in September. The ratio of this steep channel is 615:385, which differs little from the Fibonacci ratio – 382:618.
It has long been known the central point of a bifurcated top – a low point between two significant highs (and it’s inverse, a bifurcated low, the high reached between two lows) – is located on strong preferred gradients, Such points are often used as anchor points for trend lines, generally with very good results – as was done here. The same holds true of the first data point of a time series; this key point was also used for the chart of the dollar index in last week’s US Markets, with good results.
Line A of channel ABCD is located in the all time high of 2000. It also passes within 0.2% of the new low between two highs that was reached on 23 September. This good fit implies that the new pattern probably will again become a significant long term top when the full pattern has completed. Therefore the medium to longer term prospects for the NASDAQ and also the NYSE are not too good.
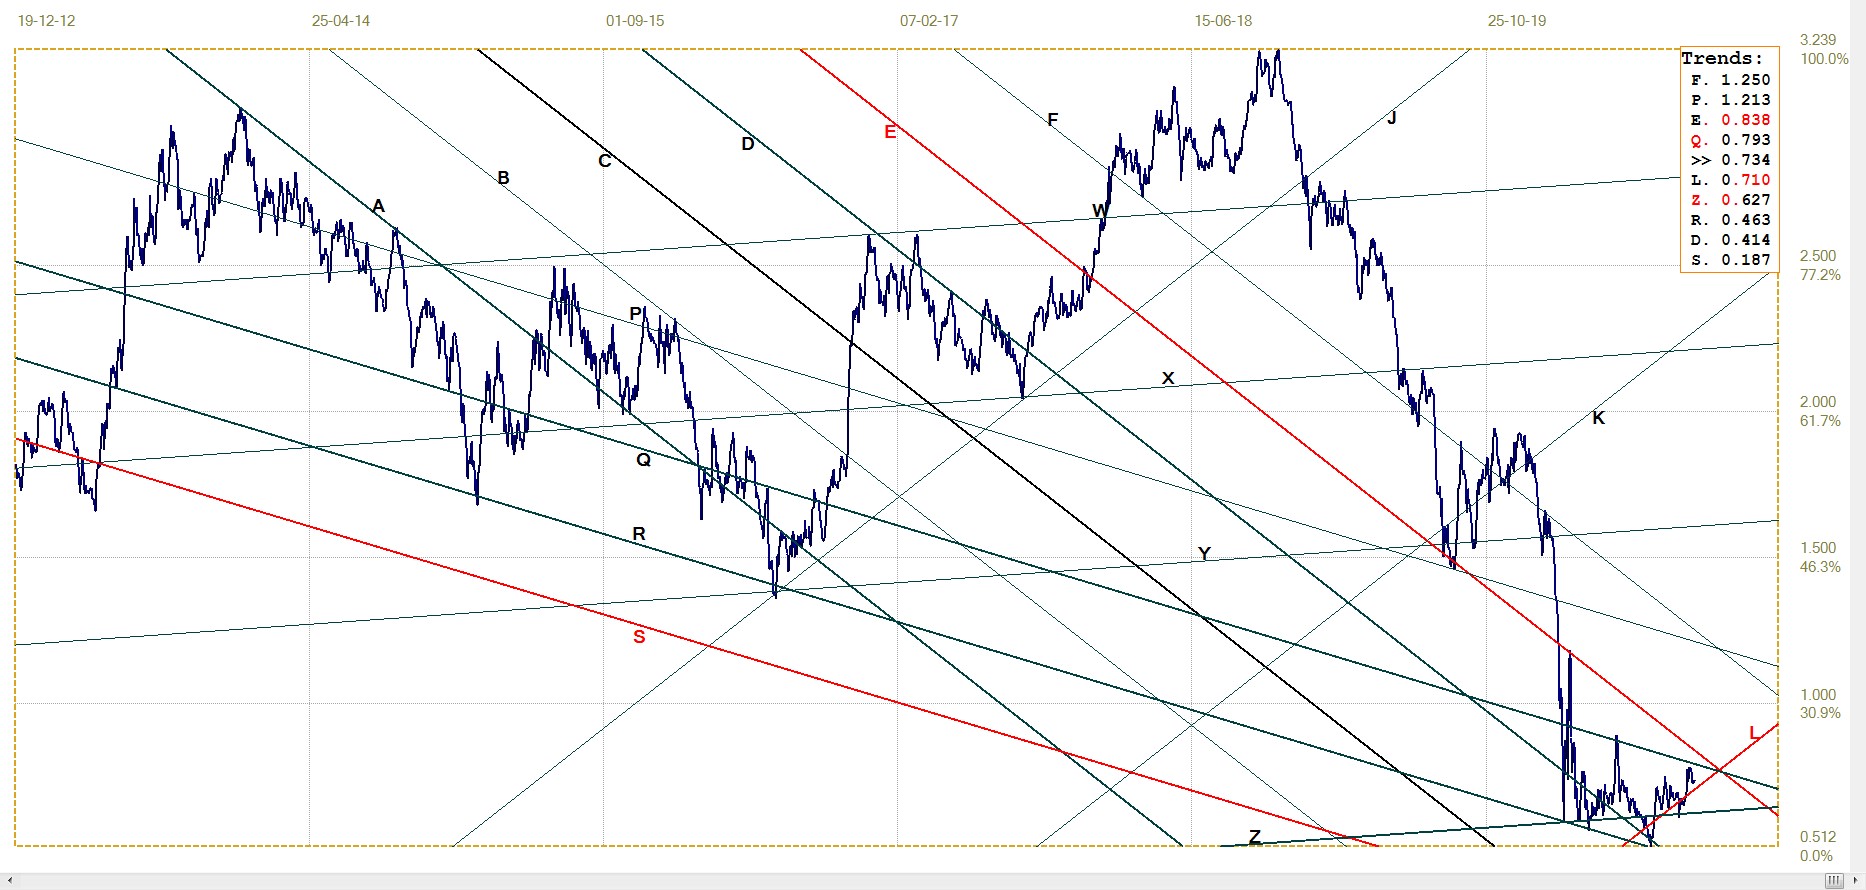
It is not possible to state with any confidence how long it will be before the Bear takes over, but it seems unlikely to happen before well into November. On the chart below, the very steep trend line G, located in the March 2020 low, acted as close support for the recent low. The index only broke below the red trend line to touch line A – such a brief and limited break through a trend line only to touch another strong trend line, is often seen and is treated as a false break.
The value of line G for Monday, 19 September, is 11455 and this increases at quite a rapid rate of 31.5 points from one day to the next . A break below that trend line, whenever it happens and is sustained, could be a signal for a bear market breaking loose and trending lower for a long time.
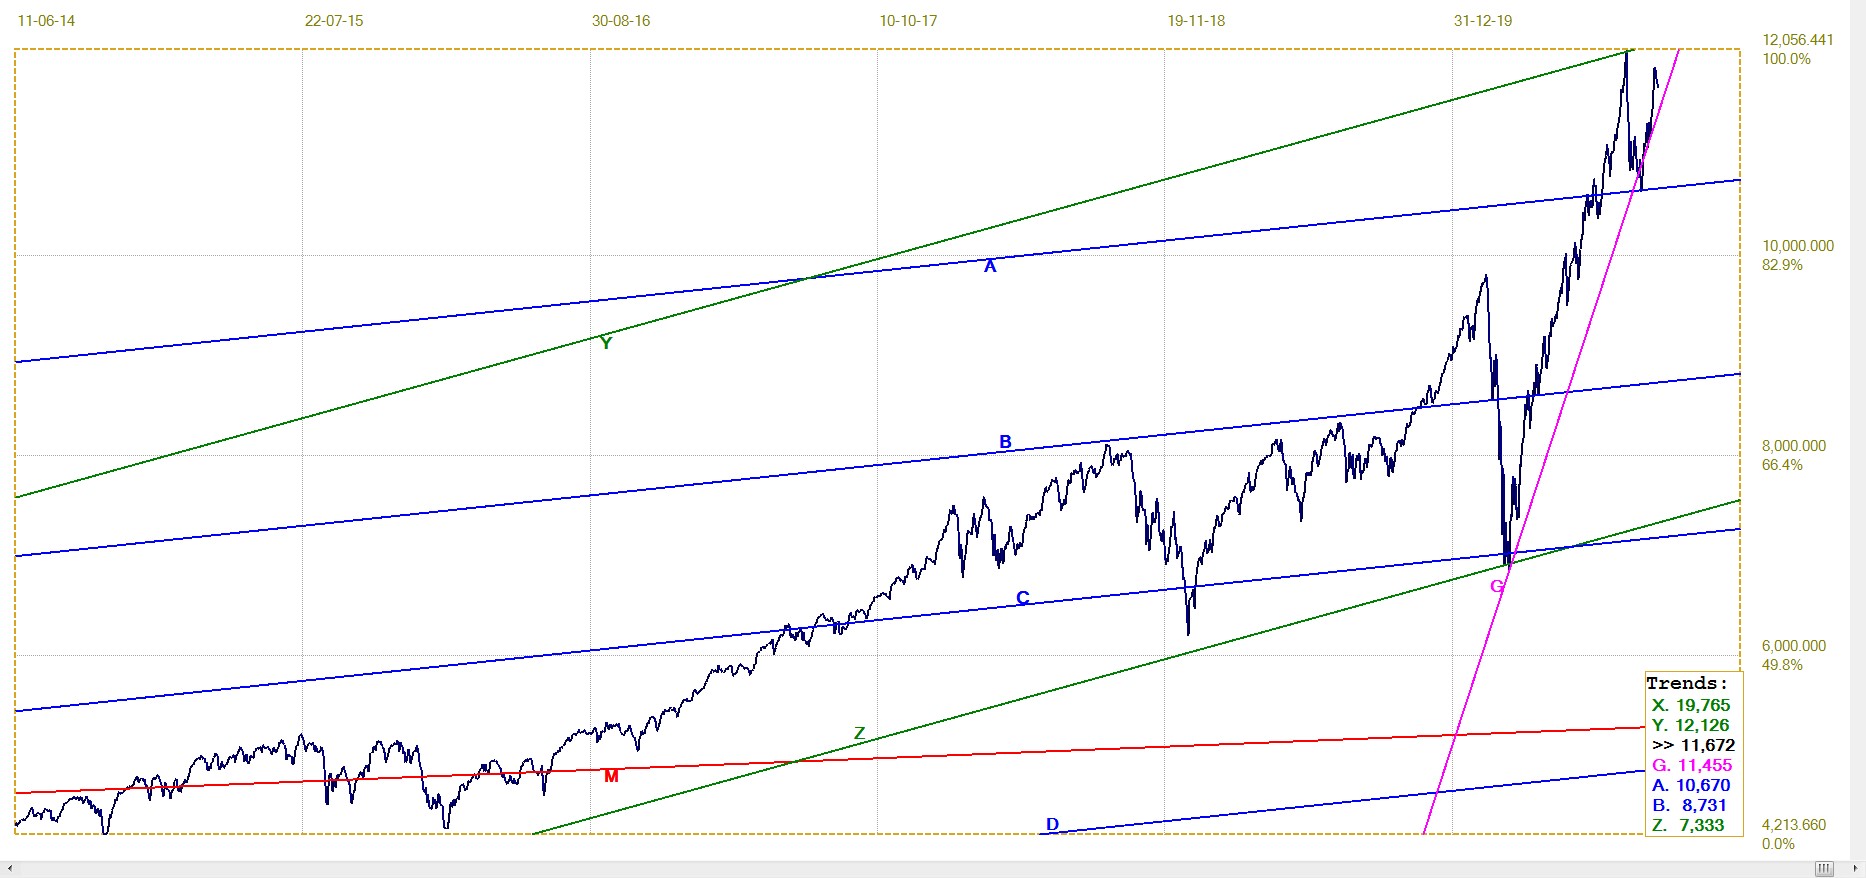
Partial history of the NASDAQ Composite since June 2014. Last = 11872
The markets presumably are still going to be as static for the near future as they had been last week – unless we have an event that shakes things up. This could last until the presidential election enters the legal dogfight over whatever reason replaces the matter of the ‘hanging chads” of the Bush-Gore election and the more recent electoral vs popular vote issue. (Likely to be the postal votes, this time?)
Or will Biden be preemptively disqualified as a candidate because of alleged or suspected complicity in the supposedly illegal ventures of his son?)
Euro–Dollar
10 day ago, the euro go ended right at resistance of line Z ($1.1863), then reversed lower to break below the steep line G ($1.1756). Despite being less than 1%, it is a significant move for a currency. The dollar did rally a little unexpectedly last week – with wider effects that only on the euro – and it remains to be seen whether this is a new trend or a brief (engineered?) reaction to stave off the near inevitable bear trend a little longer.
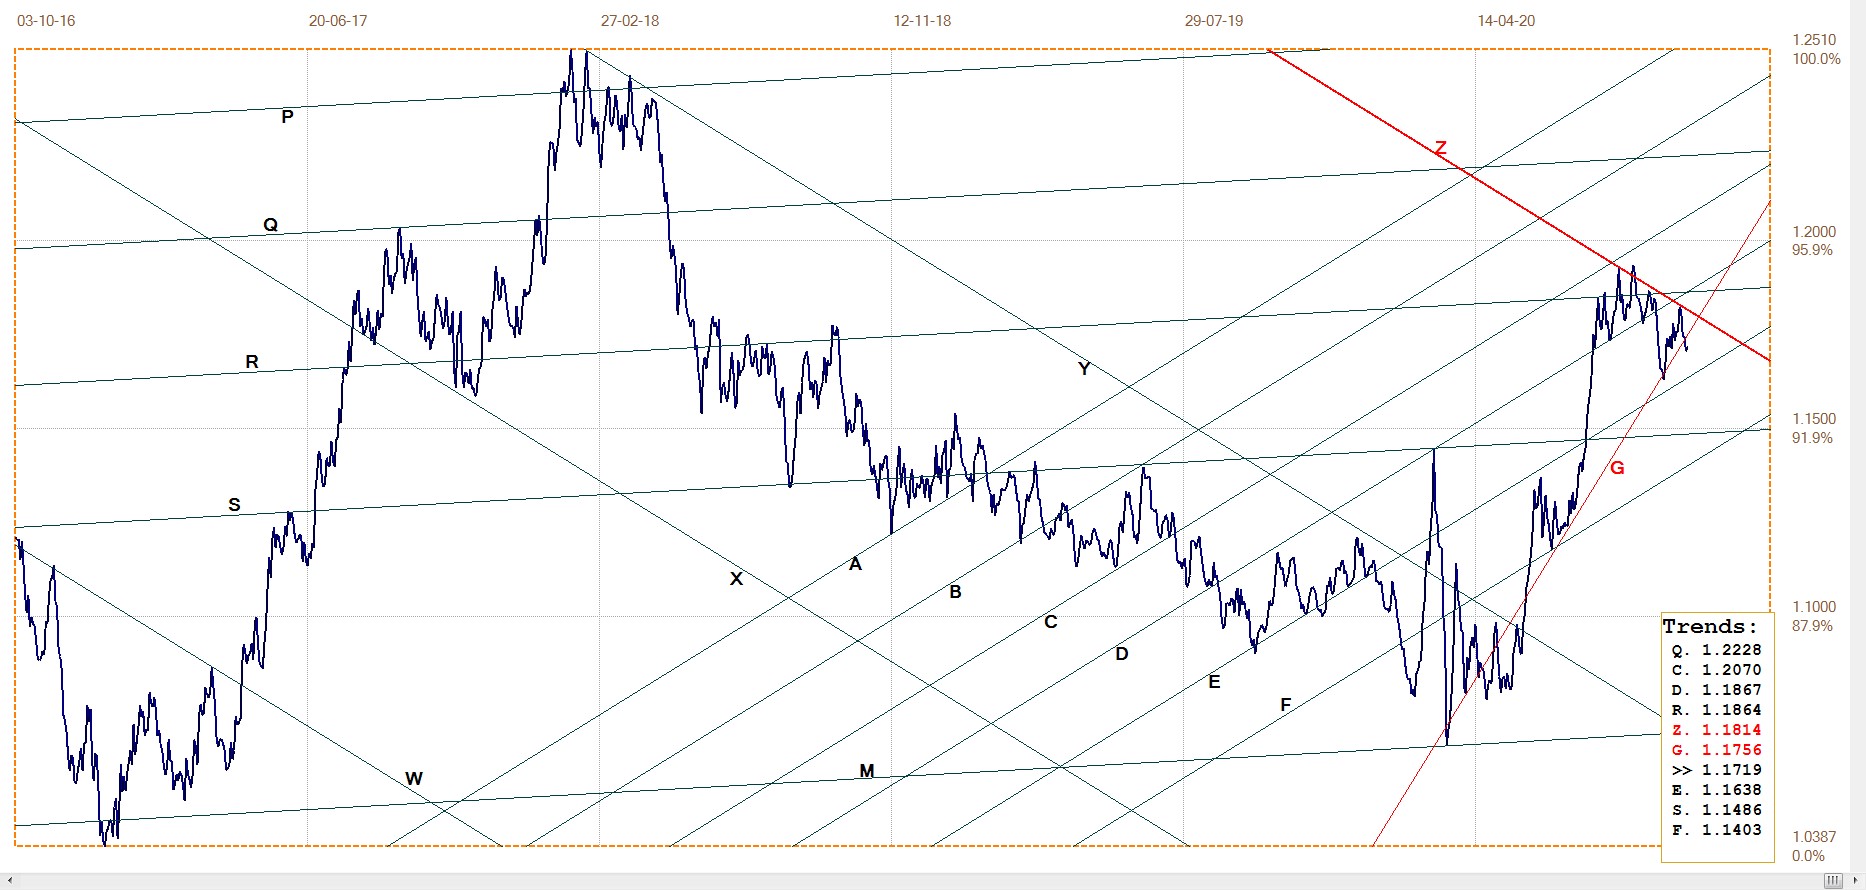
Euro–dollar, last = $1.1719 (www.investing.com)
DJIA Daily close
Last week the DJIA completed the latest rally by reaching resistance at line U (28 760) and then reversing slightly. We have to wait to see this week and perhaps longer whether the reversal is to be the end of the recent rally or whether the stock market will extend the run higher during this and the few other weeks before the election.
From the behaviour of the stock market since the almost public invitation on the eve of Christmas 2018 to the PPT to go all out and reverse the steep bear market, including the repeat reversal in late March this year and sustained high volume as nearly every intra-day correction is reversed, intervention on the NYSE is taken as fact. How successful this attempt will be is open to question, but all in all the odds favour a new bear market to begin closer towards the end of 2020 or in early 2021.
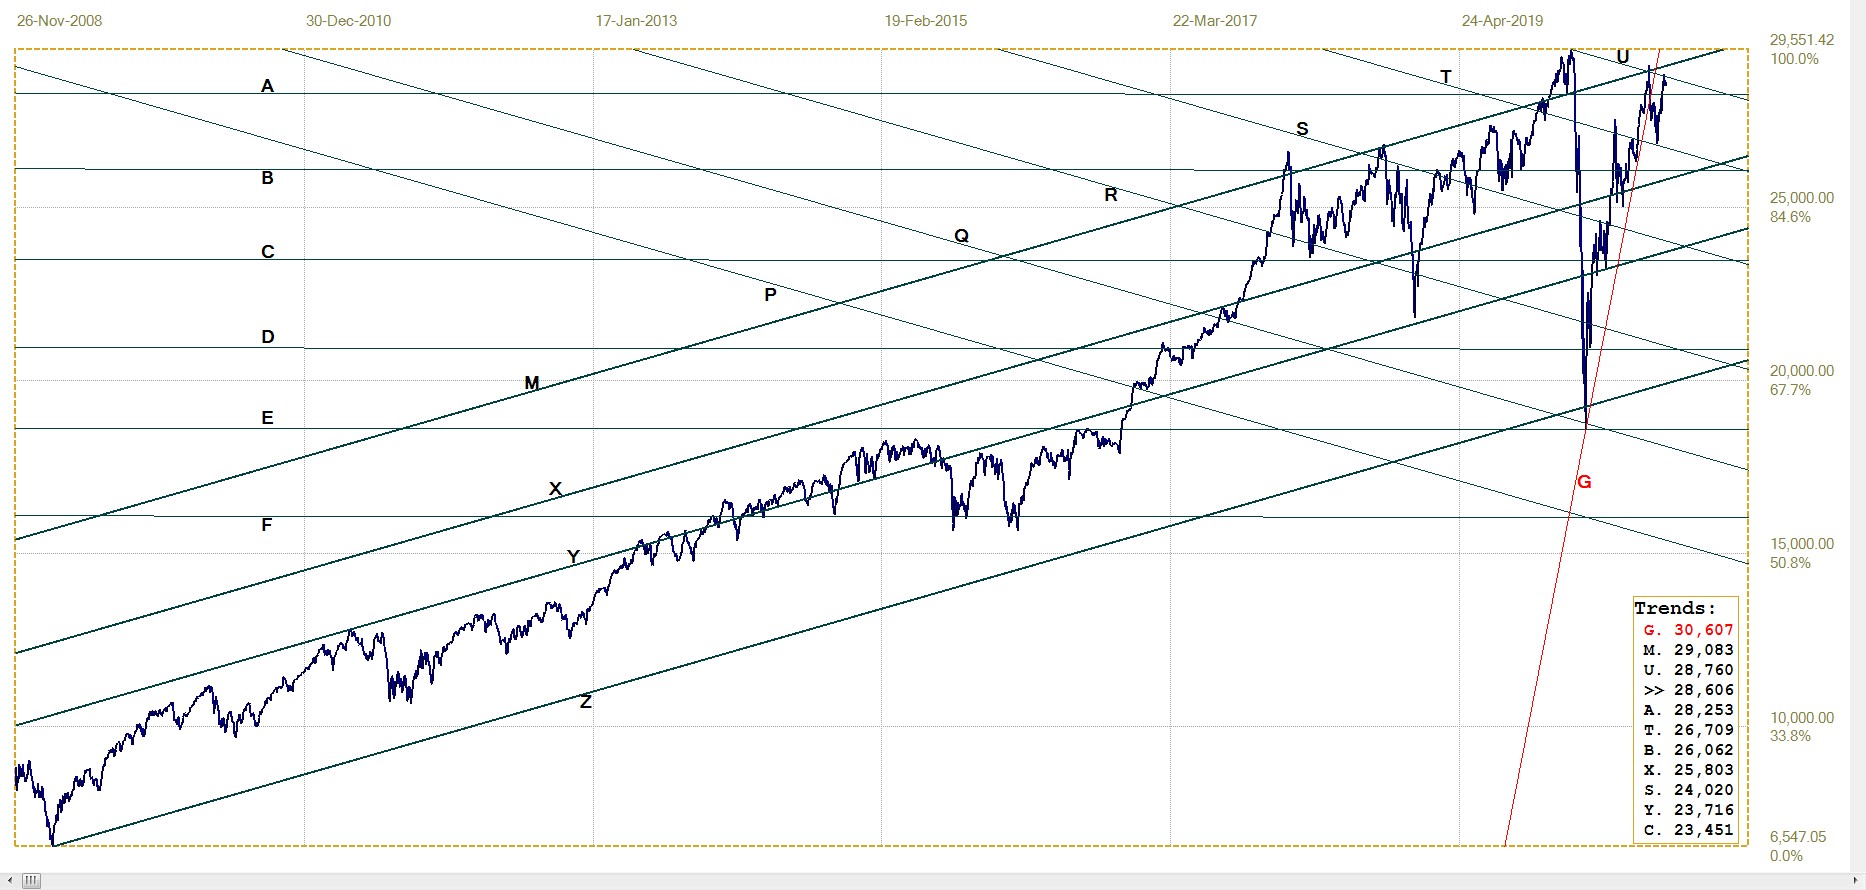
DJIA, last = 28606.31 (money.cnn.com)
Gold London PM fix – Dollars
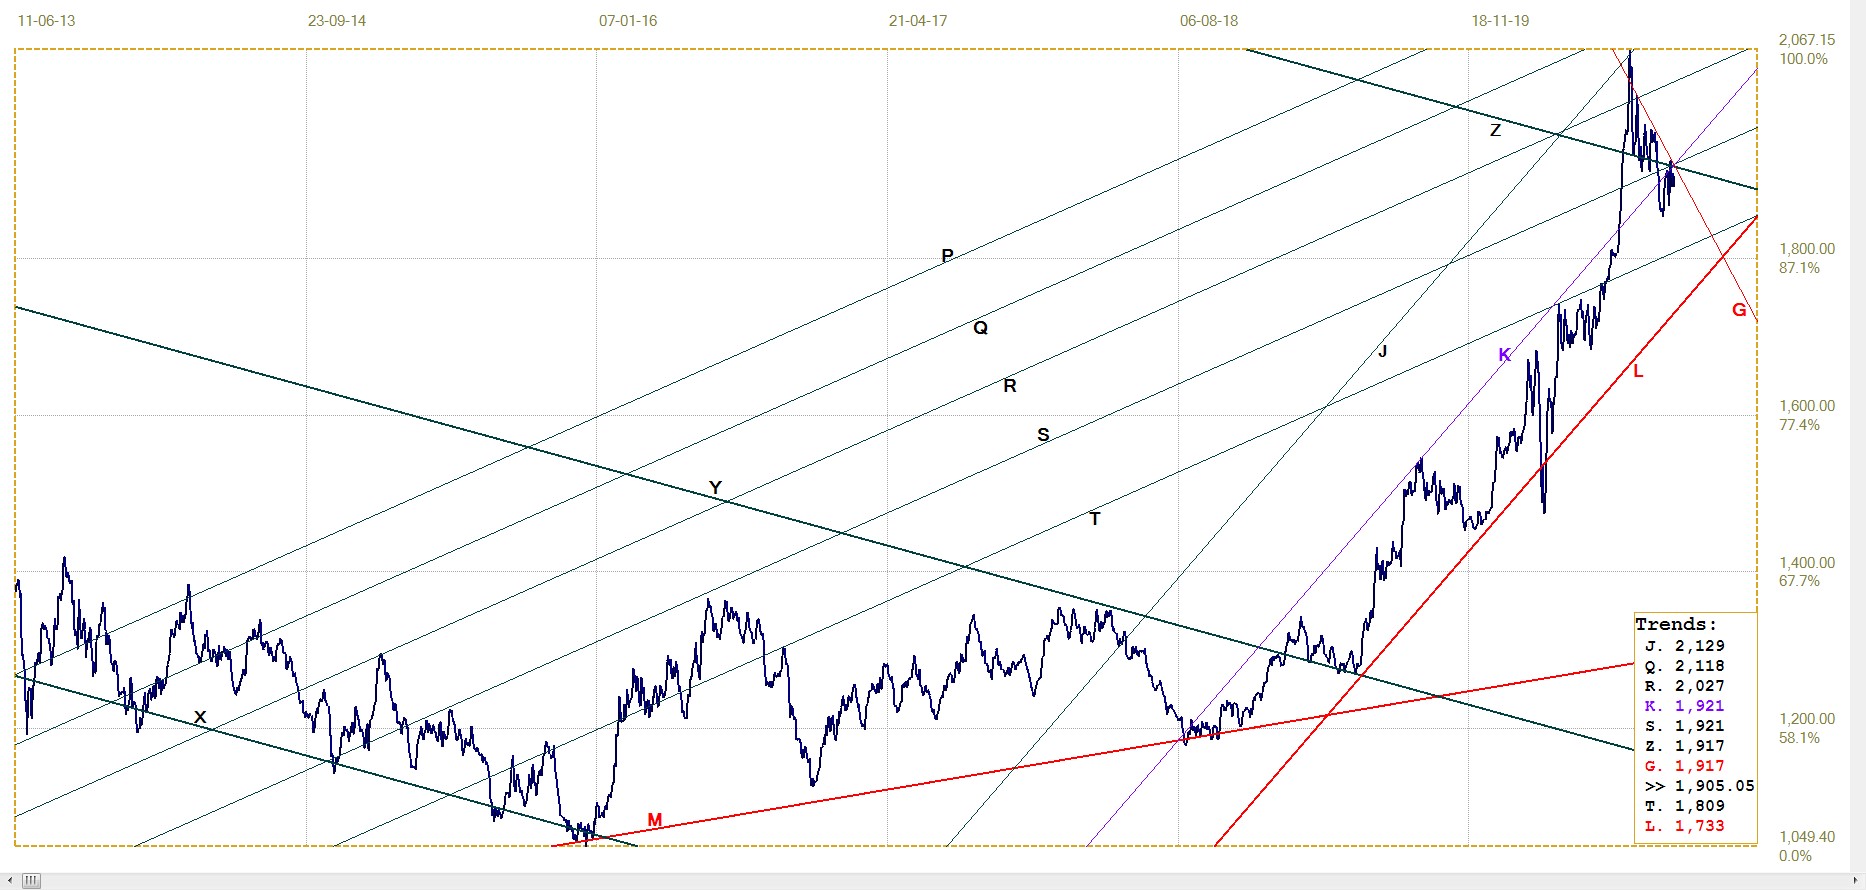
Gold price – London PM fix, last = $1905.05 (www.kitco.com)
As noted above, the gold London PM fix was close to unchanged from 10 days ago to last Friday. The mechanism for doing the fix is well explained on the website of the LBMA, but it does not prevent suspicion that covert forces might be at work to achieve a price that suits some institutions more than the general market.
The London fixes differ from the Comex quotes, but generally not by large enough margins to hint at two distinct market, as the Shanghai Gold market was wont to do. I have come across little recent comment on a comparison of quotes on the SGE and Comex and have not followed this myself.
Lines Z and G, both of which are resistance at the moment, sit at $1917, which is well within reach if the rally should resume. Perhaps this week to see break higher?
Euro–gold PM fix
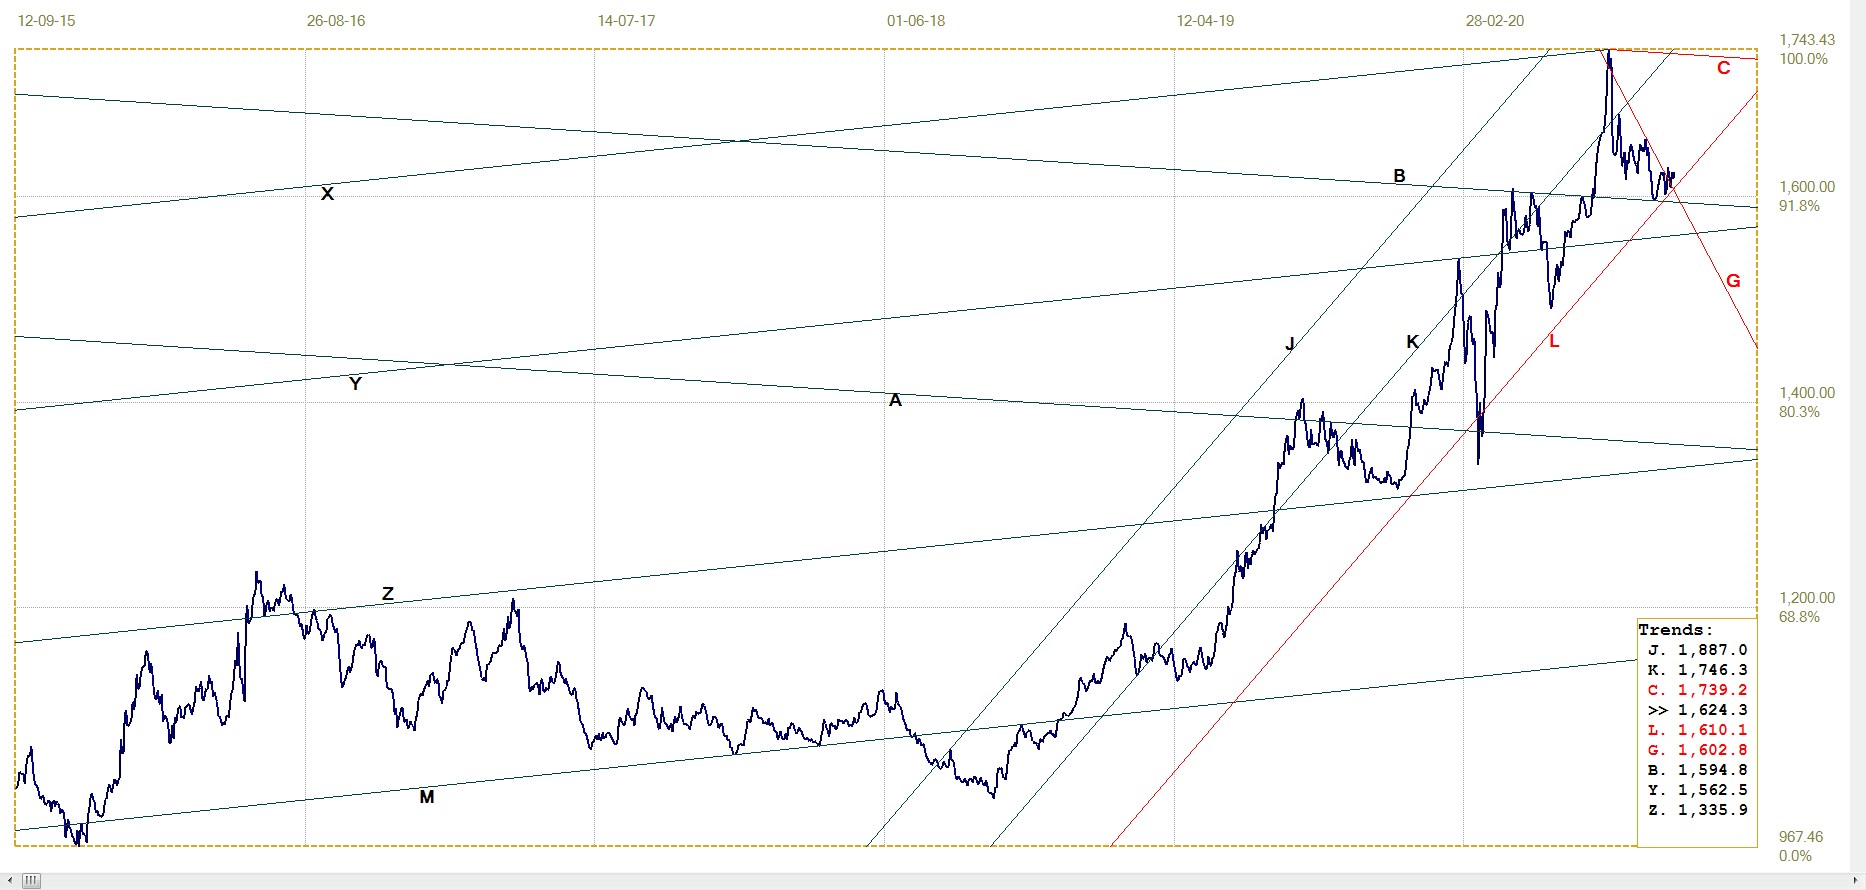
Euro gold price – PM fix in Euro, last = €1624.25 (www.kitco.com)
The euro price of gold was being squeezed between support at lines B (€1594) and L (€1610) and also had kept below resistance at line G (€1602) with a marginal break above line G with the PM fix ten days ago. Last week, the price briefly tested the new support at line G and then bounced to hold a little above line G.
It has also kep within bull channel KL. The combination of the bull channel holding and also holding above the steep resistance of line G hold promise for the week ahead – which could happen either because of new weakness in the euro or a better dollar price of gold/
Silver Daily London Fix
The break into bull channel DE ($24.06) almost two weeks ago failed to hold. The price dropped as steeply to just below line E, but then resumed the rising trend last Friday to break higher again.
It is still a case of ‘poor silver’ doing its best to resume the steep rally that in effect caused the months long attack on PM prices, but failing to regain full momentum. Silver and the DJIA recorded the smallest percentage week-on-week changes of the seven markets in the earlier table.
While it would be irresponsible to claim that it this is not unexpected because both these markets are tightly controlled, we do know that this applies to silver. If one were to extend this view to include Wall Street, the assumption would probably be accepted by a majority of people who follow the markets.
Silver daily London fix, last = $24.36 (www.kitco.com)
U.S. 10–year Treasury Note
There is not much to add to what has been said here before regarding the bond market. Perhaps when new direction is shown with a definite and sustained break above line Q (0.793) or below line L (0.710), the future of the 10-year will become better known and deserving of a longer analysis.
U.S. 10–year Treasury note, last = 0.734% (www.investing.com )
© 2020 daan joubert
********


