Gold Gets the Cash (Ahead of S&P Crash?)


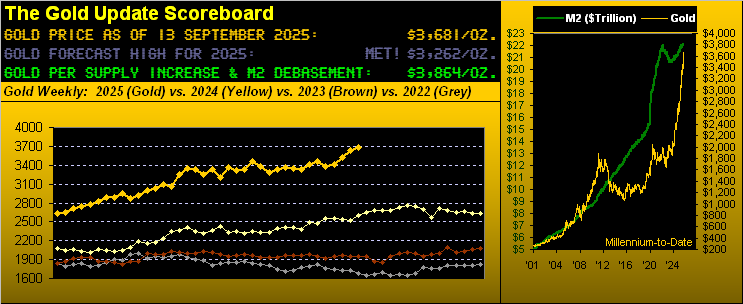
Yes, Gold this past Tuesday by its “continuous contract” (for which the “front month” is December) touched 3700 — trading even further to a fresh All-Time High at 3715.
No, Gold wasn’t long-lived above 3700; however for 38 glorious Golden minutes ’twas a beautiful thAng. Price then proceeded through the balance of the week to settle per the above Gold Scoreboard at 3681, now just -183 points beneath the Dollar debasement value of 3864. And as detailed in last week’s missive, upon next eclipsing such key measure — regardless of when that may be — we’ll again judiciously reiterate (after 14 years) that Gold has “gotten ahead of itself”. Do mind the above right-hand panel. And whilst it has not yet happened, ’tis nonetheless fabulous to see Gold having almost caught all the way up to where it ought be brought, (so hopefully you’ve long ago bought).
More striking however is that across the past 242 trading days from last 26 September-to-date, Gold has achieved TEN +100-level milestones from 2700 to now 3700, (which for those of you scoring at home is a +37% increase in less than one year). By comparison, remember when it took 2,251 consecutive trading days (basically nine years) for Gold to just get from 1900 on 22 August 2011 those +100 points higher to 2000 on 21 July 2020? 2,251 trading days just to gain +100 points! But this most recent milestone run has averaged +100 points every 24 trading days! Here’s the table:

“Although, mmb, the percentage increase from one to the next is always decreasing…”
Squire remains one of the few modern-day market mavens who does math. And to be sure, from Gold 1900 to 2000 was a +5.3% increase, whereas this most recent 3600 to 3700 was just a +2.8% increase.
But let’s view it from the futures contract perspective, whereby with a $20k commodity account you can trade one Gold contract, and thus control 100 ounces of Gold; (as opposed to $20k covering only five physical ounces; which for you WestPalmBeachers down there is — by the futures — called “leverage”).
So: Gold back then from 1900 to 2000 was a +100-point gain x $100/point = $10k profit, (your $20k account thus becoming $30k, or +50%) … but again, that took those noted nine years. Now, in just less than one year, Gold has gone from 2700 to 3700, a +1,000-point gain x $100/point = $100k profit, (your $20k account instead becoming $120k, or +500%).
Therefore to Squire’s point, yes each successive +100-point milestone is a smaller percentage gain … but they’ve been coming far more rapidly, indeed perhaps too rapidly. Here we update from the website our Market Value measure for Gold, price (3681) now showing as +260 points “high” above its smooth valuation line (3421) defined by the movement of our primary BEGOS Markets (Bond / Euro / Gold / Oil / S&P 500). And as we always say, price inevitably reverts to valuation:
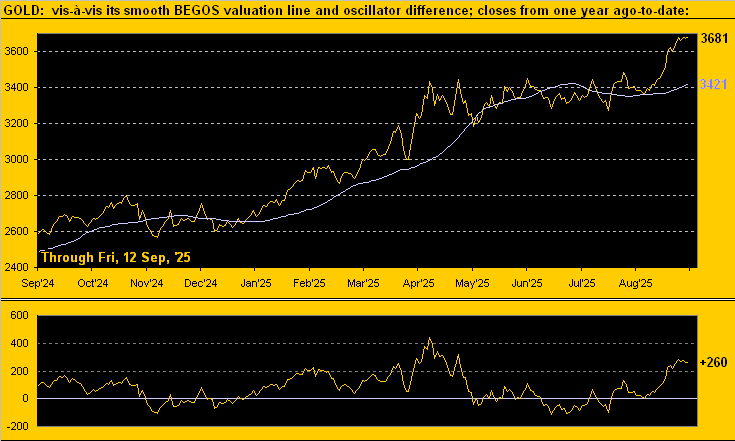
As for Gold by its weekly bars and parabolic trends from one year ago-to-date, the following blue-dotted Long stint is now eight weeks in duration with present price (3681) an admirable +423 points above the ensuing week’s “flip to Short” level (3258). Gold’s EWTR (“expected weekly trading range”) has narrowed a tad to 120 points, albeit that’s still some three weeks of cushion — barring a hard price fall — even with price (as just above noted) being fairly high above its BEGOS Markets valuation:
‘Course, having endlessly lost all sense of reasonable valuation is the S&P 500.
“Well, the Fed’s cutting rates beginning this Wednesday, mmb…”
Oh good grief, dear Squire. How many times over how many weeks have the FinMedia reported time-and-again that the purported Federal Reserve’s Fund rate reduction has been “priced-in”? ‘Tis been but 15 days since FedChair Powell in Wyoming suggested the possibility of a monetary policy shift, it thus being FinMedia-deemed that a rate cut is “priced-in” for the S&P. After which ’twas later “priced-in”, and then again “priced-in”.
Query: how many times must the same event be “priced-in”? We’re just asking, given the S&P 500 is recording all-time highs seemingly day-after-day, indeed for seven of the days since The Chairman’s address.
Yes, the StateSide job market has stalled as herein sliced and diced a week ago. And despite August’s just-reported Consumer Price Index having doubled from its July pace of +0.2% to now +0.4% (remember we said the July spike in the Producer Price Index could well feed into August’s CPI), apparently such increasing inflation is ignorable and is also “priced-in”. So by logic (a concept no longer useful in this Investing Age of Stoopid), are unsupportive earnings (the price/earnings ratio of the S&P now a staggeringly high 46.7x), plus perhaps stagflation, and now a re-stumbling StateSide economy also all “priced-in”? Moreover: at what point for equities chasers shall FOMO (“Fear Of Missing Out”) morph into FONBO (“Fear Of Not Being Out”)? What might the traditionally market-leading (until COVID) Economic Barometer being urgently now trying to tell us?
Too, (not that we need be reminded), ’tis September, the historical results for which make it far and away the S&P’s worst losing month so far this century, (as we’ve previously cited, -32.3% when aggregating the prior 24 Septembers). However: that compiled, outright “crashes” have been instead typically owned by October, notably the hollowing-out of equities in the Garzarelli Cavatelli of ’87, the awkward Asian Contagion of ’97, and frighteningly so the FinCrisis of ’08. Thus by this missive’s parenthetical portion of its title, next time ’round — whether ’tis the “Look Ma! No Earnings!” crash or the “Look Ma! No Money!” crash — we remain very sensitive to its eventual arrival (be it this month, next month, next year), such that ahead of said crash Gold’s been getting the cash.
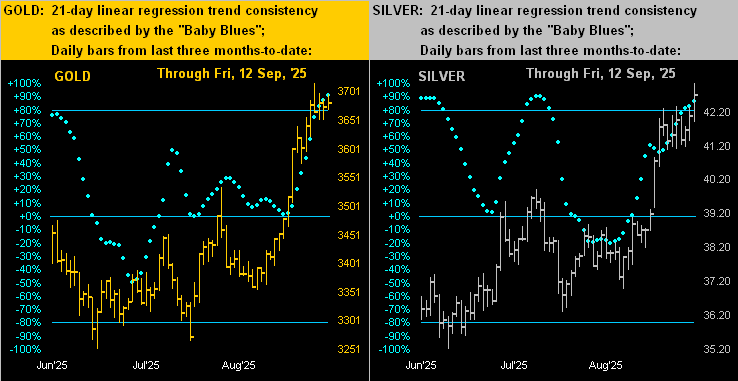
Clearly appears that case as we next view the two-panel graphic of Gold’s daily bars from three months ago-to-date on the left, with those for Silver on the right. Regular readers well know the baby blue dots that depict the day-to-day consistency of the regression trend, and as you can see, the “Baby Blues” are our directional friend. As for Silver’s rightmost high? 43 if you please!
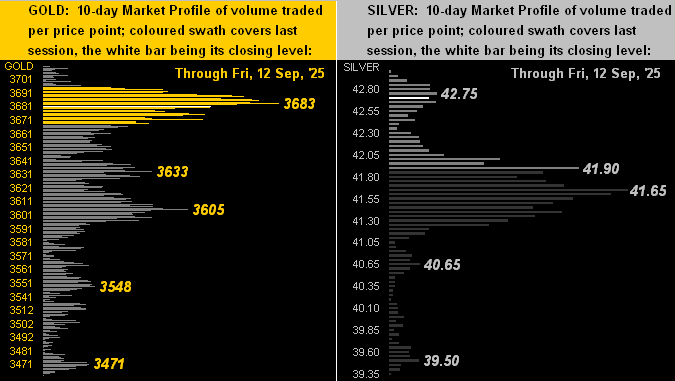
And as continues that case of late, highs keep present prices in the 10-day Market Profiles as … well … high. Below (at left) is that for Gold and (at right) for Silver. With respect to the latter, 43 is great to see: but were Silver priced to Gold by their ratio’s average century-to-date (69.3x vs. 86.2x today), rather than 43, Silver would now be 53! Whee-Heee!
Thus into Fed week we go, the Open Market Committee expected to release their Policy Statement incorporating a rate cut (we see -25bp) come Wednesday at 18:00 GMT; the pop in August retail inflation is too much to warrant a “jumbo” rate cut of -50bp. So does that in turn send the S&P 500 on a selling spree? J.P. Morgan opines there may so be. For the S&P now being “priced to perfection”, ’tis all indeed “priced-in”, you see?
Pssst: “Got Gold?”
Cheers!
…m…
www.TheGoldUpdate.com
www.deMeadville.com
and now on “X”: @deMeadvillePro
*********

Mark Mead Baillie has had an extensive business career beginning in banking and financial services for two years with Banque Nationale de Paris to corporate research for three years at Barclays Bank and then for six years as an analyst and corporate lender with Société Générale.
For the last 22 years he has expanded his financial expertise by creating his own financial services company, de Meadville International, which comprehensively follows his BEGOS complex of markets (Bond/Euro/Gold/Oil/S&P) and the trading of the futures therein. He is recognized within the financial community of demonstrating creative technical skills that surpass industry standards toward making highly informed market assessments and his work is featured in Merrill Lynch Wealth Management client presentations. He has adapted such skills into becoming the popular author each week of the prolific “The Gold Update” and is known in the financial website community as “mmb” and “deMeadville”.
Mr. Baillie holds a BS in Business from the University of Southern California and an MBA in Finance from Golden Gate University.
More from Gold-Eagle


