Silver Taps 100 Whilst Gold Scrabbles for 5000


Silver yesterday (Friday) at 15:10 GMT saw the current front month contract (March) achieve 100.00 for the very first time, en route to trading as high as 103.53 before settling the week at 103.26. Hearty congratulations to Sweet Sister Silver!
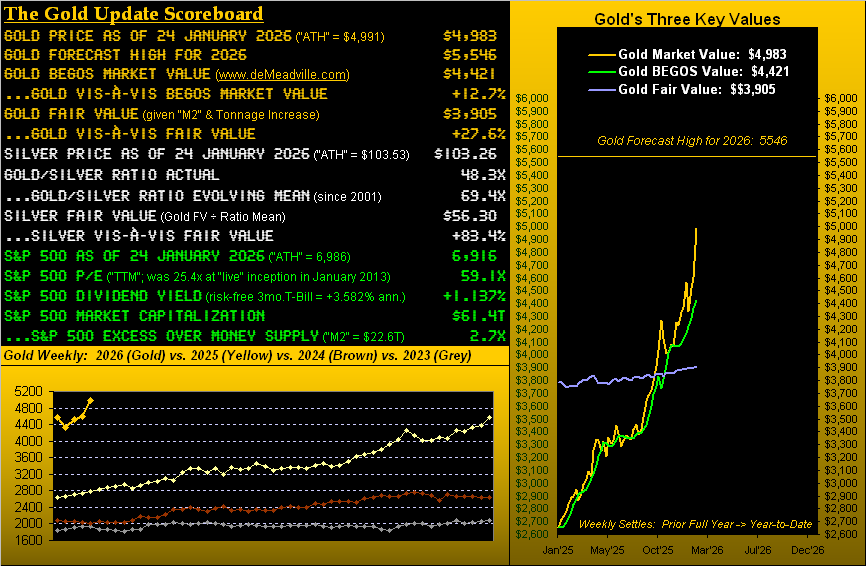
Gold however was unable to keep pace in the day’s milestone race, reaching “only” up to another All-Time High at 4991, rather than (as yet) eclipsing 5000 in closing at 4983.
Thus, on marches the metals’ mania mayhem with Gold year-to-date up now a net +15% and Silver +46%. (For you stock jocks, the S&P 500 thus far is +1%; have a great day).
Wonderful as ’tis in maintaining our 5546 forecast Gold high for 2026, we’ve this prudent cash management reminder from the “Metals Meltdown Dept.” … just in case you’re scoring at home:
- Back at Gold’s 06 September 2011 record high of 1923, price by December four years hence had “corrected” -46%;
- Back at Silver’s 25 April 2011 record high of 49.80, price by December four years hence had “corrected” -73%.
“But mmb, you’ve already said that’s not gonna happen again, right?”
No one “knows” with certainty Squire, however we very much doubt it. To be sure, we’re in the third massive metals “spike” since 1980, (recall then by 1982 Gold having succumbed -66% and Silver -88%). Means reversion does happen.
The big difference between (yes we have to reprise it)  “Now and Then” –[BeaTles, ’23] is back then the precious metals couldn’t get a seat in the theatre, let alone a back stage pass; now Gold and Silver are on centerstage aglow in all the lights. Too, as we described in last year’s final missive: the perception of Gold has morphed from a yield-less, irrelevant relic to meme-like stock proportions, and seriously is becoming more widely recognized as a foundational mitigant to debt-driven Dollar debasement and geopolitical jitters, overvaluation be damned. To wit per the above opening Gold Scoreboard:
Gold at present is +12.7% above its BEGOS Market Value (4421 by price’s movement relative to those of the five primary BEGOS Markets being the Bond, Euro, Gold, Oil and S&P 500) and further ’tis +27.6% above Fair Value (3905 by price’s 45-year regression to the debasing Dollar via “M2”, countered by the increase in the supply of Gold).
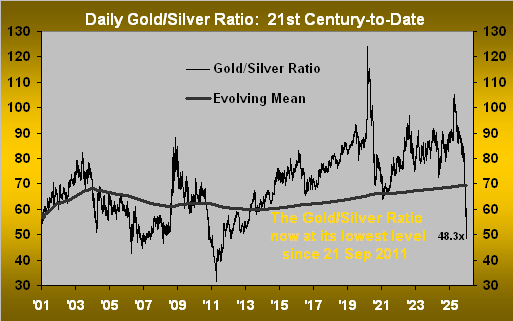
As for Silver, she is +83.4% above her Fair Value (56.30 given that for Gold divided by the evolving mean of the Gold/Silver ratio). And such ratio now at 48.3x is a 14-year low as shown below by the day across the past 25 years:
Still, maybe this is the great revaluing of the metals, mmb…”
Squire, as we’ve repeated ad nauseam through so many years, “the market is never wrong” … but it can be vastly misvalued as — again — good old means reversion shall ultimately will out. Moreover, having calculated a proper Fair Value for Gold since 1980 — indeed by which Gold until very recently has been undervalued through four decades — ’tis a valuation foundation we shan’t abandon.
“But oh, there’s too much debt”, they say. “But oh, geo-political tensions are running astray”, they say. ‘Course, they‘ve been saying all this for years. And hardly are we going to begin regressing the price of Gold to global debt levels and geo-political devils. For at the end of the day, such harrowing macro issues lead to more currency debasement, which in turn shall redound back to increasing the Fair Value of Gold, and Silver too by her relationship thereto.
‘Course today, we’ve all the newly-minted Gold experts out there who also are extoling the industrial benefits of Silver, rightly pointing out that there’s not anywhere near enough physical supply of either precious metal to satisfy the paper/derivative claims on it all.
So, they’re just figuring that out now? Have they looked as well at the S&P 500’s market capitalization of $61.4T supported by a liquid money supply of “just” $22.6T? Talk about an inevitable monetary printing event! Still, for Silver to truly be justified as this high, her industrial demand must vastly accelerate. Not that it shan’t, but ’tis something of which to be aware.
All that said, as we wave the Gold flag for 5546 in 2026, we love having Sister Silver participate. But should the precious metals en route take a bit of a bath — let alone a beating — bear in mind their respective Fair Value levels per each weekly missive’s opening Gold Scoreboard.
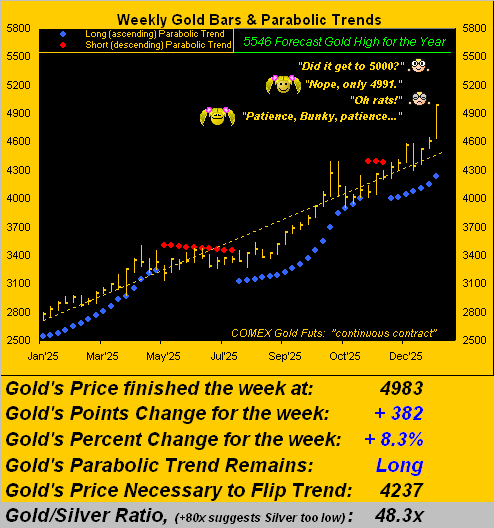
And speaking of scoring, let’s next pull up Gold’s weekly bars and parabolic trends from one year ago-to-date. Last week’s gain of +8.3% ranks fourth best century-to-date, (the best weekly gain being +13.1% for that ending 19 September 2008 when the Black Swan’s wings fanned the flames of the FinCrisis).
Today at 4983, Gold is +746 points above the chart’s rightmost blue parabolic Long dot at 4237, the hoovering of which in the ensuing week would flip the trend from Long to Short. Given Gold’s expected weekly trading range is now 206 points, such flip is well out of range. And toward reaching the 5000 milestone as early as Monday, (barring a severe gap down at the open), a mere +17 points from here is no more than trading noise, (Gold’s expected daily trading range per the website now being 101 points):
Looking StateSide, the Economic Barometer continues to gain traction. ‘Course, last week’s World Economic Forum featured President Trump, of whom we apolitically say, seemed to oversell the USA. A point thereto is in regard to (paraphrased) “inflation has come way down”. We’re not convinced. Remember as a consequence of the government “shutdown” there were at one point nearly 50 metrics missing from the Econ Baro; and whilst not all shall ever be known, the inclusive missing count has since been reduced to just 15.
And specific to the month of December, we’ve now a full 12 months of inflation data via the Consumer Price Index; (the month’s PPI shan’t be released until next Friday). But the CPI’s summation for the year is +2.9%, with December’s annualized pace alone at +3.6%. The last monthly data available for the “Fed-favoured” Personal Consumption Expenditures reading was November’s annualized pace of +2.4% (both “headline” and “core”). We’d thus opine that although inflation hasn’t really picked up, hardly has it come “way down”.
In turn, “down” shan’t be the direction of the FedFunds rate per next Wednesday’s Policy Statement from the Federal Open Market Committee. And as for the 14 metrics that did arrive for the Baro this past week, just four were worse period-over-period, albeit the majority of the reports were well in “shutdown” arrears. Here it all is from a year ago-to-date:
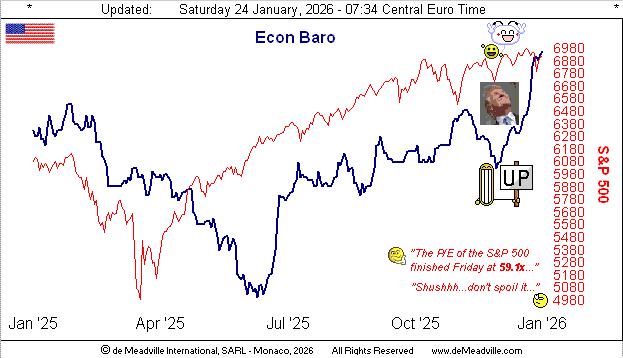
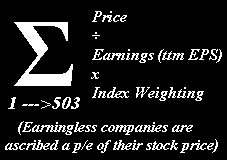
Note therein the reference to the “live” price/earnings ratio of the S&P 500 now at 59.1x. If you’ve forgotten the math, we’ve not forgotten it for you:
And yes, that p/e of 59.1x remains stratospherically excessive even as Q4 Earnings Season thus far has been very positive for the S&P: of the 46 constituents having reported, 74% have bettered their bottom lines from Q4 a year ago. But the overall high level of price — and thus practically no yield — inevitably is problematic given the yield in Treasuries remains more than triple that of S&P, and without risk of capital loss, (’tis assumed anyway…gulp…) But we get it: “Debt ain’t sexy.” So, cue Fleetwood Mac from ’76: “You can go your own way…”
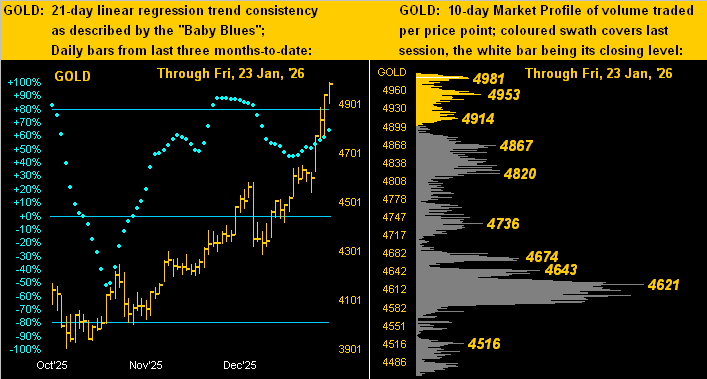
Looking at Gold’s way, ’tis obviously been “up, up and away!” Below on the left we’ve price’s daily bars from three months ago-to-date along with the baby blue dots depicting the day-to-day consistency of the regression trend: “Follow the Blues” indeed. And below on the right is the yellow metal’s 10-day Market Profile with selected price labels for volume-dominance. As for Gold’s “textbook technicals” (our cocktail of Relative Strength, Stochastics and John Bollinger’s Bands), price is nine consecutive trading days “overbought” irrespective of the separately-calculated overvaluations depicted in the opening Gold Scoreboard:
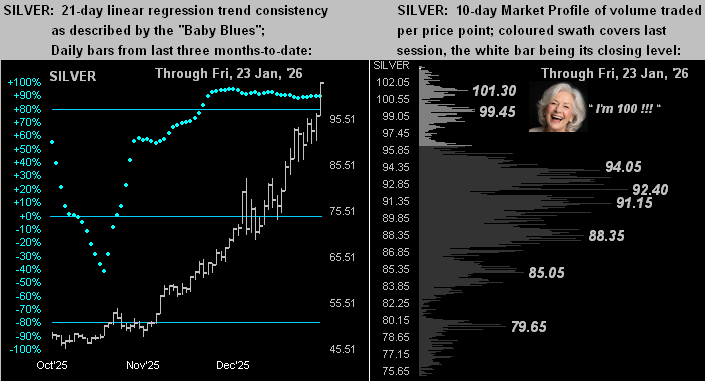
Sister Silver meanwhile owns the title of “Overbought” given her “textbook technicals” are now 49 consecutive trading days as such. And below (at left), her daily bars and “Baby Blues” are practically upside perfection, as in her Market Profile (at right) she’s lookin’ great at 100! “Brava Brava Sista Silva!”
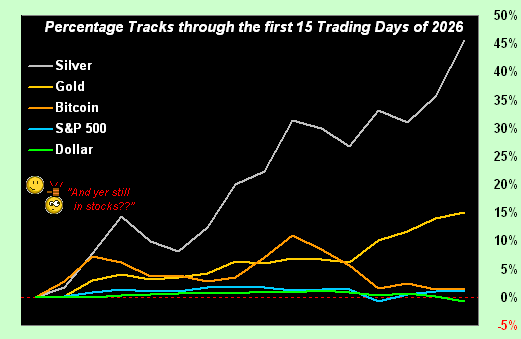
Into the new week, ’tis time for Gold 5000, (again barring “The Sell”). Gold has begun 2026 with a bang, indeed its best opening 15 trading days by percentage gain of any year so far this century, (which for you WestPalmBeachers down there is since 01 January 2001). And certainly the same (understatement) can be said for Silver, her having thus far gone nuclear! Regardless of what can be deemed as too far too quickly — especially with respect to overvaluation — we close with this graphic of the early year-to-date percentage tracks for each of Silver (+46%), Gold (+15%), Bitcoin (+1%), S&P 500 (+1%) and the Dollar Index (-1%):
‘Course with “only” 236 trading days remaining in 2026, what possibly could go wrong? For Gold and Silver the trend is Long!
Cheers!
…m…
www.TheGoldUpdate.com
www.deMeadville.com
and now on “X”: @deMeadvillePro
*******

Mark Mead Baillie has had an extensive business career beginning in banking and financial services for two years with Banque Nationale de Paris to corporate research for three years at Barclays Bank and then for six years as an analyst and corporate lender with Société Générale.
For the last 22 years he has expanded his financial expertise by creating his own financial services company, de Meadville International, which comprehensively follows his BEGOS complex of markets (Bond/Euro/Gold/Oil/S&P) and the trading of the futures therein. He is recognized within the financial community of demonstrating creative technical skills that surpass industry standards toward making highly informed market assessments and his work is featured in Merrill Lynch Wealth Management client presentations. He has adapted such skills into becoming the popular author each week of the prolific “The Gold Update” and is known in the financial website community as “mmb” and “deMeadville”.
Mr. Baillie holds a BS in Business from the University of Southern California and an MBA in Finance from Golden Gate University.


