All The Stock Charts Spell: B-E-A-R M-A-R-K-E-T


 In recent weeks there have been truckloads of rhetoric suggesting and wishing US stocks will continue to rise…or may soon fall. Needless to say, this is perplexing and confusing to the average investor, who is understandably indecisive of what to do….SELL, BUY MORE or GO SHORT. Consequently, the following analysis will use 6 charts rather than ambiguous verbiage to paint a realistically clear picture of the state of stock markets…and where they are probably heading.
Irrefutable Signs That A Bear Market In Stocks Is On The Horizon
There are a couple of Technical Indicators that clearly herald a topping in Wall Street stocks (i.e. DOW Index). One is the DOW/US$ Ratio and the other is the US Treasuries/DOW Ratio.
The DOW/US$ Ratio and US Treasuries/DOW Ratio simultaneously forecasted the Bear Markets of 2000-2002 and 2007-2008, when the DOW Index fell -38% in 33 months (2000-2002) and plummeted -54% in 18 months (2007-2008), respectively.
Well again recently both Technical Indicators are giving SELL SIGNALS FOR STOCKS.
DOW/US$ Ratio Chart –

US Treasuries/DOW Ratio –
A time proven axiom in Wall Street is to dump stock and buy US Treasuries when stocks are way over-valued relative to perennial safe haven T-Bonds. The chart below proves the wisdom of this prudent investor axiom.
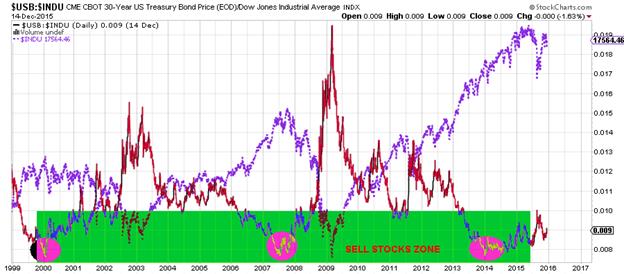
It is vitally imperative to notice that the T-Bond/DOW Ratio is again bottoming in the basement. Obviously, a BIG BEAR MARKET in stocks looms on the horizon…and indeed it has already begun…and will pick up lethal momentum in 2016…when complacent and ignorant investors will be left holding the bag.
The Pinnacle of Irrational Exuberance
The S&P500 is presently experiencing for the third time in the last hundred years, the highest returns for a 6-year period. Since 1907 this only occurred twice before: in 1929 and 1999. These extraordinary phenomenal returns have been fueled not by fundamentals, but rather by the US Federal Reserve, which has been trying to keep the economy afloat.

And history is testament that these periods of irrational exuberance and artificially generated levitations were almost immediately followed by CRASHING STOCK MARKETS. In the 1929-1932 Bear Market stocks crashed 89%...as measured by the DOW Index. During the 2007-2008 Bear Market stocks crashed 54%...as measured by the S&P500 Index.
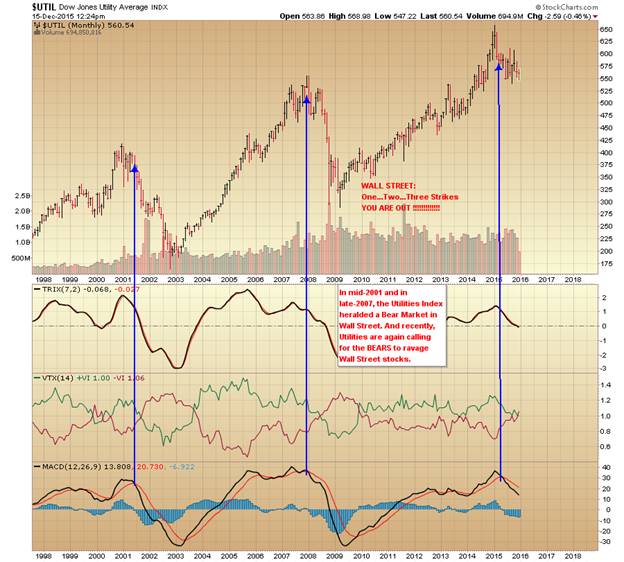
Utilities Index Often Heralds A Crash In The Stock Market
Utilities Index gave birth to the stock market crashes of 2001 and 2007. And don’t look now, because Utilities have again signaled the beginning of yet another stock market crash, where the bears will literally run amok in 2016.
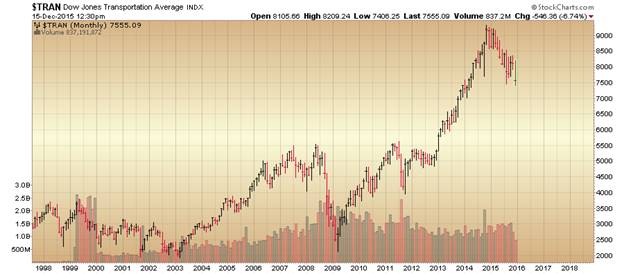
Likewise, The Transportation Index Often Heralds A Crash In The Stock Market
The Trannies led Wall Street stock down in the bear markets of 2000-2002 and 2007-2008. And look alert as the Trannies are again signaling a new bear market in stocks.
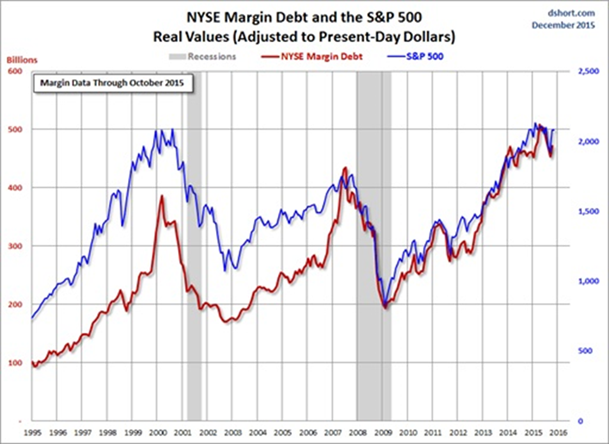
NYSE Margin Debt At An All-Time High Shouting BEAR MARKET
NYSE Margin Debt and the S&P500 demonstrate the profoundly over-leveraged condition of the market. Margin debt in real terms is now 20% greater than it was at the peak of the DOTcom bubble!
2016 Stock Market Outlook
Ambiguous rhetoric aside, the above six charts don’t lie or distort the truth. Clearly, the writing is on the Wall (i.e. Wall Street stocks are indubitably heading for a BEAR MARKET…because GREED AND COMPLACENCY will soon morph into FEAR AND ANGST.
Related Articles
The Looming Global Bear Market In Stocks
The Least Surprising Stat Of The Week: Corporate Insiders Are Dumping Their Stock
A Major Long-Term Momentum Indicator Is Flashing, “SELL.”
Are Stocks 80% Overvalued? New Evidence Shocks Wall Street
The Fed Has Set the Stage For the Next Stock Market Crash
US Stock Bubble Bursts As The US Fed Begins To Shrink Its Balance Sheet
This Economic Collapse Will Trigger A Stock Market Crash
The Mother Of All Bubbles Will Burst In Late 2015
Investors' Sentiment Worsens…New Downtrend Or More Fluctuations?


