Global Financial Breakdown Continues: Economic Growth Chokes On Massive Debt Increases


The US and global economies are choking on a massive amount of debt. While Wall Street and the Mainstream financial media continue to rationalize the skyrocketing debt as merely the cost of doing business, the disintegrating fundamentals point to an economic catastrophe in the making.
Of course, a full-blown economic meltdown may not occur this year or even next, but as time goes by, the situation continues to deteriorate in an exponential fashion. So, the cheerleaders for higher stock, bond, and real estate prices will continue to get their way until the economy is thrown into reverse as decades of increasing debt, leverage and margin finally destroy the engine for good.
Yes, I say for good. What seems to be missing from the analysis is this little thing called energy. The typical economist today looks at the global markets much the same way as a child who is waiting for the tooth fairy to exchange a tooth for a $20 bill. When I was a kid, it was $1 per tooth, but like with everything today, inflation is everywhere.
Mainstream economists just look at market forces, percentages, and values on a piece of paper or computer. When economic activity begins to fall, they try to find the cause and remedy it with a solution. Most of the time, the solutions are found by printing more money, increasing debt, changing interest rates or tax percentages. And… that’s about it.
There is no mention of what to do with energy in the economist’s playbook. For the typical economist, energy is always going to be there and if there are any future problems with supply, then, of course, the price will solve that issue. Due to the fundamental flaw in omitting energy in College economic courses; the entire profession is a complete farce.
Unfortunately, even the more enlightened pupils of the Austrian School of Economics fail to understand the Thermodynamics of value. Instead, we are only taught about SUPPLY & DEMAND to impact price. While supply and demand forces impact price, they only do so over a short period of time. However, the primary factor that determines price (for most goods, services, commodities, metals & energy) is the cost of production. Supply and demand only pull price above or push it below the cost of production trendline.
Regardless, you don’t have to take my word for it, just look at the following charts below.
US Debt Per Dollar Of GDP Growth Goes Ballistic
The days of issuing a $1 of debt to get $1 or $2 of economic growth are long gone. Most may believe this was a grand conspiracy by the elite to control the masses. However, it was more a function of the Falling EROI – Energy Returned On Investment and the Thermodynamics of oil depletion. As the cost to produce oil consumed more energy, well, the best way to offset that was to issue more debt.
The following chart shows the relationship between total U.S. debt from all sectors (public and private) versus domestic GDP:
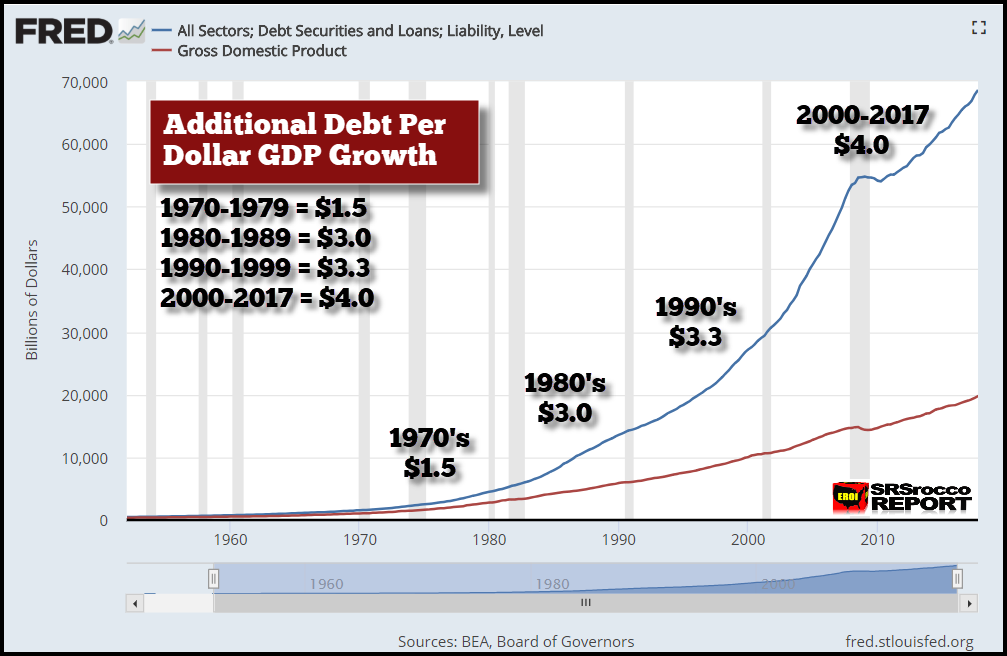
Total US debt from all sectors is shown in BLUE while the US, GDP is in BROWN. You will notice that the total debt and GDP from 1950 to 1970 remained pretty even. It wasn’t until after 1970 did the debt increase more than the GDP. That was due to two reasons
-
The US Peaked in conventional oil production in 1970
-
The US EROI of oil fell considerably after 1970
Now, I did not include Nixon dropping the Gold-Dollar Peg in 1971, because that was a direct result of the two reasons listed above. We must understand that financial and economic policy is a direct reaction to the change in energy…. and not the other way around.
So, for the United States economy to offset falling oil production and the EROI, it was forced to add more debt per Dollar of GDP growth. In the 1970’s it took an average of $1.5 of new debt for each $1 of GDP growth but then doubled to $3 of debt per GDP growth in the 1980’s. However, debt really took off after 2000.
According to the data put out by FRED, the St. Louis Fed, the U.S. GDP increased from $10 trillion in 2000 to $19.7 trillion at the end of 2017. However, total U.S. debt (all sectors public and private) increased from $27.2 trillion to a staggering $68.6 trillion during the same period. Thus, total US debt increased by $41 trillion versus approximately $10 trillion in GDP growth. That turns out to be $4 of debt for each $1 of GDP growth.
We also must consider the annual interest expense on the total U.S. debt of $68 trillion to be approximately $1.4 trillion based on a 2% interest rate. I have no idea what the average interest rate is on $68 trillion of debt and liabilities, but if the average interest rate rises to 5%, then the annual interest expense blows up to $3.4 trillion. As they say, a trillion here and a trillion there… adds up.
Unfortunately, the US will not have the available cheap energy in the future to pay back this debt. Thus, as debt implodes, so will the GDP. Furthermore, if we were to adjust the GDP by the additional credit and debt, it would be a hell of a lot lower than its current value. But of course, the GDP figures are calculated by the very economists who are taught to disregard energy in their market studies in college.
Global Debt Per GDP Growth Hit A Record In 2017
According to the IIF, Institute of International Finance, total global debt reached a new record high of $237 trillion in 2017, up $21 trillion from the previous year. Now, compare that to the global GDP growth of $3.9 trillion in 2017, ($75.4 trillion in 2016 to $79.3 trillion last year). If we divide the $21 trillion of new global debt by the $3.9 trillion in global GDP growth, it equals an additional $5.4 for each new $1 of global GDP growth.
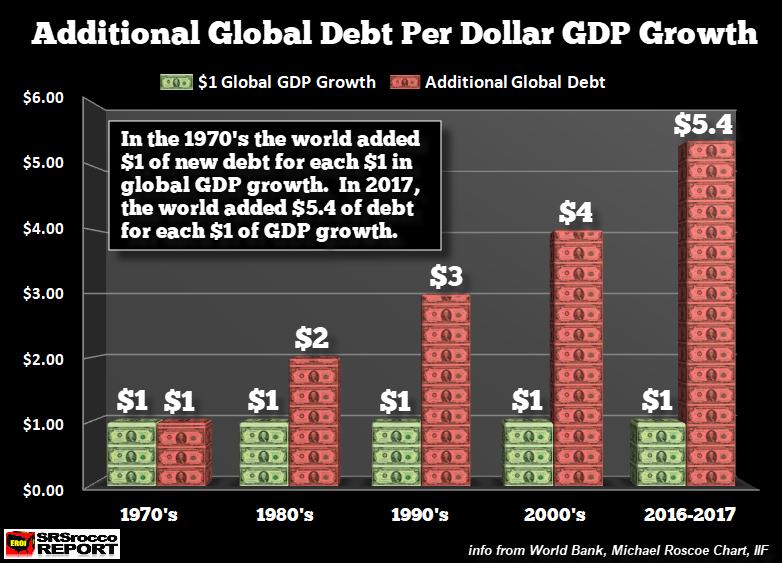
I arrived at the figures in the chart above the very same way as the US Debt per GDP growth chart. Even though the values in the graph suggest that the debt per Dollar of GDP growth continues to move up at an ever-increase rate, the annual changes are more volatile. For example, the average global debt per Dollar of GDP increased more during the 2000-2009 period than from 2010-2017. This was also true for the United States.
However, the annual interest expense on global debt of $237 trillion has to be one hell of a lot. Again, I have no idea what the average interest rate is on that debt, but even if we assume a conservative 2%, that is $4.7 trillion. How could the world afford $4.7 trillion of an interest expense if the increase in global GDP was only $4 trillion last year???
Please understand, I am only making simple assumptions here. If the global debt is increasing, so must the interest expense to service this ever-increasing amount of debt. When the debt service starts to compete with global GDP growth, then we have a serious problem. And with the impact of the Falling EROI and Thermodynamics of oil depletion, global GDP growth will likely begin to stall over the next few years.
The notion put forth by some precious metals analysts that if the corrupt banking system would be allowed to go bankrupt (as it is bankrupt), then after the pain, the U.S. economy could grow once again. That will never happen. Why? Many in the alternative media and precious metals community still don’t understand the dire energy predicament. So, much like the college trained economists, they are making the same mistake by analyzing and forecasting the future of the markets without considering energy.
Unfortunately, when the massive amount of debt finally implodes, it will take down the values of most Stocks, Bonds, and Real Estate. This is not a matter of “IF,” it’s a matter of “WHEN.” And it seems as if the WHEN is quickly approaching.
Check back for new articles and updates at the SRSrocco Report.

Independent researcher Steve St. Angelo (SRSrocco) started to invest in precious metals in 2002. Later on in 2008, he began researching areas of the gold and silver market that, curiously, the majority of the precious metal analyst community have left unexplored. These areas include how energy and the falling EROI – Energy Returned On Invested – stand to impact the mining industry, precious metals, paper assets, and the overall economy. He has written scholarly articles in some of the top precious metals and financial websites. Visit his website SRSrocco Report.


