Gold’s Key Weekly Trend Flips Short


Welcome to the 16th Anniversary Edition of The Gold Update. What began 835 Saturdays ago on 21 November 2009 as a single paragraph and chart for one JGS has since evolved (in our proud opinion) to the finest weekly writing in the known universe as regards the current stance of the price of Gold. And our humble thanks to those of you who have expressed words to that effect over these many years. On with the show.
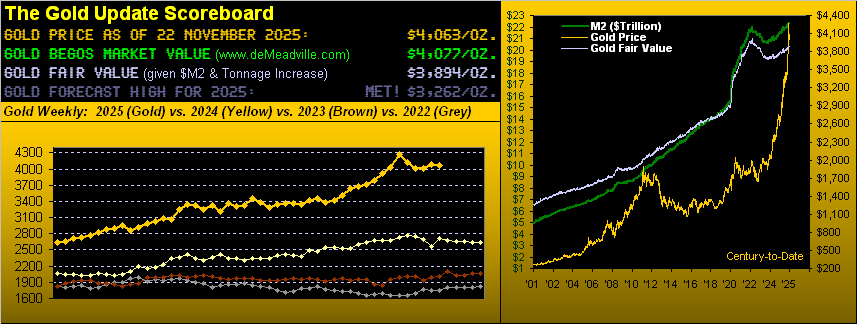
As anticipated in recent missives, Gold’s weekly parabolic trend — after an amazing 17-week run on the Long side — yesterday (Friday) confirmed the awaited flip to Short. For those of you scoring at home, the flip provisionally arrived this past Tuesday at 04:20 GMT per our post on “X” (@deMeadvillePro), Gold having penetrated below the protective parabolic price of 4004. Gold then moved on to settle its fourth down week in the past five at 4063, which by the above Scoreboard is nonetheless still +169 points (+4.3%) over Fair Value (3894). So some additional pullback wouldn’t be untoward.
Yet across the past two years, weekly parabolic Short trends for Gold have been great news!
“Because in each one of those, price hasn’t really gone down a lot, right mmb?”
Conclusively correct, Squire. But before providing that proof, let’s first below go to Gold by the week from a year ago-to-date, wherein encircled above the rightmost bar we now have the first red dot heralding the commencement of this new Short trend; too, we’ve drawn a structural support line at 3534:
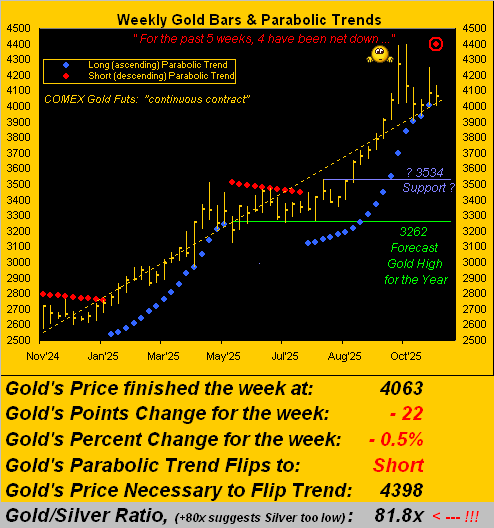
Regardless: if this fresh Short trend is anything similar to the past four Short trends during the last two years, Gold may hardly fall at all! Let’s go inside the numbers.
The following table depicts each weekly parabolic trend (alternating Long…Short…Long…et cetera) for said two years. Note the “Duration” column: the five Long trends have each lasted 16-17 weeks (how consistent is that!) whereas the four Short trends have paled in length. Moreover: look at the fabulous maximum gains of the Longs vs. comparatively “zilch” (technical term) for the Shorts. However, should such ShortSide adversity continue, does Gold reach down to that 3534 support level? By these mathematical parameters, no:
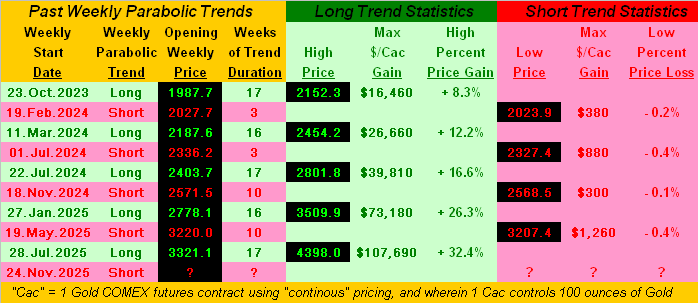
As for the most recent (now complete) Long trend, that maximum gain of $107k (were you impossibly prescient to have exited at the high) is not a typo. To trade one Gold contract requires initial margin of $17k to control 100 ounces. Per the opening price (as shown) of 3321 up to the All-Time High at 4398 = +1,077 points x $100/point = $107k for a +629% leveraged account gain in just 60 trading days (from 28 July to 20 October). Unleveraged, even just a single one-ounce Gold coin gained +32%. As for the herd’s “Nuthin’ but Nvidia!” (NVDA) across that same stint? +6.4%. Which one did you have?
All that said, Gold can of course have a far more negative Short trend than has been the case these last two years. Not that you wish to be reminded, but from 05 November 2012 to 03 June 2013 Gold went on a 31-week parabolic Short trend within which price plummeted -21%; a repeat of that from here (4063) would place Gold back in the low 3200s. But as firmly flies Gold’s fundamental flag, let’s even see if support at 3534 actually gets tested. For across the past two years, the parabolic Short trends have been buying opportunities for Gold rather than price plunges.
And an initial price for which to watch is a retest of 3901, which is the intra-day low of 28 October, following Gold having made that recent All-Time High at 4398 back on 20 October.
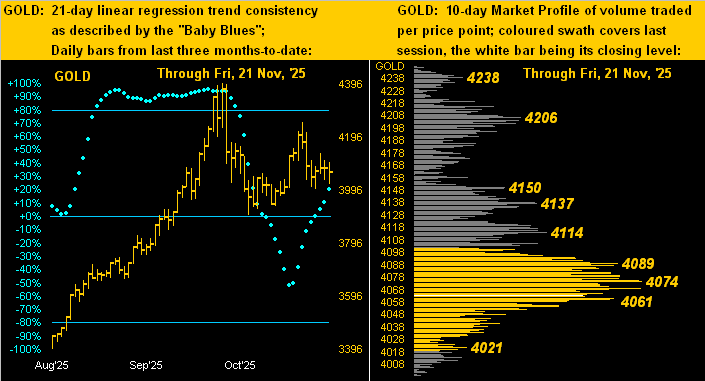
Such negative notions notwithstanding, you know the rule: “Follow the Blues instead of the news, else lose yer shoes.” And thus contrary to Gold’s new parabolic Short trend, we next view the following two-panel graphic of the yellow metal’s daily bars from three months ago-to-date on the left and 10-day Market Profile on the right. Clearly therein, the “Baby Blues” of regression trend consistency are rising … but such rise may be short-lived (pun intended) unless Monday is a substantive up day. As for the Profile, price at present is churning about in the 4089-4061 volume-dominant congestion zone:
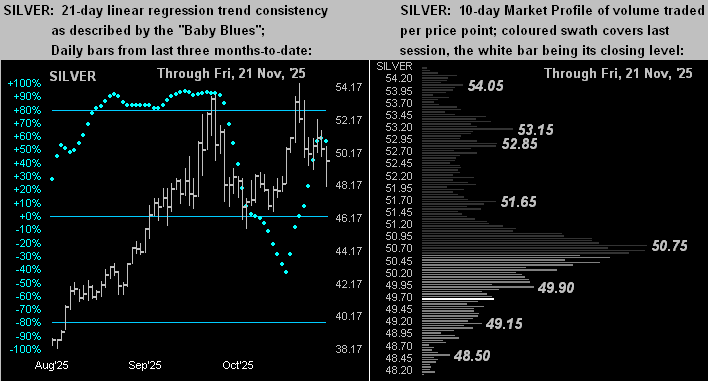
Further, with the same graphical layout for Silver, her “Baby Blues” (below left) already have just kinked a notch lower (albeit barely so per the rightmost blue dot). And by the white metal’s Profile (below right), 50.75 is the most volume-dominant overhead resistor, price having settled the week at 49.66. But as Gold has come off from the prior week, more so has Silver: just back on 12 November, the Gold/Silver ratio was 78.9x, its lowest reading in better than a year. But through these last seven trading days wherein Gold has dropped -3.3%, Silver has fallen -6.7%, the ratio thus having increased to now 81.8x. Poor ol’ Sister Silver! ‘Course year-to-date, she’s up “only” +69.5%!
Turning to the economy and stock market, as stated on the next graphic we’ve still 46 missing Economic Barometer metrics — some of which according to the Bureau of Labor Statistics shan’t ever be calculated — due to the recent StateSide government “shutdown”. Still, last Thursday came a “data dump” for seven weeks of back-dated Initial Jobless Claims. And all told for last week, 21 metrics hit the Baro of which 13 improved period-over-period: thus we’ve the up lurch in its blue line, even as the S&P 500 came further unglued. At least we can look forward to the Santa Claus Rally, right?
“Uh, those don’t always happen, mmb…”
Squire (as usual) has the facts at his fingertips: for the S&P’s 24 Decembers century-to-date, eight (33%) have been net negative. Sorry, Santa, should it not ensue. Meanwhile, here’s the Baro to view:
Too, this past week brought the conclusion of Q3 Earnings Season: for the S&P’s 503 constituents, 448 reported in the seasonal timeframe, of which an admirable 71% improved their bottom lines over Q3 a year ago; we say “admirable” as the average such improvement for the last eight years is 66%. However: it remains problematic that the overall level of earnings is still way too low to maintain the stratospheric valuation of the S&P, the honestly-calculated “live” price/earnings ratio now 51.5x, and the Index all but yield-less (1.202%).
As for Gold, we’ll watch how the new Short trend unfolds. If such history from the past two years holds, for buyers ’tis a time to be bold! Nonetheless, in any event, hang on to your Gold!
Oh Squire, you shouldn’t have… Rather, go fetch the rain-chilled Taittinger!

Cheers!
…m…
www.TheGoldUpdate.com
www.deMeadville.com
and now on “X”: @deMeadvillePro
********

Mark Mead Baillie has had an extensive business career beginning in banking and financial services for two years with Banque Nationale de Paris to corporate research for three years at Barclays Bank and then for six years as an analyst and corporate lender with Société Générale.
For the last 22 years he has expanded his financial expertise by creating his own financial services company, de Meadville International, which comprehensively follows his BEGOS complex of markets (Bond/Euro/Gold/Oil/S&P) and the trading of the futures therein. He is recognized within the financial community of demonstrating creative technical skills that surpass industry standards toward making highly informed market assessments and his work is featured in Merrill Lynch Wealth Management client presentations. He has adapted such skills into becoming the popular author each week of the prolific “The Gold Update” and is known in the financial website community as “mmb” and “deMeadville”.
Mr. Baillie holds a BS in Business from the University of Southern California and an MBA in Finance from Golden Gate University.


