Gold And Silver: Trend Change Developing, Just Not Confirmed.
 share
share
 share
share
 share
share
 share
share
 share
share
 If you never read a newspaper, listened to television/radio, or read any one of the numerous blogs that exist and were left with just charts to look at, the information contained in the them would put you head and shoulders above everyone else.
Why?
Charts contain the resulting input from all the decision-makers, from the most informed to the least informed, and the aggregate information that can be gleaned from news, regardless of source, including blogs and so-called expert opinions can not be superior to that combination of price and volume over time, found in the charts.
There has been a smart rally over the past two months, but far from the strongest and the most dollar gain. It is still occurring within the confines of a protracted TR [Trading Range]. The June and December 2013 respective rallies gained much more, and the current rally may as well, but we can always only deal with what is known and not what may or may not come to pass.
Price has rallied just above the 50% of range level, but the past three week rally has overlapping bars, more a sign of struggle between buyers and sellers, by contrast with bars that have much less overlap, like the rallies of January and July 2012. A better example would be the decline from the March high on the daily chart below. The ease of movement is much clearer to the downside. This does also happen in rallies, just not yet in gold.
It cannot yet be determined if this will lead to a change in trend, hence the NMT, or Needs More Time. The daily chart may provide better clues.
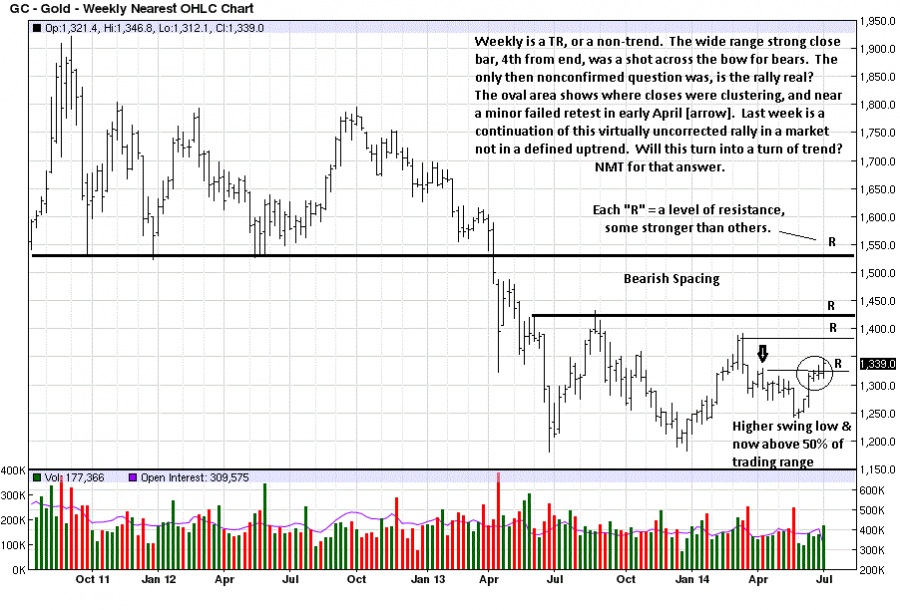
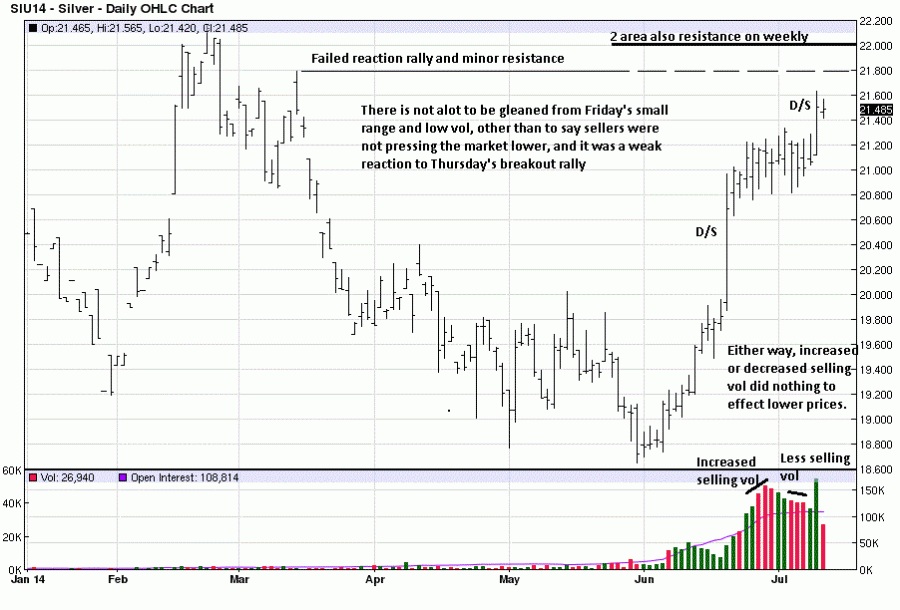
D/S = Demand overcoming Supply, [determined by a very wide range bar, strong rally and close, typically on a large increase in volume], followed by 13 TDs [Trading Days], of mostly overlapping bars. In an up trend, this would have been a no-brainer to buy into. In a TR within a larger down trend, it becomes riskier. We have attempted long positions in both gold and silver on apparent strength, in the recent past, with poor results. Whenever anything is in the middle of a TR, the level of trading knowledge is at its lowest, and one should be more cautious and respect the trend.
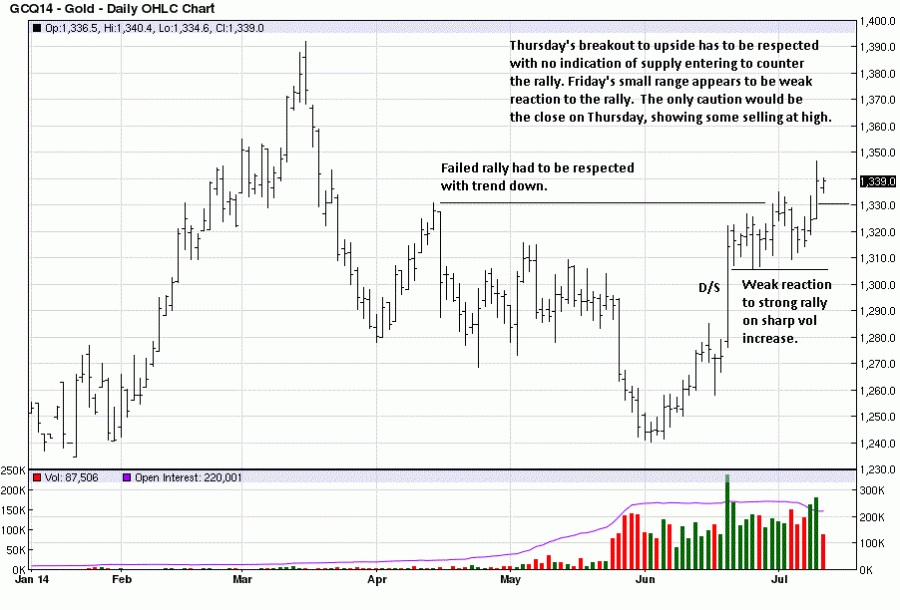
Last Thursday’s high volume, wide range breakout is hard to ignore. The question then becomes, How to establish a long position [in futures]? What most people do not know or understand is how one form of market activity confirms [or negates] what preceded it.
The 19 June D/S needs to be confirmed. The confirmation is typically a weak reaction, lasting between 3 – 8 TDs, and on smaller range down bars and less volume. This says sellers are weak. If during the course of a correction the down bars are wide and volume increases, the rally will not likely stand. You do not need to read about anything in the news to know this. It is the activity market itself that makes this information known, first-hand, as it develops.
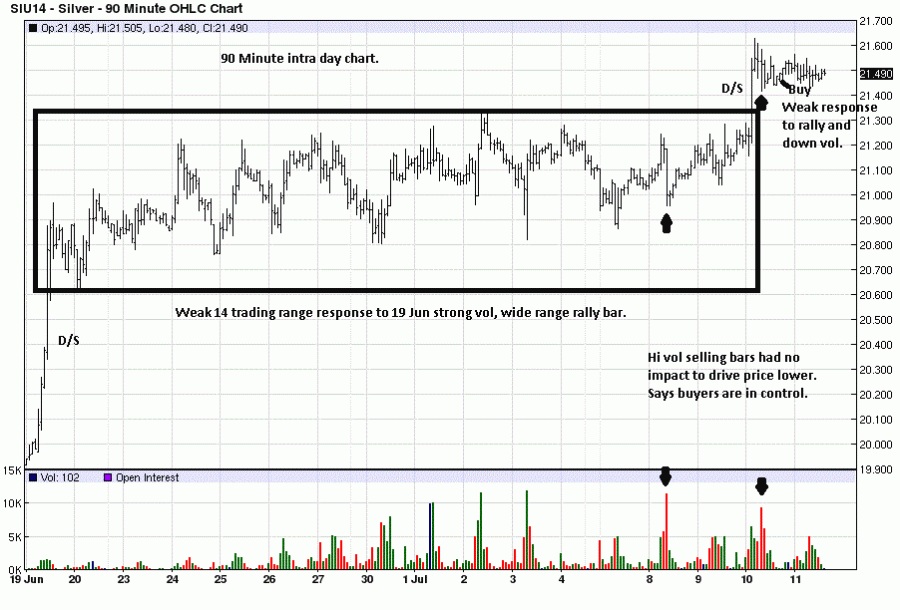
Thursday’s upside breakout on increased volume gave the green light to get long, if one did not use the previous information of the past few weeks to do so. Intra day activity will show this in greater detail.
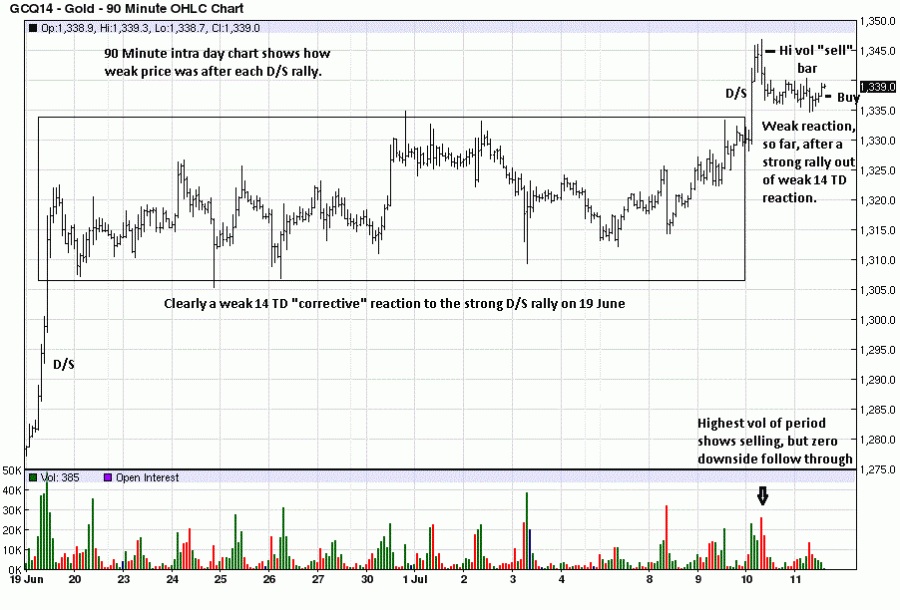
After the 19 June then surprise strong rally, price moved sideways for two weeks of TDs. This was clearly a weak reaction, but occurring in a sideways to down trend, depending on which time frame used, but not up, in any event. There was still a possibility that the sideways activity could lead to another turn down. Mention for context must be made that weak reactions to price rallies, more especially in
an up trend, lead to higher prices. This market premise does not always hold as true in a down trend.
Confirmation that the weak reaction would lead to higher prices came on the 10th, last Thursday, with another D/S bar upside breakout on increased volume. The clinching clue comes from the highest intra day negative volume, see arrow. There was no further downside, and that is the market letting us know that the selling was from weak holders and the buying was going into strong hands. This confirms the same thing from starting on 19 June.
The smaller intra day correction that held above the breakout was used to establish an entry with about a $1,000 risk. Odds favor higher prices next week, but nothing is ever guaranteed. How the market activity develops in the days and weeks ahead will provide all the information/confirmation needed.
Of course, this is good news for holders and buyers of physical gold, and eventually higher prices will prevail. By holding physical, market corrections are less important, as is true of timing. The stage is set, and gold has never failed to preserve value, even increase worth, historically speaking.
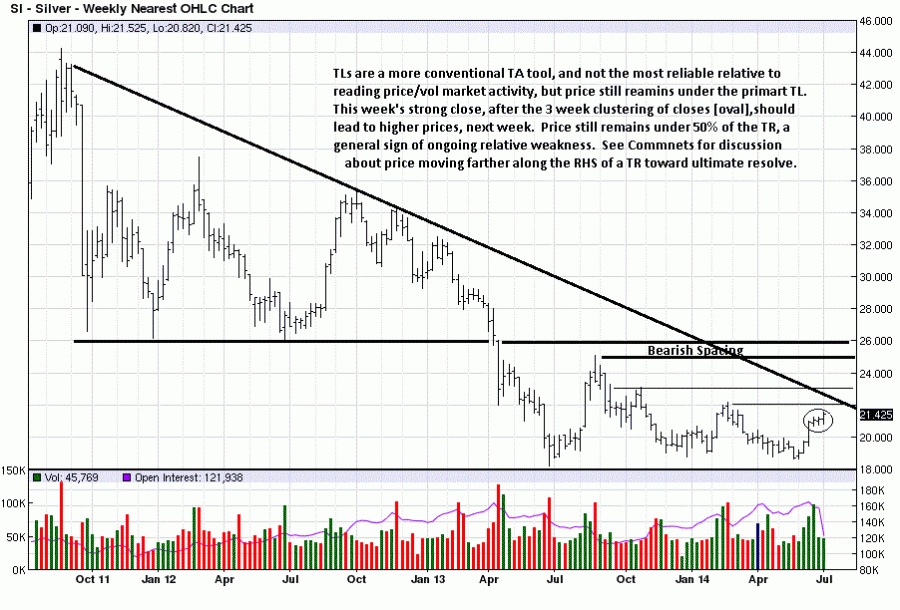
Silver has yet to break its primary down trend line, but developing market activity preceding it will give advance notice, as discussed in gold. Silver has been in a TR without turning up. There is no known formula for how long a TR will persist. What is known for certain is the farther price moves along the RHS [Right Hand Side], of a TR, the closer it comes to reaching an eventual resolve.
The market will provide clues as to the when, a few of which were discussed in gold. There are numerous ways in which a market conveys solid information, and one has to exercise a lot of patience to follow the market’s lead, as opposed to one’s own preferred time frame of sooner rather than later.
Here again, knowledge of the fundamentals has not been pivotal in discovering the “when” factor. Even those with the greatest expertise, or the most detailed information have been way off in timing, as often happens. Despite the numerous calls for much higher prices over the past few years, the market’s TR has been the most reliable of all indicators that higher prices will not come unless and until price successfully moves out of the TR to the upside. Sentiment aside, there has been no confirming evidence of that.
The clustering of prices over the past few weeks, followed by last weeks upside breakout is a potentially positive sign. There are sill many overhead obstacles, and how the market behaves when approaching them will give us the best information of what to expect.
Silver’s slightly stronger reaction to the 19 June D/S rally bar gave stronger reason to take a long position in the futures. Our more conservative approach of waiting for a correction that leads to stronger likelihood of upside continuation occurred in overnight trade that increased the risk for regular trading hours. There were one or two occasions when we almost pulled the trigger, but hesitation while the market rallied kept increasing the risk exposure. The trend is not up, so there will be many more occasions while waiting for an edge.
When you see increased volume on sell bars [those with a close lower than the preceding bar], and/or selling volume diminish on down bars, it is an indication that sellers are not actively in control, and price needs to rally higher to uncover new selling efforts. This is how to use the information the market provides in order to take a position and possibly obtain a trading edge.
The second D/S rally bar gave another, albeit higher entry opportunity.
Contrary to the 90m intra day gold chart, silver’s high volume sell off attempt, on the 10th, closed just marginally lower than the preceding bar, but more importantly, on the high-end of the bar itself, a clear sign that buyers had overwhelmed sellers and took control. It was sufficient confirmation that the previous TR formation was likely accumulation.
By observing the highest intra day volume bar was to the downside, and seeing there was zero follow through lower, the market was telling us the increased volume came from weak sellers, weak longs taking some short-term profits, and buyers were of the strong hand kind. That indicated that price would not likely continue lower, and for the day, at least, we were seeing what should amount to a successful retest of the upside breakout. This was for the futures market.
Another piece of information taken from the market is that when selling at one level does not move price lower, expect continuation to the upside that will eventually uncover the price level that will induce sellers and create resistance
Being long physical silver, always advocated as the smartest financial decision to make by getting rid of the overinflated fiat paper Federal Reserve Note, has been more rewarding the past few months, and that will continue with each new passing week or month.
As the read of developing activity in price and volume proves, the market sends out the best and most reliable information, and the information sent each day supersedes all other sources. Markets never lie.
share
share
share
share
share


