Gold Battles For The Northern Front (1750-1800)


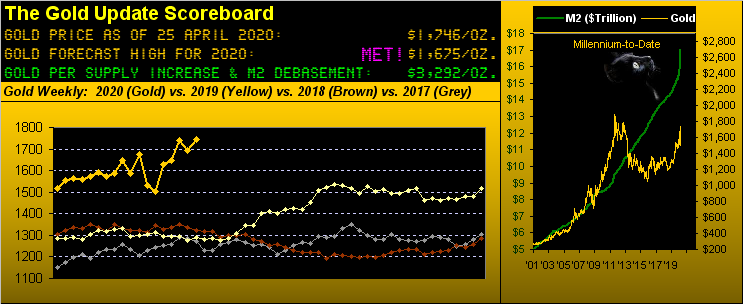
A favourite expression of dear old Dad toward successfully achieving one's goal was to "be in there battling", enhanced with a few hand claps, before shuffling back into his library. And in settling out this past week yesterday (Friday) at 1746, Gold -- albeit rather modestly -- again dipped its toe into The Northern Front (1750-1800), so-named by the significant, climatic battling therein from November 2011 into November 2012, (in turn heralding the massive multi-year fall in price down through 1046 come December 2015).
'Course as you regular readers have come to know, we refer to the vaster underlying structural area (1579-1750) as Gold's being "...on maneuvers", the preparatory range for ultimately regaining The Northern Front. And since Gold closed above 1700 this past 06 April for the first time in better than seven years, given all the overhead technical resistance of The Northern Front, price has nonetheless managed to therein sporadically trade on seven different days across the past 11. But Gold's best efforts thus far to "be in there battling" have been repelled by the resistance.
Indeed you'll recall from last week's missive the respective "Sell" signals we received for Gold to trade down into the mid-1600s (reaching to as low as 1666 this past Tuesday) and for Sister Silver to trade down into the mid-14s (reaching to as low as 14.56 as well this past Tuesday before returning up to close her week at 15.36).
However: the good news for both precious metals is the ongoing parade of governmental and sovereign bank accommodation. At least Stateside, the piling on continues with another $484 billion bringing the legislative-approved total to some $3 trillion; whereas across the pond, Lagarde & Co. are grappling on how to pursue the recovery financing, the European Central Bank printing up some €1.1 trillion to purchase government debt. We recall back at the century's turn our notion of the EuroZone concept lasting perhaps some four years; instead 'tis 20+ ... but when issues of money are materially made manifest such that it could all go kerplooie (technical term), mind your dough, in this case the Euro as 'tis not that far from multi-year lows. "Oh that damn Dollar strength!" Well, we're actually seeing that within the Dollar Index despite the buck's diabolical debasement. But as the NASCAR announcer inevitably shall pronounce, "It done blowed up!", be it comin' outta Turn 4 at Talladega, or an overheatin' money-printin' tumbler at a mint near you.
"These days it is just an accounting entry, mmb..."
Metaphorically speaking of course, Squire. The bottom line is that upon the bust of currency trust, be it the Euro, Dollar, Yen, Sterling, Yuan, Riyal or Rupee, the price of Gold shall respond "Whoopie!" Or as our "founding reader" (JGS) of The Gold Update put it: "One day Gold will simply open $1,000/oz. higher than where it closed the day before." (See bits**t).
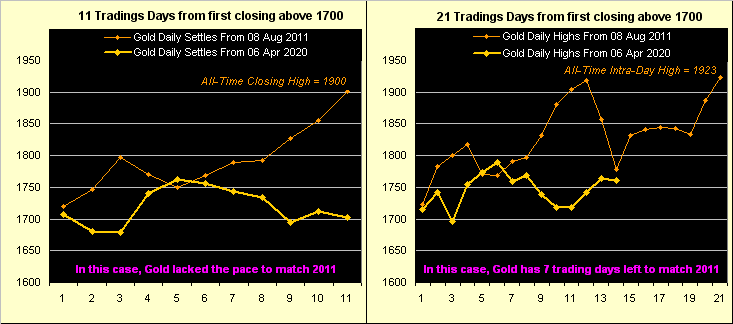
As for "The Now", here is our update for how Gold has comparably progressed since closing above 1700 this past 06 April versus doing same from the first time way back on 08 August 2011. Below on the left we see that on a closing basis, this time 'round Gold sported nowhere near the upside energy to race (as it did in 2011) from 1700 to 1900 in just 11 trading days. But on the right we find by Gold's daily highs that 'tis still in the game ... (sorta kinda maybe but not really) ... to reach 1923 in a like 21-day run to that seen in 2011. 'Course the difference is that back then, overhead resistance didn't exist:
"But when will it get up there, mmb?"
'Tis always about the "when" rather than the "if", eh Squire? But smug Smart Alec has the correct answer: Gold shall reach and pass up through the All-Time High of 1923 "when" enough trading "umph" takes out the corresponding overhead price offers. In fact... "Miss Gibbs, might you kindly ring up our Bern buddies over there in the Bundesplatzat at Schweizerische Nationalbank and tell them to get with the program? What's that? They're all at home? Rösti and raclette is it. Ok, thank you." {Sigh}.
Over which not to sigh is the graphic of Gold's weekly bars and parabolic trends from one year ago-to-date. On balance 'tis a healthy picture although clearly evident is the recent few weeks' pricing gyration per the rightmost three bars. At this date one year ago, Gold's "expected weekly trading range" was 24 points; now 'tis 99 points and the "expected daily trading range" alone is 45 points. That's a lotta points and reflects why (as we detailed two missives ago) day trading margins have increased upwards of sixfold, (i.e. ya gots to pay to play, baby):

To the Economic Barometer we go, for which one can say "Oh No!", (not that we didn't know). And that wee chap at lower right is stepping out of the way none too soon as his present place in a week's time we 'spect shall be replaced by the diving blue line. No less than 14 metrics shall contribute to the Baro in the new week, in the midst of which on Wednesday comes the Federal Open Market Committee's Policy Statement plus Chair Powell's presser. What say, eh, Jay?
As for the S&P 500 (the red line in Econ Baro graphic), 'tis taken on the like negative technical condition which a week ago led to the precious metals' early week move lower: per the Market Trends page at the website, the S&P's "Baby Blues" which measure trend consistency have dropped below their key supportive +80% level. Also we've the negative fundamental condition of the worst Q1 Earnings Season (early as 'tis) we've seen since at least Q2 of 2009: thus far for the 102 reported constituents, only 40 (39%) have beaten their Q1 bottom lines of a year ago. (Again, we're not harping too much on the excessively high "live" price/earnings ratio of 35.5x given the near-zero interest rate environment).
Further -- and contra to conventional wisdom -- Gold, the S&P and the Dollar across the past 21 trading days (one month) have been in fairly positive correlation as we next see by their percentage tracks, the thought there being should one descend, so shall the other:
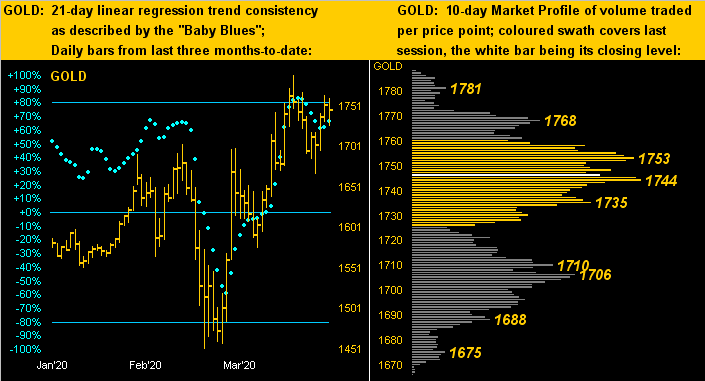
Now having just mentioned the "Baby Blues" for the S&P 500, here they are at left in our usual portrayal for Gold, again emphasizing the blue dots having slipped below their key +80% axis; meanwhile at right is Gold's 10-day Market Profile with the depicted trading apices born of acute volume essentially all over the place, (the technical term there being "mm": messy market):
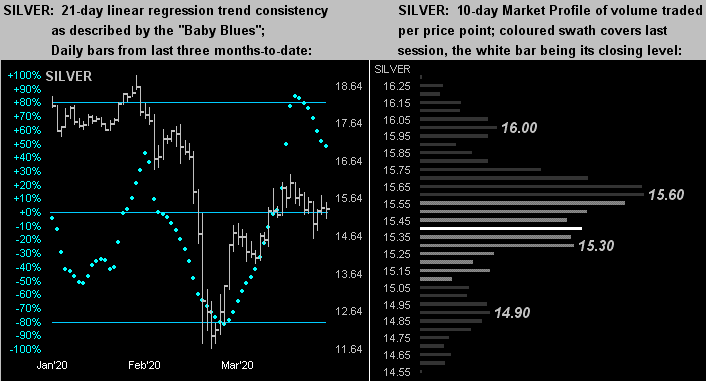
Not surprisingly, the like two-panel graphic for Silver appears rather dicey, her "Baby Blues" continuing to drop, with dominant trading Profile resistance depicted at 15.60. Worse, unlike Gold's three-month trend being positive, that for Silver is negative. Is it any wonder the Gold/Silver ratio is 113.7x? Poor ole Sister Silver!
To close we've these few observances:
■ The good folks over at Seeking Alpha ran a piece as to the S&P "approaching a bear capitulation point." Could well be, but we've not seen any massive volume association thereto; indeed daily S&P trading volume at least by its futures contract has returned to what was often typical pre-COVID: but the placement of orders is across a much wider pricing range (see, too, the website's Market Ranges page), such thinness resulting in ramped-up trading volatility. Still, have a peek back up at the Econ Baro chart: the S&P's sharp vee-bottom on 23 March has that capitulative look, BUT ... nobody knows ...
■ These days, to use a favourite quip of ours, everybody is scoring at home: or at least investing professionals are trying to so do. Reuters ran a rather cautionary piece that "Trading worth billions of dollars has shifted to kitchen tables or bedrooms as traders work through the coronavirus crisis from home..." Be wary of using your personal phone there, what? (...hint-hint, nudge-nudge, elbow-elbow...)
■ Finally, a long-standing measure for valuing Gold has met its match: the infamous Gold/Oil ratio. Bluntly, when the ratio is in the 10s-20s, Gold is thought to be more lowly-valued; when in the 30s-40s, Gold is thought to be more highly-valued. Thus in preparation for making or taking delivery in one's super shiny oil tanker truck down there at Cushing, OK, the May contract's price achieving zero ("0") this past Monday correspondingly valued one's Gold as infinite ("∞")! Oh c'mon, Squire... Either way, just "be in there battling!"
www.deMeadville.com
www.TheGoldUpdate.com
********

Mark Mead Baillie has had an extensive business career beginning in banking and financial services for two years with Banque Nationale de Paris to corporate research for three years at Barclays Bank and then for six years as an analyst and corporate lender with Société Générale.
For the last 22 years he has expanded his financial expertise by creating his own financial services company, de Meadville International, which comprehensively follows his BEGOS complex of markets (Bond/Euro/Gold/Oil/S&P) and the trading of the futures therein. He is recognized within the financial community of demonstrating creative technical skills that surpass industry standards toward making highly informed market assessments and his work is featured in Merrill Lynch Wealth Management client presentations. He has adapted such skills into becoming the popular author each week of the prolific “The Gold Update” and is known in the financial website community as “mmb” and “deMeadville”.
Mr. Baillie holds a BS in Business from the University of Southern California and an MBA in Finance from Golden Gate University.


