Gold Market Update


We have recently maintained a neutral/bearish stance on gold, which was not unreasonable given the way the earlier advance had petered out and been followed by weakness resulting in the failure of a long-term uptrend line that signaled a change of intermediate trend from up to neutral/down. However, the subsequent lack of downside follow through to break the price below key support at and above its long-term 200 and 200-day moving averages, combined with emerging evidence of significant accumulation of large Precious Metals stocks has justified a review and a shift in stance to neutral/bullish. This last statement does not imply that an insipid, vacillating approach is the order of the day. On the contrary, even though we continue to recognize that it could yet break down, the proximity of strong support and the luxury of the highly favorable risk/reward ratio that this affords by means of the setting of judicious stops, means that it is makes strategic sense to go long here with a gusto.
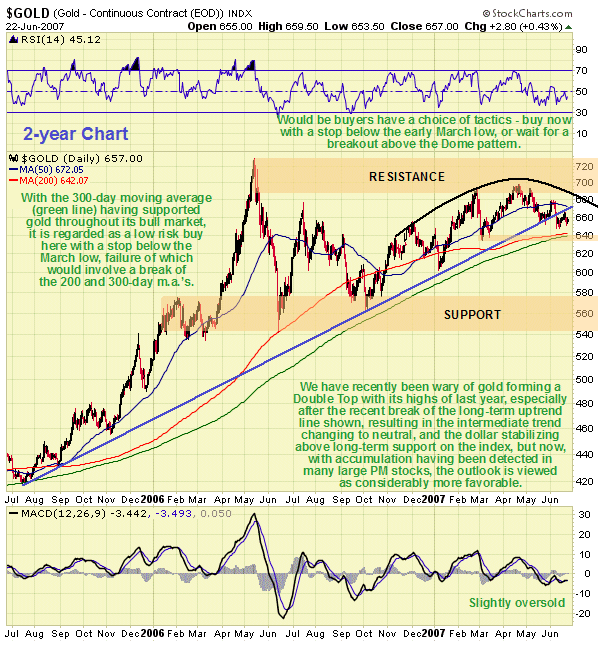
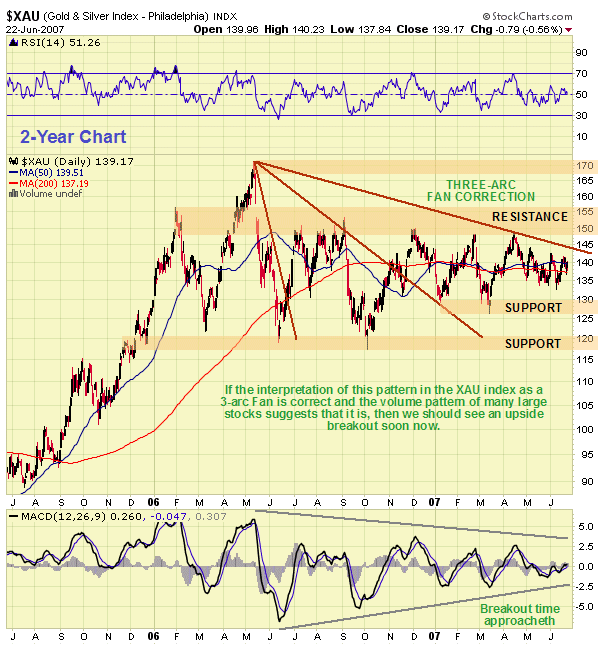
On the 2-year chart we can see how, shepherded higher by its rising long-term 300-day moving average, gold trended upwards earlier in the year towards last year’s highs but before getting to them it weakened and rolled over beneath a “Distribution Dome” in a zone of strong resistance, leading to it breaking the long-term uptrend in force from mid-2005, the decline being aggravated this month by a dollar rebound. This retreat beneath a Dome pattern and trendline failure has raised the specter of the entire pattern including last year’s highs being a Double Top in the making, a possibility that is reinforced by the appearance of a bullish Falling Wedge on the US dollar chart in recent months. These developments constitute the foundation of the bearish arguments presented in earlier updates - and they remain valid. On the bullish side of the coin gold has, so far at least, refused to break down below strong support at and above its rising long-term 200 and 300-day moving averages, and here it should be pointed out that gold has found support at and above its 300-day moving average throughout its bull market, only once dropping significantly below it in mid-2004 - so the support near this average is regarded as potent. In addition, studies of the volume patterns and volume indicators in the larger PM stocks that constitute the HUI and XAU indices, the findings of which are presented on www.clivemaund.com have unearthed evidence of heavy and persistent accumulation of these stocks in recent weeks and months that has intensified with passing time, and a bullish 3-arc Fan Correction has been identified in the now uncannily quiet XAU index which is presented below. These developments taken together strongly suggest that the PM sector is going to break sharply higher soon, which clearly imply upside breakouts by gold and silver.
But how do we reconcile these bullish developments in Precious Metals stocks with the threat to gold and silver price arising from the potential for a dollar uptrend developing, that could yet result in Double Tops completing in the metals? While it does look highly unlikely that the dollar will go on to drop below its key long-term support at about 80 on the index, and the Falling Wedge in the dollar strongly suggests it won’t, and we have assumed until now that a dollar uptrend is in the works - and we have seen it rise strongly earlier this month, there is a third possibility, which is that is that the dollar flounders about in a trading range above the support at 80 for some considerable time, giving the Precious Metals leeway to go up for other reasons, such as mounting inflation and a general continuing rise in commodity prices.
Right now we have a rare situation in gold that invariably leads to a big move. The price and its principal moving averages (the 50-day and 200-day) and on this occasion its 300-day moving average as well, are all bunched tightly together, and while the 50-day moving average is not in bullish alignment, the other two certainly are. This is a situation that should trigger a breakout shortly, and while it is still unclear which way it will go for the reasons set out above, the evidence in favor of an upside breakout is now thought to outweigh that for a breakdown. This being so the tactics for traders are clear. Traders going long at this juncture have 2 huge advantages. One is that gold is not at all overbought here, and is, in fact, a little oversold, so upside potential is very considerable. The other is that, with support so close by and clearly defined, it is possible to set relatively close stops and be taken out for a modest loss in the event that it breaks down. Traders wishing to play it safer will probably want to wait for the price to break above the Dome pattern, which would mark the end of serious selling. While these Dome patterns quite often signify tops, they often appear for a while until all traders wanting to take profits around a particular level have done so, then the advance resumes. A break below the support at the March low at just under $635 would also involve a clear break below the 200 and 300-day moving averages, and would thus be viewed as a sell signal - if this occurs traders should get out for safety, with the option of returning later if the picture improves. No exact stop-loss level is given here in order to help avoid stops being clustered at one level, which would make traders who act on what is written here vulnerable to being run out of positions by predators.
Silver Market Update
Clive Maund
As the arguments set out in the Gold Market update are equally applicable to silver, they will not be repeated here, and in this Silver Market update we will only discuss the differences worthy of note.
Whereas gold broke down from its uptrend in force since mid-2005 only this month, Silver broke down from its similar uptrend late in April and early in May. This doesn’t actually make much practical difference, for as we can see when the 2-year silver chart and 2-year gold chart are put side by side, where one goes they both go.
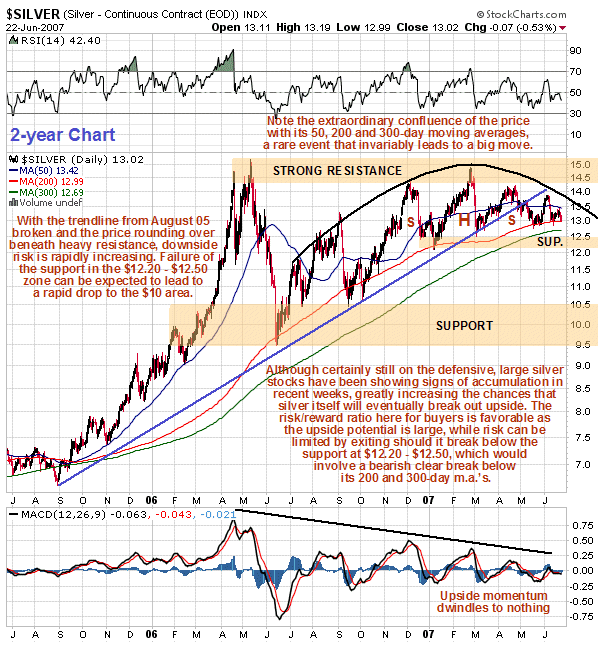
A significant difference between silver and gold is that because silver has underperformed relative to gold so far this year, if both metals drop then silver is likely to break below its January low at about same time that gold breaks below its March low. Thus, while the stop loss level for buyers of gold at this time would be set below the early March low, in the case of silver it would be below the January low.
The silver chart looks “uglier” than the gold chart right now, and with the price rounding over beneath a “Distribution Dome”, a series of lower highs and a trendline break, the downside risk is as obvious as the Marquis de Sade’s nose. However, as with gold it is holding up thus far at a point very close to its long-term moving averages, and there are signs of accumulation in various larger stocks. So it could nevertheless break out upside.
Clearly, this is a situation that is likely to break one way or the other soon. A key difference between silver and gold is that when silver drops the declines can be savage - much more severe than gold and you have to be fast to escape serious damage. For this reason it is considered prudent for silver bulls to wait until it breaks above the “Distribution Dome” shown on the chart before going long. This dome is now falling quite steeply above the price.
Clive Maund, Diploma Technical Analysis
Copiapo, Chile, 26 June 2007

Clive P. Maund’s interest in markets started when, as an aimless youth searching for direction in his mid-20’s, he inherited some money. Unfortunately it was not enough to live a utopian lifestyle as a playboy or retire very young. Therefore on the advice of his brother, he bought a load of British Petroleum stock, which promptly went up 20% in the space of a few weeks. Clive sold them at the top…which really fired his imagination. The prospect of being able to buy securities and sell them later at a higher price, and make money for doing little or no work was most attractive – and so the quest began, especially as he had been further stoked up by watching from the sidelines with a mixture of fascination and envy as fortunes were made in the roaring gold and silver bull market of the late 70’s.
Clive furthered his education in Technical Analysis or charting by ordering various good books from the US and by applying what he learned at work on an everyday basis. He also obtained the UK Society of Technical Analysts’ Diploma.
The years following 2005 saw the boom phase of the Gold and Silver bull market, until they peaked in late 2011. While there is ongoing debate about whether that was the final high, it is not believed to be because of the continuing global debasement of fiat currency. The bear market since 2011 is viewed as being very similar to the 2-year reaction in the mid-70’s, which was preceded by a powerful advance and was followed by a gigantic parabolic price ramp. Moreover, Precious Metals should come back into their own when the various asset bubbles elsewhere burst, which looks set to happen anytime soon.
Visit Clive at his website: CliveMaund.com


