Gold Market Update


In the last update gold was expected to break higher, but instead it went into a rather steep downtrend, which terminated at support at the February low and the Reversal Day high in December. A weak bounce has followed which has synchronised with a sharp drop in the dollar. As we will shortly see, the action in gold stocks suggests a continuation of the current corrective phase, and a strong probability that the support line at $535 will fail.
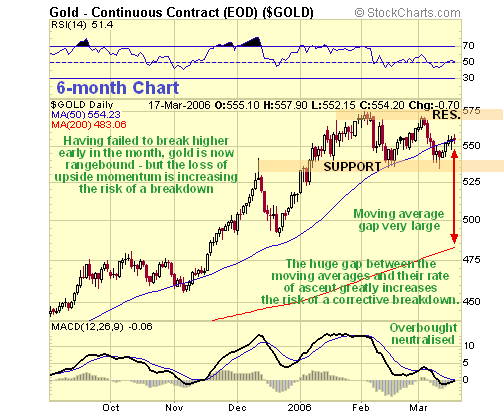
On the 6-month chart we can see that, having failed to break higher, gold is currently in a trading range, bounded by approx. $535 and the highs at $575, although it does appear to be rounding over and weakening, with the early March highs beneath the early February highs; if the current rally peters out here, failure of the support at $535 can be expected to follow quickly. Although the overbought condition evidenced by the MACD indicator late in January and early February has unwound, a dangerously large gap exists between the principal 50 and 200-day moving averages, and the recent loss of upside momentum is increasing the risk of a deeper correction, which would be signalled by a failure of the key $535 level.
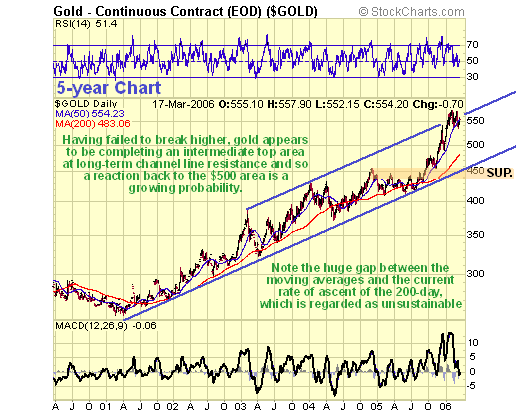
The 5-year gold chart shows just how “out on a limb” gold is right now. Pay particular attention to the large gap between the moving averages, and the steepness of the rise in both moving averages, which is viewed as unsustainable, and is therefore providing advance warning of a serious breakdown, or, at least, a lengthy period of consolidation. For the benefit of those readers, or other analysts, who either like to believe or claim that “it will be different this time”, we have too many experiences of it “not being different” in the past to want to run the risk of being long gold now.
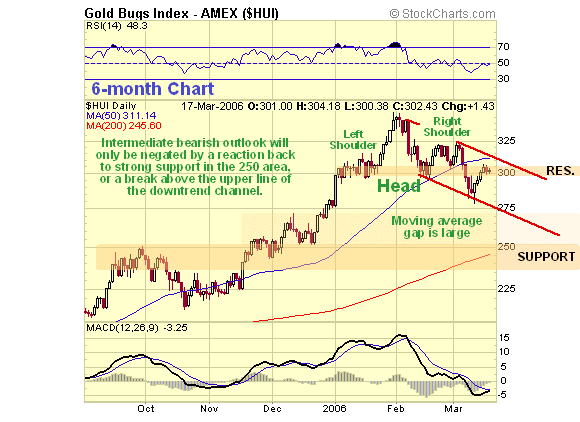
The HUI GoldBUGS index is an ugly picture showing stocks in a downtrend, having broken down from a “Head-and-Shoulders” top area, with the rally of the past week or so looking like a short-term corrective rally within an intermediate downtrend. This chart projects the index down to support in the 250 area, and only a break above the upper downtrend channel line will start to negate the bearish implications of this chart. The XAU index looks even worse. With regard to the duration of the corrective phase, the typical pattern is that reaction/consolidation continues until the 50-day moving average has retreated back close to the 200-day, where it then turns up, a process that can take several months - we have seen this many times in the oil sector over the past couple of years. If this probable scenario for the HUI index becomes a reality, then clearly it will mean substantially lower gold prices - gold can be expected to react back to the vicinity of its 200-day moving average, which is advancing steeply towards $500.
Readers may wish to take measures to protect their positions at this time. Those who wish to stay long, either because they are frightened of missing out on further gains, or for tax reasons, can protect themselves by the careful use of options.
Silver Market Update
Clive Maund
Silver has so far ignored the slowdown in gold and although it reacted instead of pushing higher as expected in the last update, it quickly made good the losses and it even managed to push to new highs last week. The question therefore arises as to how long silver can continue to forge ahead with gold going nowhere, and more particularly, if gold goes into an intermediate decline, as looks likely from its chart and especially from the charts of the gold stock indices.
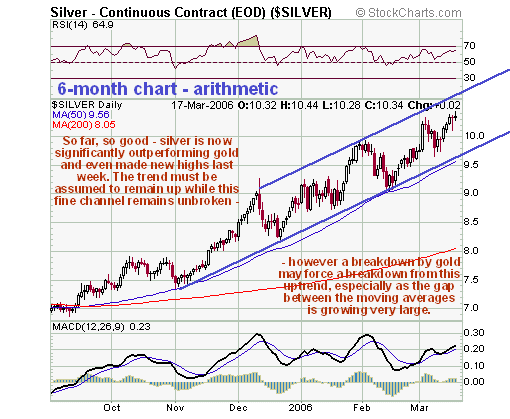
The 6-month arithmetic chart for silver looks just great, with the price continuing to rise within a fine uptrend channel, and the only “blot on the landscape” is the large gap that has opened up between the moving averages. As with gold, this is a warning that no uptrend last forever, although while gold has lost upside momentum, silver hasn’t - so far.
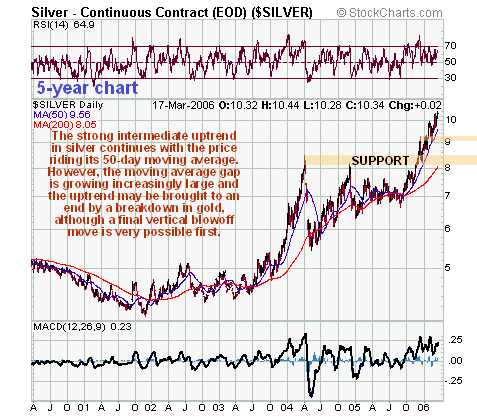
The 5-year silver chart puts the strong uptrend in silver into historical perspective and shows that silver is getting increasingly extended, as gold did some weeks back. Although the current intermediate uptrend is definitely getting “long in the tooth”, there is scope for further upside before it has run its course, and it may end with a spectacular vertical blowoff move that takes it to a short and intermediate-term overbought extreme.
Before anyone writes to tell me about the wonderful fundamentals for silver, as described by writers such as Ted Butler, I know about them, so there’s no need.
Clive Maund, Diploma Technical Analysis
Kaufbeuren, Germany, 22 March 2006

Clive P. Maund’s interest in markets started when, as an aimless youth searching for direction in his mid-20’s, he inherited some money. Unfortunately it was not enough to live a utopian lifestyle as a playboy or retire very young. Therefore on the advice of his brother, he bought a load of British Petroleum stock, which promptly went up 20% in the space of a few weeks. Clive sold them at the top…which really fired his imagination. The prospect of being able to buy securities and sell them later at a higher price, and make money for doing little or no work was most attractive – and so the quest began, especially as he had been further stoked up by watching from the sidelines with a mixture of fascination and envy as fortunes were made in the roaring gold and silver bull market of the late 70’s.
Clive furthered his education in Technical Analysis or charting by ordering various good books from the US and by applying what he learned at work on an everyday basis. He also obtained the UK Society of Technical Analysts’ Diploma.
The years following 2005 saw the boom phase of the Gold and Silver bull market, until they peaked in late 2011. While there is ongoing debate about whether that was the final high, it is not believed to be because of the continuing global debasement of fiat currency. The bear market since 2011 is viewed as being very similar to the 2-year reaction in the mid-70’s, which was preceded by a powerful advance and was followed by a gigantic parabolic price ramp. Moreover, Precious Metals should come back into their own when the various asset bubbles elsewhere burst, which looks set to happen anytime soon.
Visit Clive at his website: CliveMaund.com
More from Gold-Eagle


