Gold Price Bounces Back Into The Box
 share
share
 share
share
 share
share
 share
share
 share
share
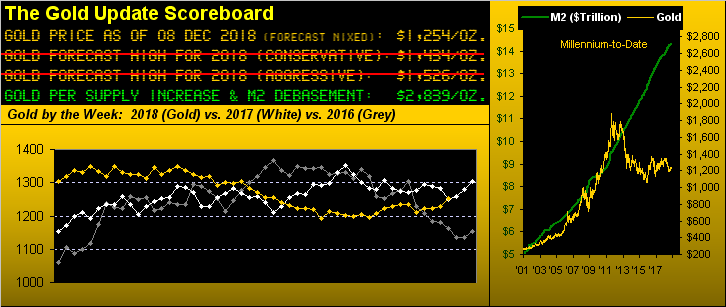
Let's begin with this from the "You Hoid It Here Foist Dept.", or likely so: per the above Gold Scoreboard in price settling out the week yesterday (Friday) at 1254, Gold to this point of the year is now higher than 'twas at this time in each of 2017 (1249), 2016 (1176), 2015 (1071), 2014 (1204) and 2013 (1230) -- not by much in most of those cases -- but nonetheless higher.
So does that mean "This is IT"? Per the Scoreboard's right-hand panel, "IT" ought have been in continuance by mitigating ongoing currency debasement through those same five years. At the very least, what "IT" for the present is comes from that penned a week ago with respect to Gold's weekly bars and their parabolic Long trend's rising blue dots: "...In the new week, such trend would end upon price dropping through the rightmost dot at 1204, the alternative being to scamper up into the safety and serenity of The Box only to then spend many-a-month therein..."
And now a week hence, behold Gold's having bounced up into The Box (1240-1280), that infamous purple-bounded zone wherein Gold has seemingly lived forever for some five years. Indeed for the 1261 trading days from five years ago-to-date, Gold has been in The Box during 362 (27.8%) of them. Five years of nuthin' and here we are again. 'Tis what "IT" is, baby:

'Course, Gold's 2.1% gain for the week did not conclude without some rejoicing, a valued reader writing in last night of a 7.3% miners mix gain, which is how one expects the 3:1 (miners:metals) leverage ratio to play out. Moreover, December a year ago was kind to Gold in sporting a 2.6% monthly gain. But prior Decembers from 2011 through 2016 have recorded only one which was up, and only meagerly so, that being 2014's +0.8x monthly gain.
Yet what's different this time 'round is the stock market's working down through what we continue to target as a full 27% correction (by the S&P from its 2940 all-time high this past 22 September down to 2154 which is the 2016 pre-election support shelf). The timing for this per additional analysts having recently jumped on the bandwagon suggests the correction running its full course into next year, (as hardly did the 50%+ corrections of 2000-2002 and 2007-2009 careen down in straight lines). Thus today, whilst Gold is not notably getting its normal currency debasement bid, it may be at least getting the safe haven bid: for the S&P's corrective three years 2000 through 2002 the net rise in Gold's price was 20.2%; for 2007 through 2009 the net rise was 71.8%. Repeat that through this S&P 500 correction and for Gold 'twould certainly be "IT"!
Then we've this added technical note. In looking below across Gold's daily closes from its All-Time High-to-date, the rightmost bit shows us the 300-day moving average in decline: but its actual level is what catches our attention: 1273 -- that is beneath the top of The Box (1240-1280). So get atop The Box and Gold will be atop the average as well. And that (for the ad nauseath time) opens the door to Base Camp 1377. Excited? Have a sedative as price may well stay "boxed-in" for some time:
Not boxed are stocks as their gyrating correction continues. Early in the week's wee hours from the bedside radio a Bloomy host queried (paraphrased): "Investors around the world are wondering what is causing the selloff: Is it tariffs? The inverted yield curve? Plunging energy prices? Rising interest rates?" Modestly raising our hand we offered the E-word: "Earnings?" Save for Bob Shiller, (whose CAPE measure at this writing is 29.4x) and our "live" price/earnings ratio for the S&P 500 of 38.9x, the investing world seems void of coming forth with such truthful P/Es, instead couching them no higher than 20x, oft hopeful over earnings not yet earned. Recall that our 2154 S&P target looks for an extrapolated P/E 'round 17x including the new corporate tax cut: excess drained and you're back in the game.
Still, as the past week unfolded came more fallout for the Economic Barometer. Notably, growth in November's Non-Farm Payrolls was only 65% of that for October, Hourly Earnings growth also slowed and the Average Workweek was reduced; as well, October's Trade Deficit increased, Wholesale Inventories became more bloated, and both Construction Spending and Factory Orders actually fell. What might the ensuing week's Lucky 13 basket of incoming metrics bring? "Medic, medic...":
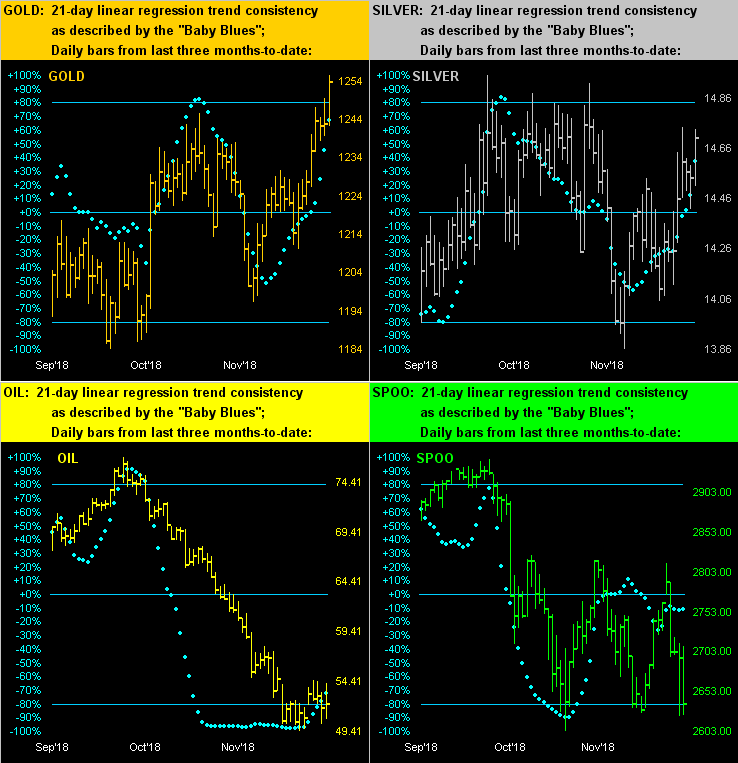
On to our panels of daily bars and regression trend consistencies for the precious metals; again we include therein same for both Oil and the S&P 500 ("Spoo") as they're so much in play. And for both Gold at upper left and Silver at upper right we see their respective "Baby Blues" climbing out with increased alacrity. As well for Oil at lower left, the blue dots at long last are coming up from the floor: now with the OPEC Vienna meeting having past with agreement toward output reduction, this gives Oil (having settled the week at 52.13) an opportunity to make a move up into the 55-57 area as noted this past week in the website's commentary. But as for the S&P at lower right, " ... uhh ... ooh ... ugh ... nnnNNNO ...":
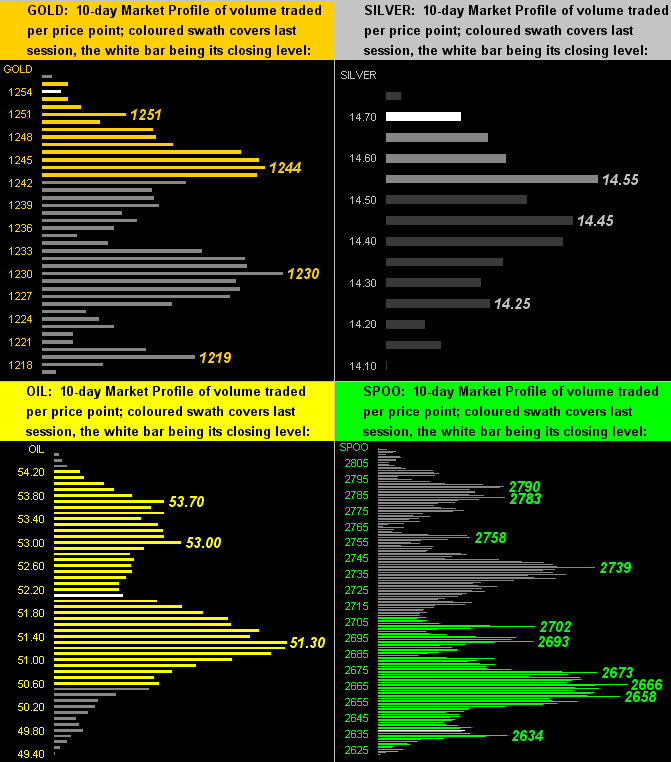
Here next are the 10-day Market Profiles for the same bunch. Simply stated for Gold (upper left) and Silver (upper right), prices sit essentially atop their respective Profiles. Oil (lower left) is poised mid-profile, the idea there to bust up through those two resistors in the 53s toward the aforementioned 55-57 area, whilst the S&P (lower right) looks lower still should it not overcome the 2658-2676 resistor nest:
Back in the safety and serenity of The Box (1240-1280) indeed is our Gold. Rather a monasteristic refuge in which to hide whilst all 'round goes wrong. And maybe, just maybe, should price pop atop The Box, 'twill once again be Go Time for Gold. So don't be that stock market guy...
...be this one!
share
share
share
share
share

Mark Mead Baillie has had an extensive business career beginning in banking and financial services for two years with Banque Nationale de Paris to corporate research for three years at Barclays Bank and then for six years as an analyst and corporate lender with Société Générale.
For the last 22 years he has expanded his financial expertise by creating his own financial services company, de Meadville International, which comprehensively follows his BEGOS complex of markets (Bond/Euro/Gold/Oil/S&P) and the trading of the futures therein. He is recognized within the financial community of demonstrating creative technical skills that surpass industry standards toward making highly informed market assessments and his work is featured in Merrill Lynch Wealth Management client presentations. He has adapted such skills into becoming the popular author each week of the prolific “The Gold Update” and is known in the financial website community as “mmb” and “deMeadville”.
Mr. Baillie holds a BS in Business from the University of Southern California and an MBA in Finance from Golden Gate University.
More from Gold-Eagle


