Gold Price Forecast: Predicting Gold Above $1,500? Read This.


The gold market started July with a big decline, but it was immediately followed by a relatively big rally. At the moment of writing these words, gold is back to about $1,400 as the second attempt to rally well above this level was invalidated. Were the two big declines from about $1,440 just local pullbacks on gold's way above $1,500?
In short, that’s very unlikely, and while the size of the move is substantial, we shouldn’t put more weight to it than to the signals that are of very long-term nature. For instance, gold’s huge weekly volume.
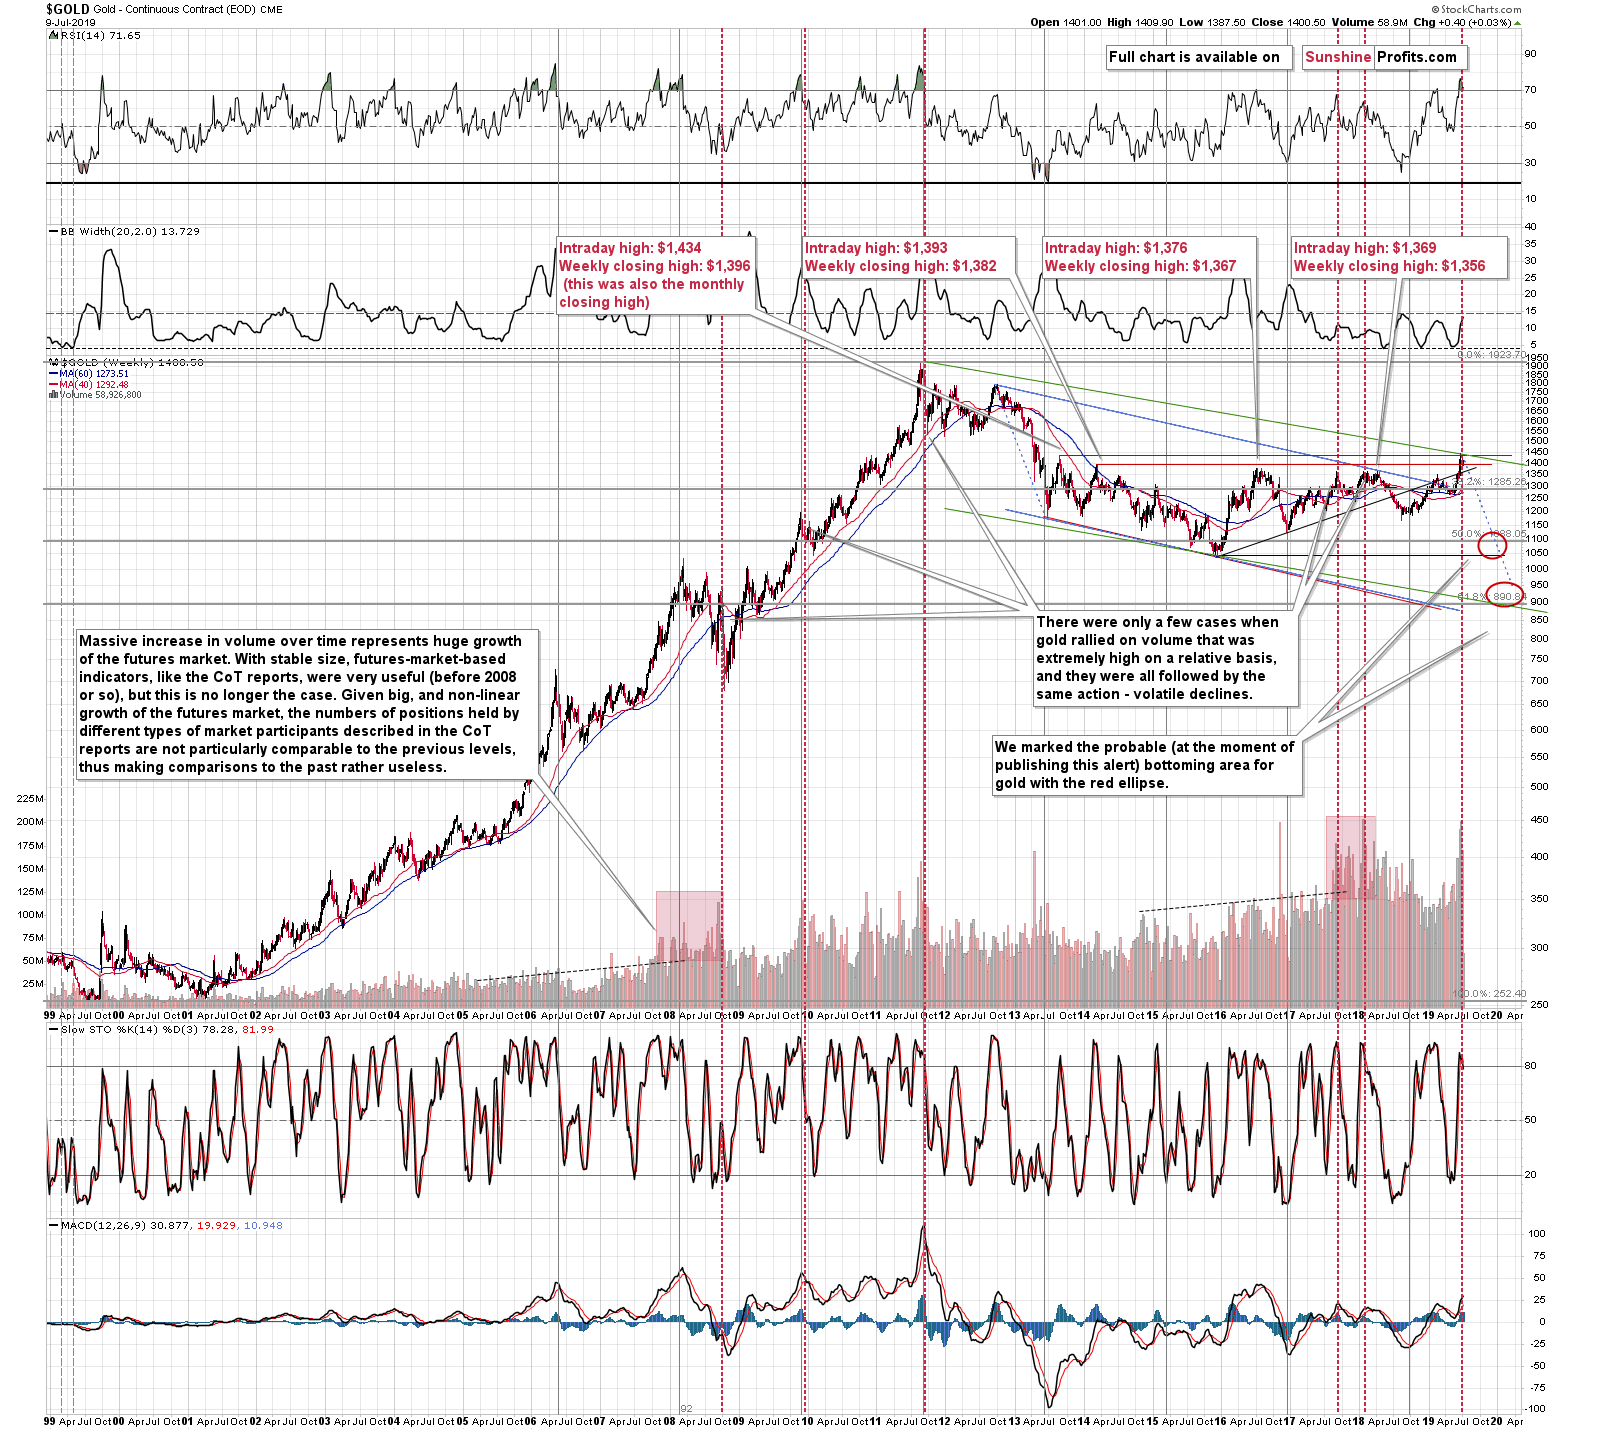
All cases when we saw huge weekly volume spikes marked excellent shorting opportunities, not instances where one could have invested in gold and profited on it in the following weeks (of course, there are some day traders, who might have done that, but that’s an exception, not the rule).
Did the early-July upswing change any of that? Absolutely not. Has gold declined already in a really profound manner, just like it did after all the other huge-volume occurrences? No, it didn’t slide yet. This means that the plunge is most likely just around the corner. Of course, we can view it as it being already underway, and we can treat the recent upswing as a counter-trend move. Regardless of the name that we use, gold is likely to decline profoundly in the following weeks.
Let’s take a look how the early July price moves related to the long-term triangle-vertex-based reversals.
Did That Impact the Below Reversals?
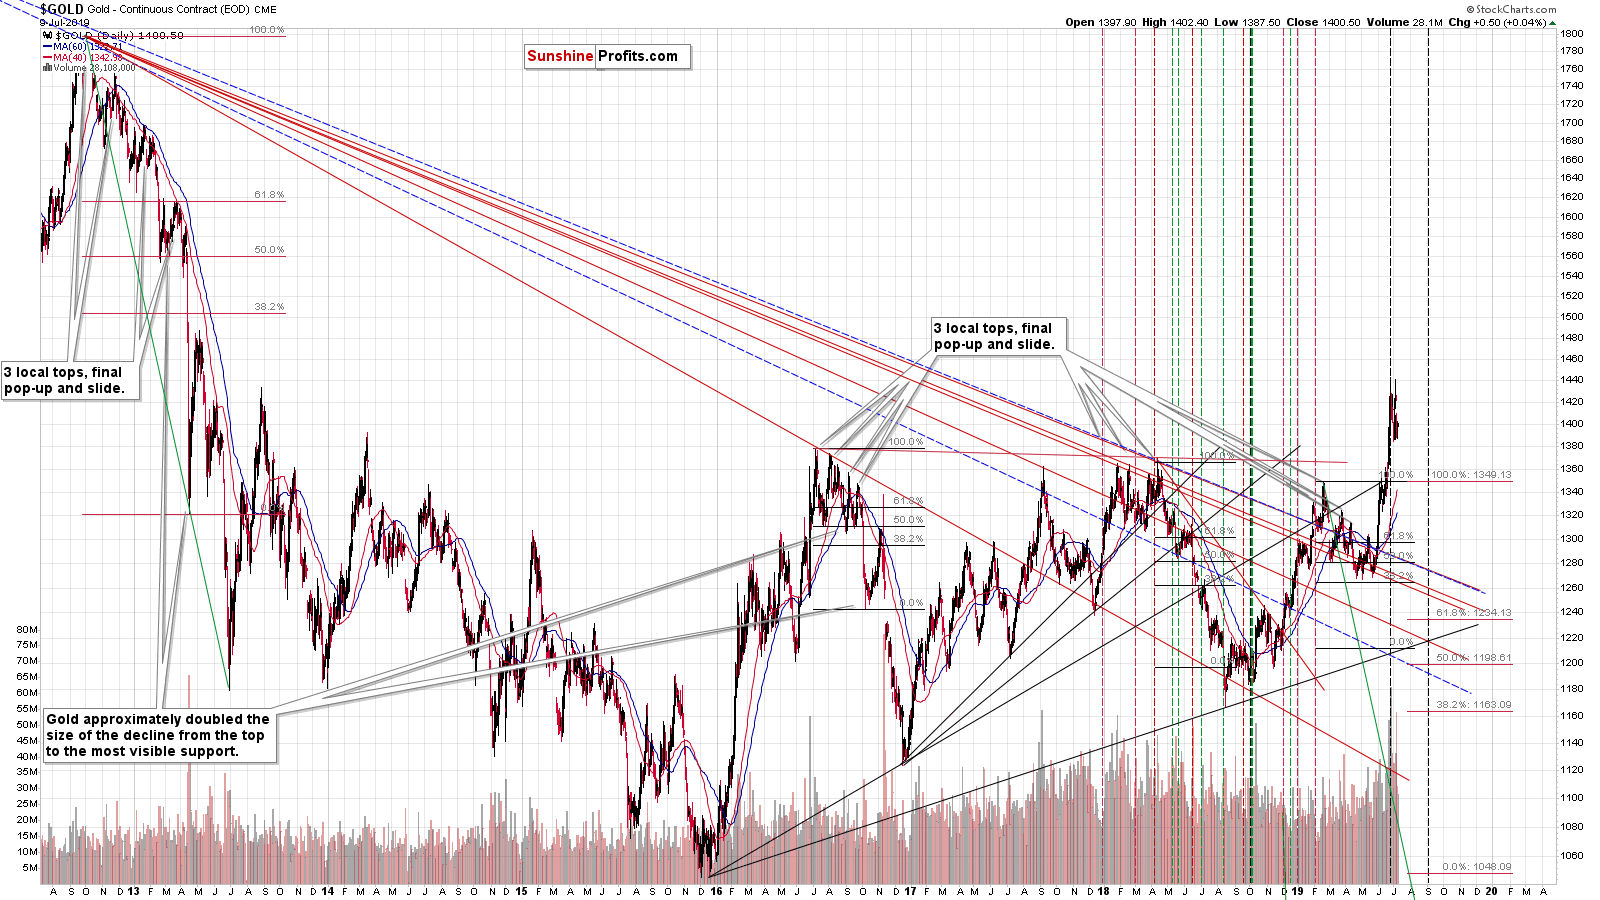
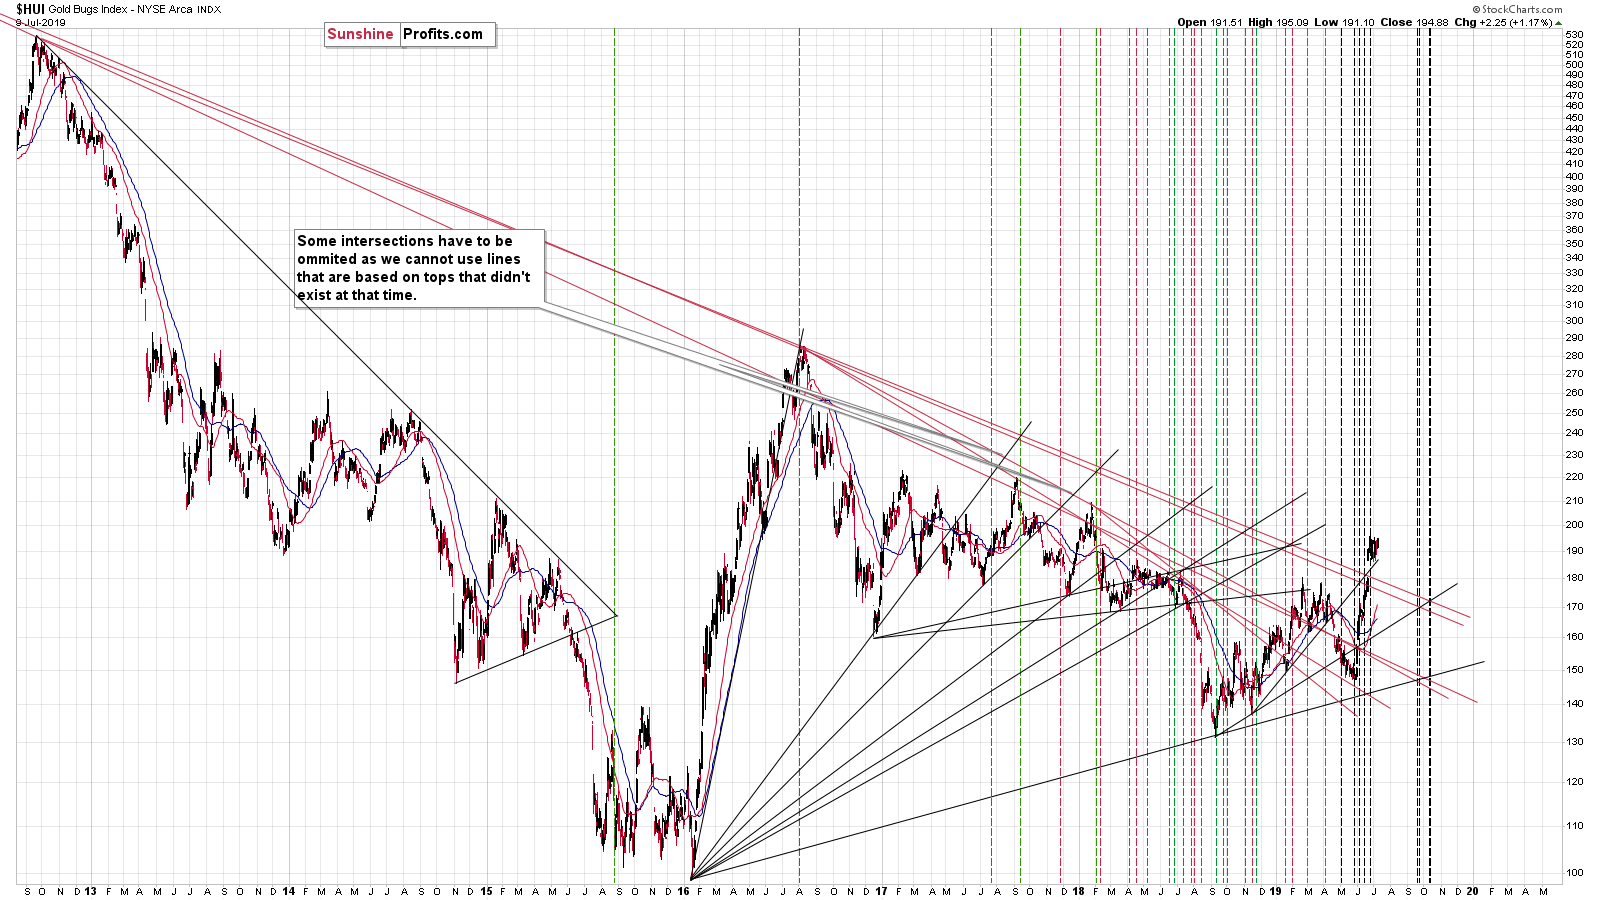
We can comment on all three charts at the same time, because they were impacted in the same way. That is – they weren’t. The move higher in silver was barely visible, while the move in gold didn’t change anything. Gold appears to have reversed right at the late-June reversal.
There’s one more thing that we would like to add about the HUI Index – proxy for gold shares. Or actually two things.
The first thing is that the mid-2016 top was also indicated by a triangle-vertex-based reversal and the special thing about this top is that gold miners declined immediately after the top, but before the decline really took off, there was a very quick comeback to higher values. The decline that followed initially was sharper than the rally leading to the top, so it was very difficult to exit the market close to the top, unless one exited it early.
The current “strength” in the HUI Index may be just as fake as the mid-2016 one was.
The second thing to mention about the above chart is that it does a very good job at keeping the proper perspective of the recent rally. The 2018-2019 upswing in gold is smaller but still comparable to the one that we saw in 2016. The upswing in gold stocks is a few times smaller and the move higher in silver is barely visible – it doesn’t even look like a standalone rally, but like a correction.
This confirms what we know based on observation of the news – we had series of geopolitical surprises that pushed gold higher and the rest of the sector was more or less forced to move along with it, but the strength of the reaction was actually very limited. It’s easy to get carried away by emotionality during day-to-day volatility, but keeping the big picture in mind is particularly important. What’s happening doesn’t look like a true strength across the board – it’s more or less only gold that is so strong. And it was gold that clearly reversed last week on extremely big volume. The odds simply don’t favor sustained strength in the precious metals sector. They favor a big washout slide before the final bottom is in.
By the way, do you remember when everyone and their brother told you how the gold to silver ratio was topping, but we warned you about the breakout?
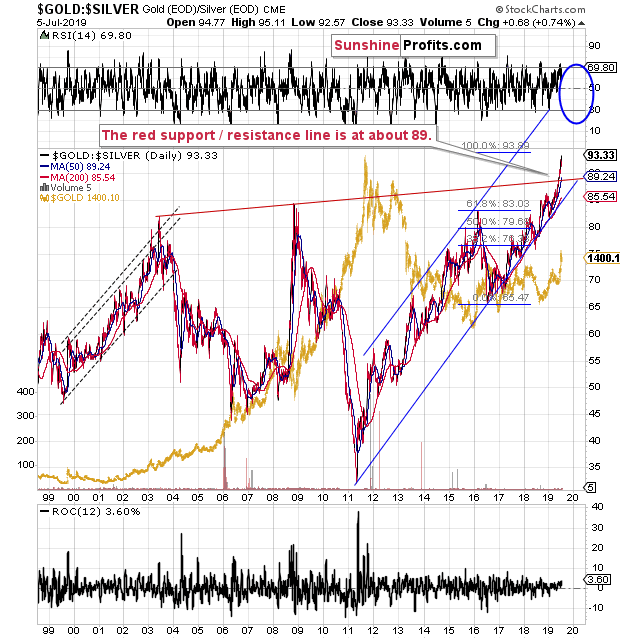
It’s clear that the breakout has been more than confirmed and that the implications remain bearish for the precious metals market for the following months. Why would the latter be the case? Because major moves in the PM sector tend to happen in the opposite direction to the one in which the ratio is moving. By breaking above the 2016 high (as well as 2008 and 2003 highs), the ratio is practically screaming that new lows (below the 2015 and 2016 lows) are to be expected for gold and silver.
There are multiple other factors that point to lower gold prices in the future that we cover on an ongoing basis in our Gold & Silver Trading Alerts that we will not cover in this article, but there’s one more thing that we would like to share with you – something epic that went under most investors’ radar.
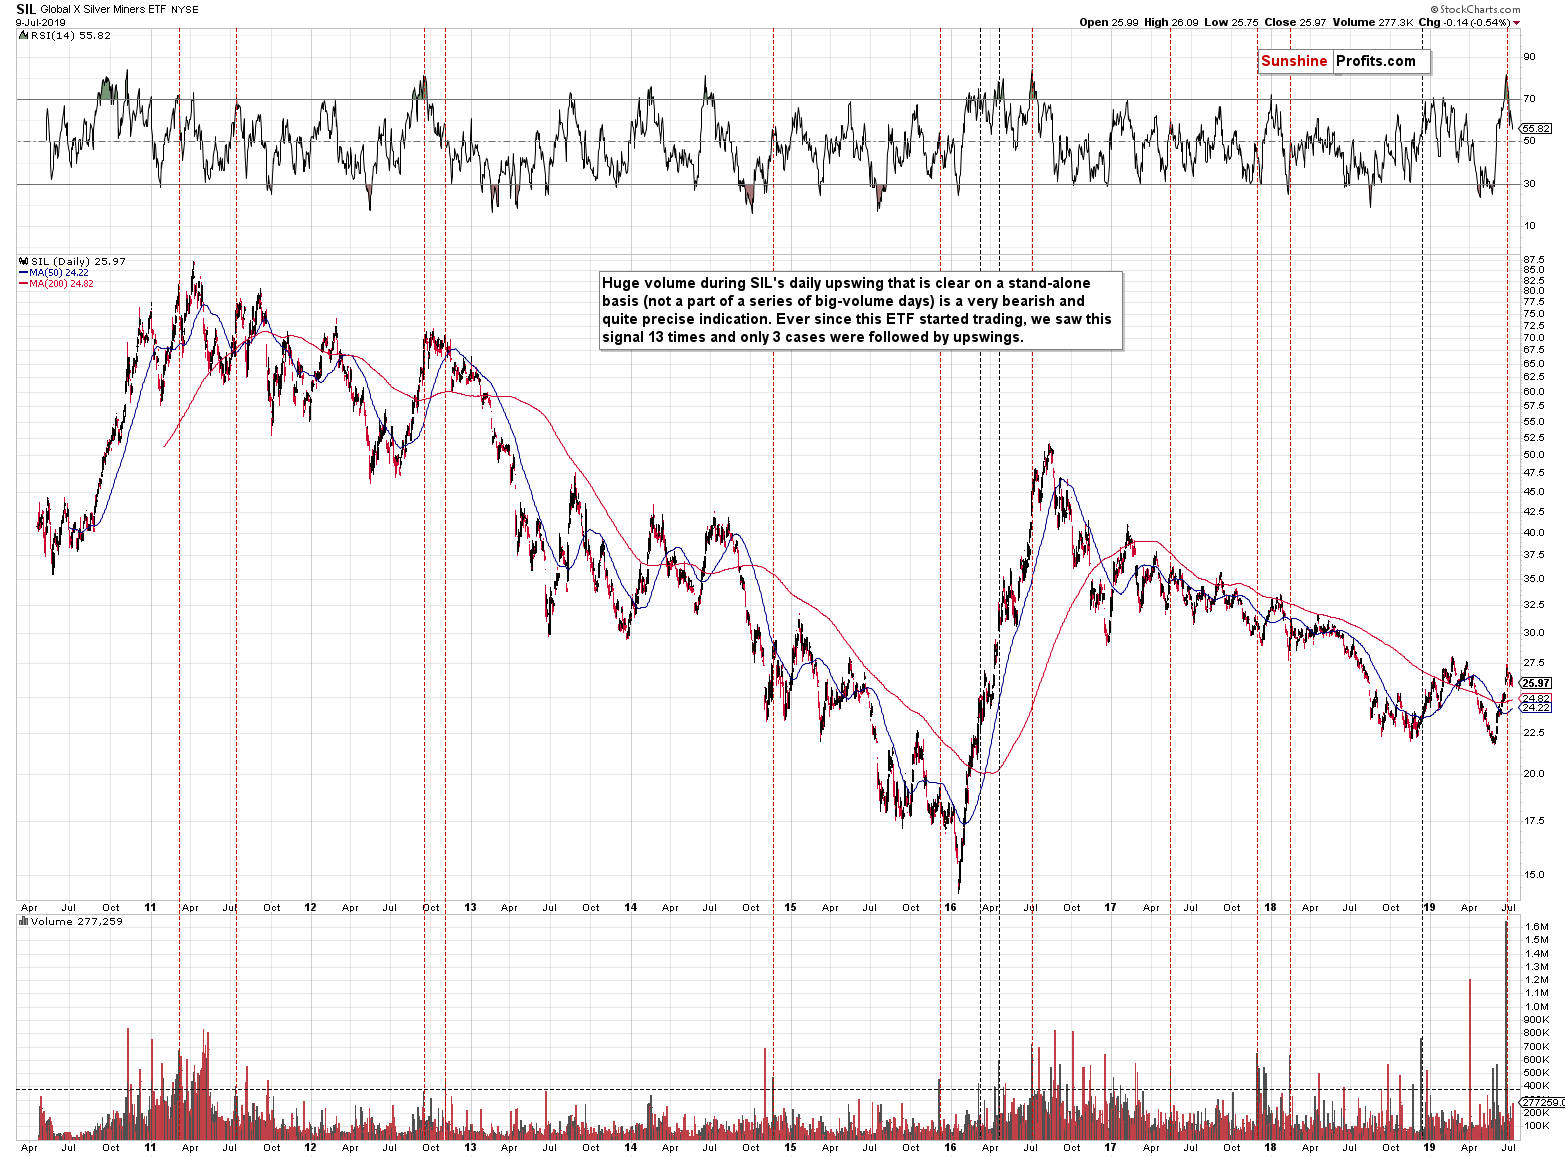
We recently saw a record volume in case of the silver mining stocks. The SIL volume was truly breathtaking. It was the biggest volume ever and if we take only the daily rallies into account it was more than twice as big as the second biggest value. And what did SIL do on Friday when we saw this volume? It moved back and forth, while closing almost unchanged, thus creating a doji candlestick. Doji after a rally and accompanied on huge volume is a sign of reversal. This, accompanied by very overbought status as indicated by the RSI has profoundly bearish implications going forward (for more tips on trading gold and silver see this page).
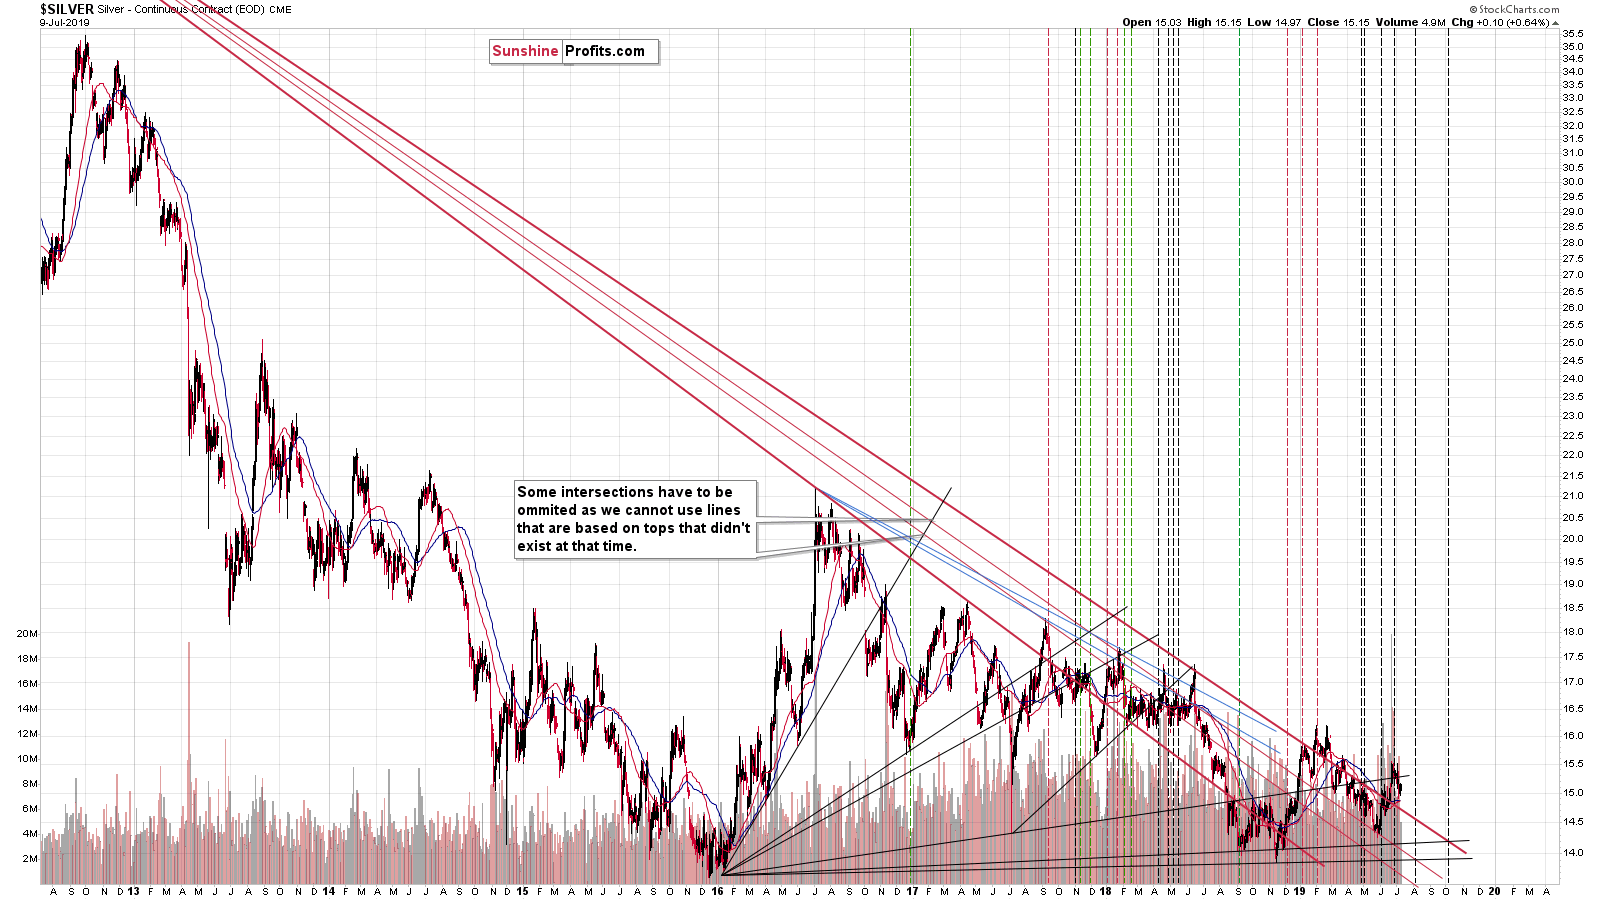
Let's stay with silver for a while. Did you realize that despite gold's volatile movement, the white metal has been very... boring?
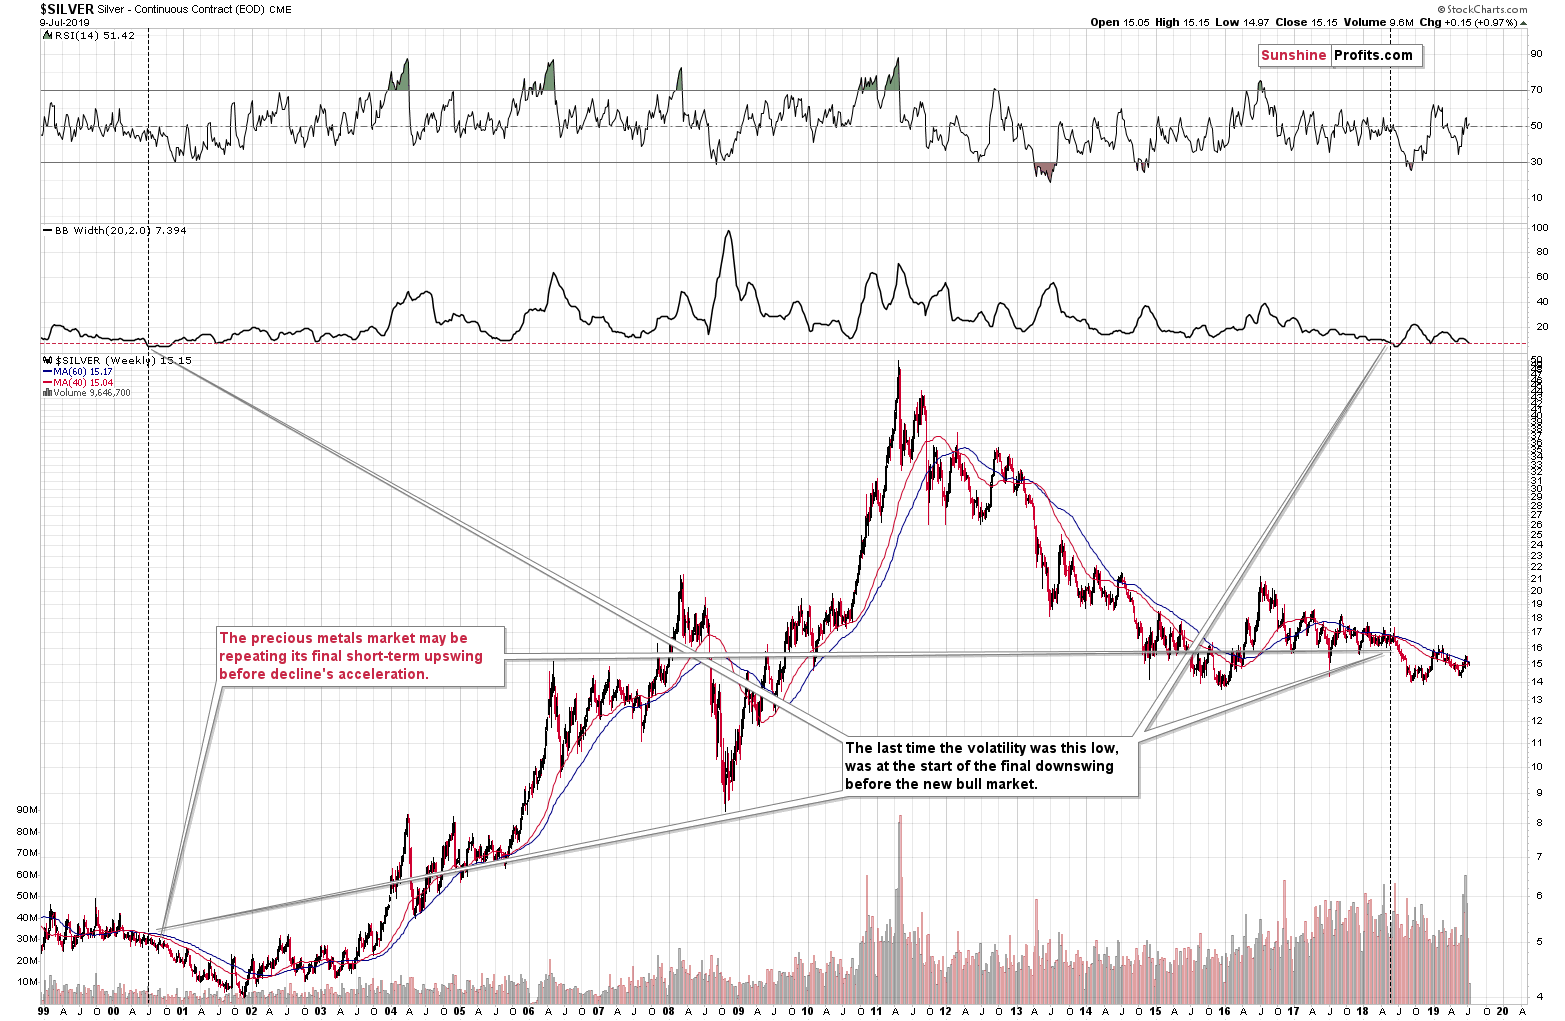
The indicator that is visible on the above chart second from top is the width of the Bollinger Band. It's a proxy for the market volatility. Please note how the moves in silver (especially upswings) became smaller over time. It came to the point when gold moved above its 2016 high, while silver is relatively close to the 2015 bottom.
The key question is when was silver just as boring (calm) and when did it take place for as long as it's been taking place right now. The answer is that it was the case about 20 years ago right before silver's slide to its final bottom. This analogy continues to favor the silver prediction in which we get lower precious metals values and the true bottom after a several-month-long decline.
Summary
Summing up, the recent rally in the precious metals may appear encouraging, but it didn’t change the medium-term trend. Multiple long-term signs continue to point to lower prices in the following months, i.a. the clear huge-volume-confirmed bearish shooting star candlestick in gold, huge volume topping signs from both: gold and silver, the triangle-vertex-based reversals, and epic volume from silver stocks. This means that as much as we light the precious metals market, we just can’t forecast higher gold prices right now. The next big move in the precious metals sector is most likely going to be down, not up, and we’re likely going to see gold $1,200 well before we see it at $1,500. In fact, we think that gold is going to decline much lower than just to $1,200.
Naturally, the above is up-to-date at the moment of publishing and the situation may – and is likely to – change in the future. If you’d like to receive follow-ups to the above analysis, we invite you to sign up to our gold newsletter. You’ll receive our articles for free and if you don’t like them, you can unsubscribe in just a few seconds. Sign up today.
Przemyslaw Radomski, CFA
Editor-in-chief, Gold & Silver Fund Manager
Sunshine Profits - Effective Investments through Diligence and Care
* * * * *
All essays, research and information found above represent analyses and opinions of Przemyslaw Radomski, CFA and Sunshine Profits' associates only. As such, it may prove wrong and be a subject to change without notice. Opinions and analyses were based on data available to authors of respective essays at the time of writing. Although the information provided above is based on careful research and sources that are believed to be accurate, Przemyslaw Radomski, CFA and his associates do not guarantee the accuracy or thoroughness of the data or information reported. The opinions published above are neither an offer nor a recommendation to purchase or sell any securities. Mr. Radomski is not a Registered Securities Advisor. By reading Przemyslaw Radomski's, CFA reports you fully agree that he will not be held responsible or liable for any decisions you make regarding any information provided in these reports. Investing, trading and speculation in any financial markets may involve high risk of loss. Przemyslaw Radomski, CFA, Sunshine Profits' employees and affiliates as well as members of their families may have a short or long position in any securities, including those mentioned in any of the reports or essays, and may make additional purchases and/or sales of those securities without notice.
 Przemyslaw Radomski, CFA, is the founder, owner and the main editor of SunshineProfits.com. You can reach Przemyslaw at: http://www.sunshineprofits.com/help/contact-us/.


