Gold Price Forecast: Recovery Imminent, Caution Longer-Term


The short-term forecast for gold is clear: the metal is set to move higher. Gold has just put in an intermediate low at $1,238 per ounce as of July 3, 2018. Several leading indicators point to an imminent recovery in prices over the next 1-3 months.
However, the longer-term picture for the precious metal is mixed: gold must overcome its 2016 high at $1,378 within the next six months to avoid a significantly bearish outcome that could result in a multi-year decline following such a failure.
The time to closely monitor gold’s price action for one of these scenarios is now.
Gold – Rising Support (Buyers) With Flat Resistance (Sellers)
Let us examine several leading indicators which suggest that gold prices are set to recover imminently from the recent $130 decline seen since late-April.
First, the overall structure of the gold market over the past three years remains positive. The ongoing pattern is one of flat horizontal resistance between $1,365 - $1,378 (labeled below in black, 2016 – 2018 Resistance Zone), with rising support (labeled in blue, 2015 – 2018 Rising Support).
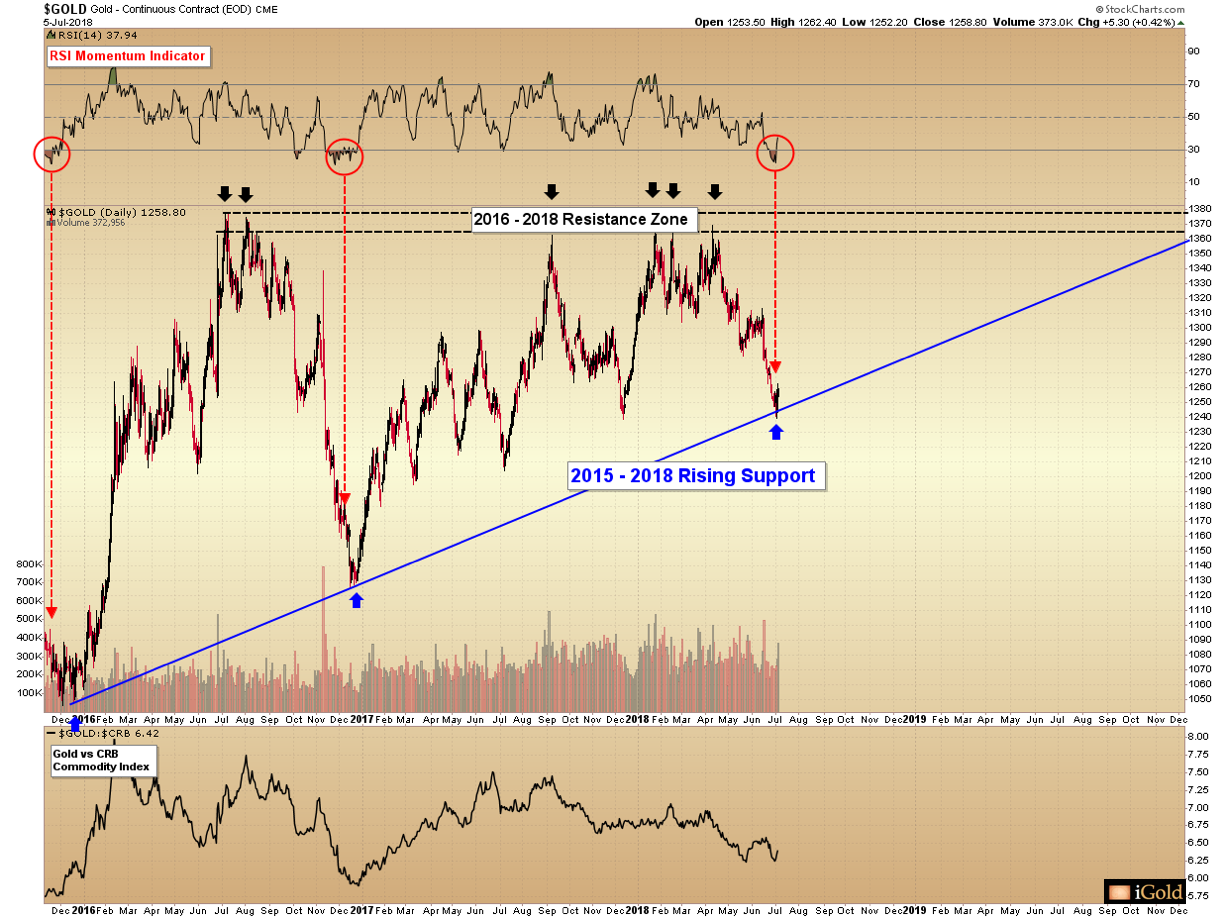
Note how buyers continue to show up every 12 – 18 months in the gold market at higher and higher intervals, shown by the rising blue arrows. Meanwhile, sellers continue to emerge within a relatively narrow range, shown by the black arrows.
This pattern – where sellers appear at a defined level but buyers continue to emerge at higher and higher prices – is considered a bullish setup, as we eventually expect that the rising trend of buyers will overwhelm the stubborn overhang of gold sellers.
The most recent test on the (blue) trend of rising buyers occurred just this week as prices dipped to $1,238 in the overnight trading hours in Asia. Within 24 hours of the test, gold recovered by $25 to $1,263. This impulsive recovery-type price action is exactly what we would expect to see at the juncture of a significant low.
Downward Momentum Unsustainable
A second indicator suggests that gold is now forming a major low, similar in magnitude to the December 2015 and December 2016 bottoms. This indicator appears above the main chart and is labeled in red, called the Relative Strength Index (RSI).
RSI is a study of momentum, and while the topic can be examined at length in full articles on its own, as a general principle we can observe that when the indicator reaches an oversold reading below the 30 level (highlighted in red), such tends to correspond with panic-type selling which is unsustainable in nature.
The only two previous times that an RSI reading under 30 has registered over the past three years include December 2015, which occurred two weeks before the gold low at $1,045 per ounce, and December 2016, which occurred two weeks before the gold low at $1,128 per ounce (red arrows). While no single indicator alone is perfect, here we see that extreme downward momentum tends to be unsustainable in nature, and often precedes a significant price recovery.
Gold Miners To Gold Ratio
The final indicator we will examine is the gold miners to gold ratio. For this signal, we will examine the GDX large-cap miners fund in comparison to the price of gold. We will show this relationship from the first-quarter consolidation in gold and through the most recent decline, which began in April:
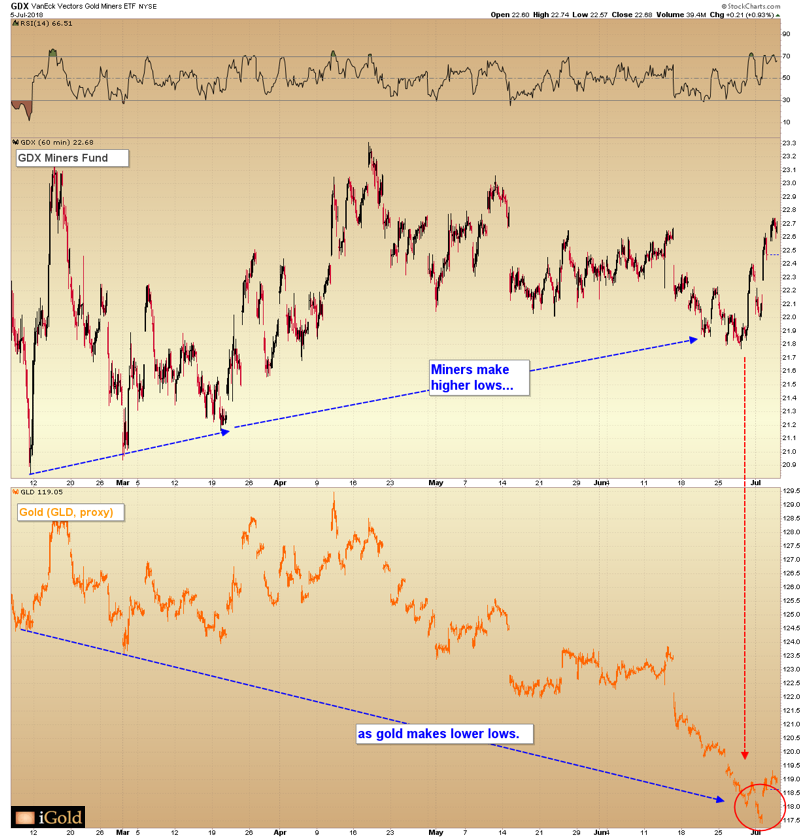
Note how the GDX fund (top), after bottoming in February at 20.9 on the index, has continued to make higher and higher lows, through the most recent reading of 21.8 as of late-June. Meanwhile, the price of gold has continued to deteriorate, accelerating lower into the most oversold reading of the past 18 months, as discussed in the last section.
Gold miner profits are supposed to be leveraged to the underlying price of gold. After all, the miners have relatively fixed input costs (energy, land, and labor expenses), with a highly variable output value (the worldwide price of gold). Thus, we generally expect that for each 1% fluctuation in the price of gold, the companies that dig the metal out of the ground should rise or fall by 2% - 3%. This leverage to gold prices is why investors often choose to invest in the mining enterprises.
Why, then, as gold prices have fallen nearly 6% since February have the valuations of the large-cap gold miners actually risen? What is occurring in the background as investors are valuing the billions of dollars in market capitalization that make up the large-cap miners within the GDX fund?
We can only conclude that gold mining investors as a sum do not believe that gold prices are set to continue falling as they have for the past three months. Perhaps mining investors are paying attention to the same overall bullish structure in the gold price as we are. Perhaps they are observing the unsustainable downward momentum which has closely corresponded to important lows over the past three years. We cannot know for certain what the sum of all investors are thinking – but their verdict is plain to see, as they refuse to sell what are supposed to be leveraged shares even amidst the recent strong decline in gold prices.
Takeaway On Gold Short-Term
Gold appears set for a significant recovery according to the technical indicators we follow. The overall structure of the gold market is of static overhead sellers, amidst a clear trend of rising buyers. Momentum is as oversold as it has been since the 2015 bottom, at levels which have previously corresponded with significant lows. Finally, the sum of gold mining investors do not believe that lower prices are set to last.
We conclude that an important low is forming, which will see prices recover to at least $1,300 again over the next several weeks.
Gold Prices Longer-Term
What happens after gold’s imminent recovery remains less clear. The metal must next break through the 2016 – 2018 resistance zone between $1,365 - $1,378, or else the present bullish pattern could morph into a negative failure.
In the next article, we will examine the recovery as it progresses and assess the odds for gold to continue higher into the $1,400’s - $1,500’s into 2019, or whether a negative resolution to the long-term pattern may be pending later this year.

Christopher Aaron began his career as an intelligence analyst for the CIA and Department of Defense. He served two tours to Afghanistan and Iraq between 2006 - 2009, conducting pattern-of-life mapping for military leaders.
Mapping shares similarities with technical analysis of the financial markets because both involve the interpretation of repeating patterns found in human nature. He is the founder of iGold Advisor, providing independent research and analytics on all aspects of the precious metals markets.
He speaks regularly on the cyclical patterns found within the financial markets and on international policy. He has been featured in the New York Times and NPR news amongst other financial publications.


