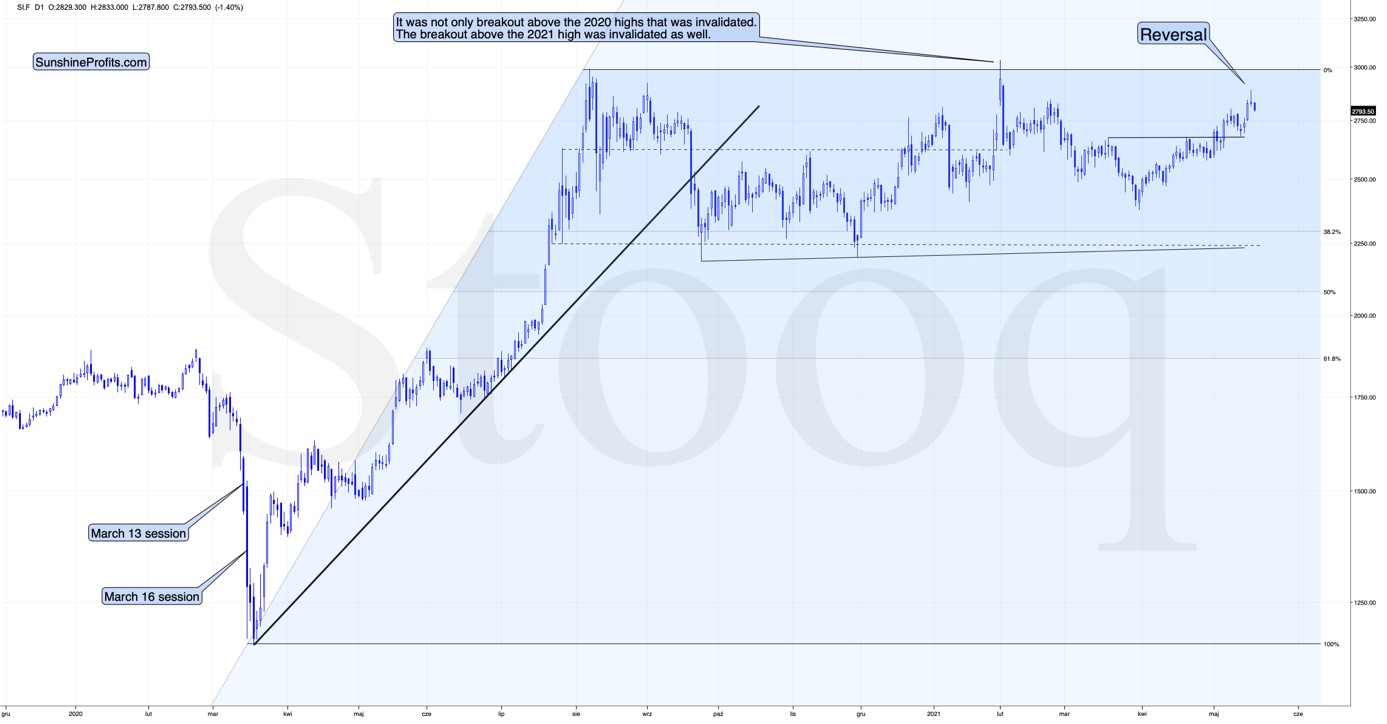
Gold: Reversal Is The Name Of The Game


When the USDX declines, the PMs usually celebrate and rise as a result. However, this was not the case yesterday – and we can’t ignore it.
“Reversal” is the name of the game, at least when it comes to the precious metals market.
The USD Index declined profoundly once again yesterday (May 18), and gold, silver, and mining stocks ignored this move. They didn’t want to follow in its footsteps anymore.
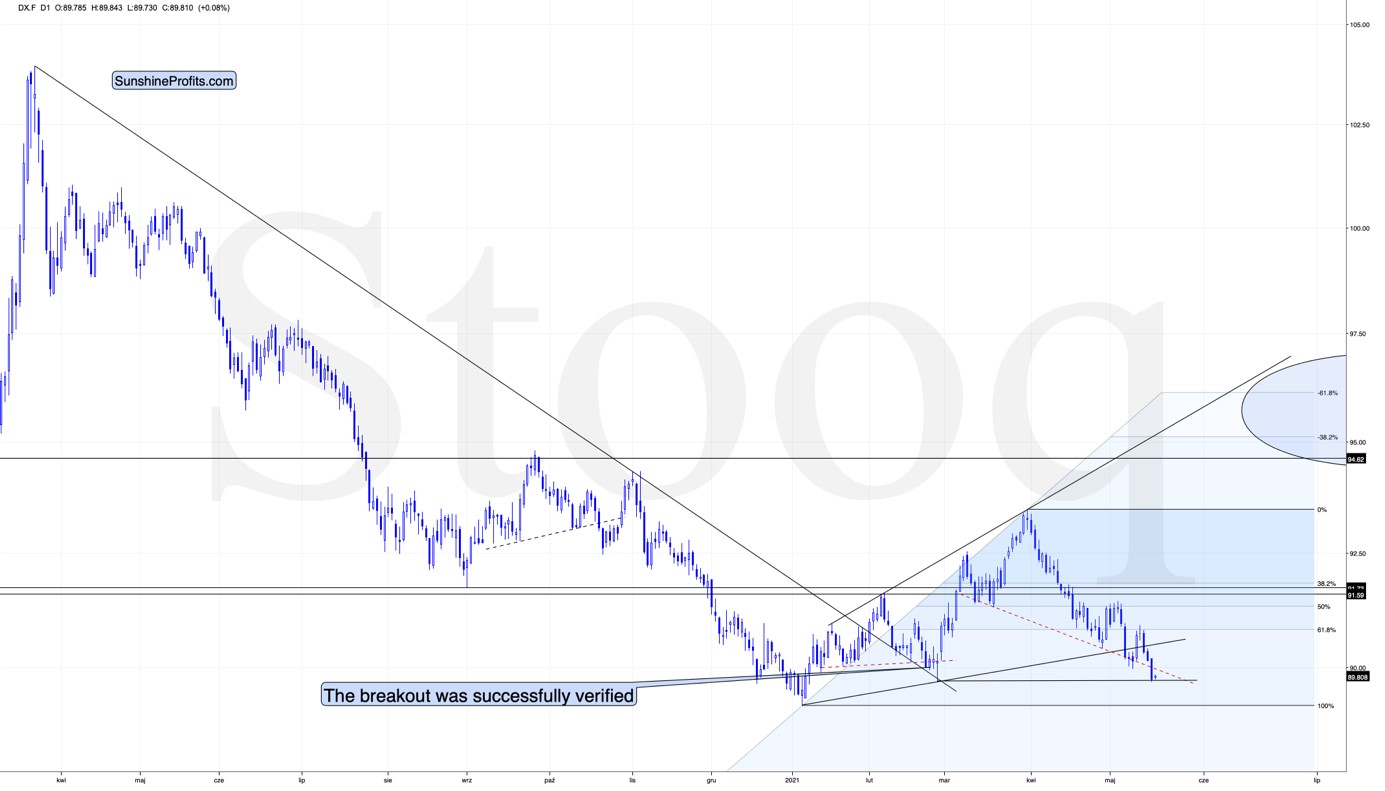
As you can see, the USD Index reached its horizontal support provided by the previous important low. Low that was formed after a fake breakdown below the neck level of a supposedly bearish head-and-shoulders pattern. The USDX is not only at similar price levels; it’s also right after a supposedly bearish breakdown below. The reversal could be just around the corner, or we might have already seen it, given today’s (small, but still) pre-market move higher.
As I mentioned above, yesterday’s sizable decline in the USDX should have triggered substantial rallies in the PMs. What happened instead?

What Happened to Gold?
Gold reversed right at its triangle-vertex-based… well, reversal, and the combination of resistance lines.
The reversal in gold took place after gold moved very close to its mid-January highs and the 50% Fibonacci retracement based on the August 2020 – March 2021 decline.
The sizes of the current rally (taking the second March bottom as the starting point) and the rally that ended at the beginning of this year are practically identical at the moment.
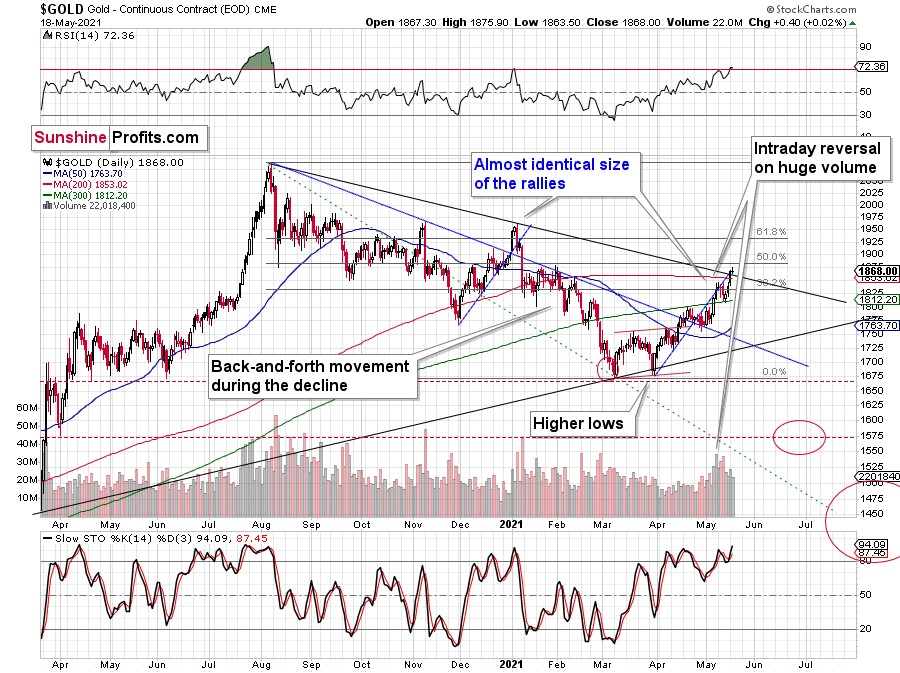
Just as the rallies from early 2012 and late 2012 (marked with blue) were almost identical, the same could happen now.
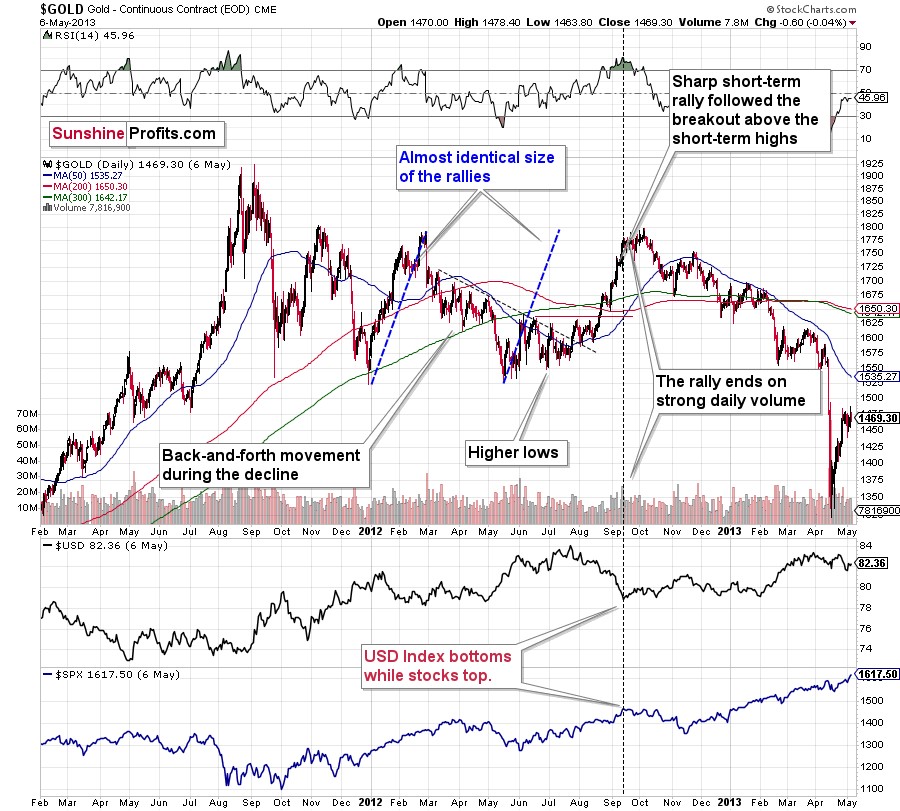
The March 2021 low formed well below the previous low, but as far as other things are concerned, the current situation is similar to what happened in 2012.
The relatively broad bottom with higher lows is what preceded both final short-term rallies – the current one, and the 2012 one. Their shape as well as the shape of the decline that preceded these broad bottoms is very similar. In both cases, the preceding decline had some back-and-forth trading in its middle, and the final rally picked up pace after breaking above the initial short-term high.
Interestingly, the 2012 rally had ended in huge volume, which is exactly what we saw on Friday. To be 100% precise, the 2012 rally didn’t end then, but it was when over 95% of the rally was over. Gold moved very insignificantly higher since that time. Most importantly, though, it was the “dollars to the upside, hundreds of dollars to the downside” situation. And it seems that we are in this kind of situation right now once again.
Interestingly, back in 2013 gold started its gargantuan (…) slide from about $1,800 and it is not far from this level also today.
Moreover, let’s keep in mind that the RSI indicator just topped slightly above 70, which is what tends to happen when gold tops. The upside seems very limited. In fact, it seems that the top in gold is already in.
The lower part of the above chart shows how the USD Index and the general stock market performed when gold ended its late-2012 rally and was starting its epic decline. In short, that was when the USD Index bottomed, and when the general stock market topped. I don’t want to get into too many USD-related short-term details, as I did that yesterday, but let’s take a closer look at the short-term developments on the stock market .
Stock Market
In short, the situation doesn’t look pretty. To explain, I wrote the following on May 11:
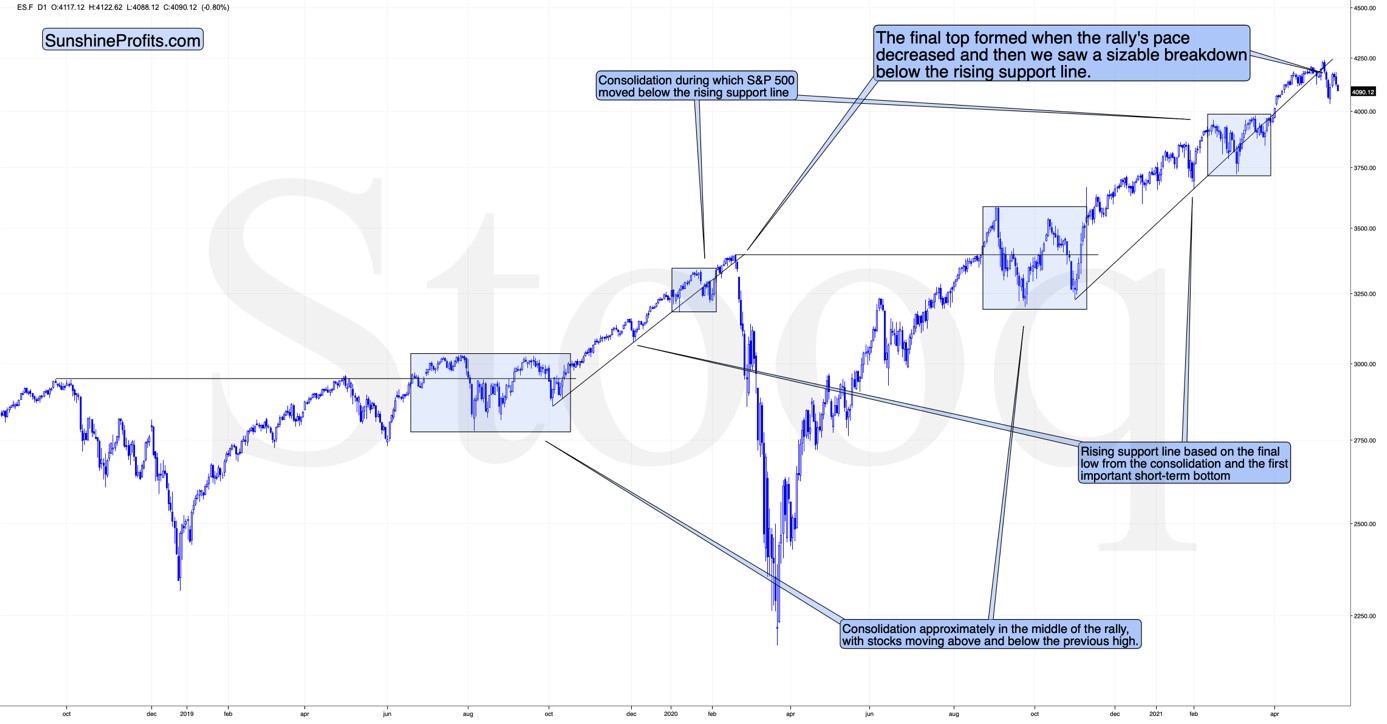
The markets are self-similar (which is another way of saying that they have a fractal nature), which generally means that while the history tends to rhyme, it also tends to rhyme in similar shapes of alike or various sizes.
For example, the rally from 2018–2020 seems very similar to the rally from 2020 to the present. Both rallies started after a sharp decline, and the first notable correction took the form of back-and-forth trading around the previous high. I marked those situations with big rectangles.
Then the rally continued with relatively small week-to-week volatility. I created rising support lines based on the final low of the broad short-term consolidation and the first notable short-term bottom.
This line was broken, and some back-and-forth trading followed, but it was only about half of the previous correction in terms of price and time.
Then, we saw a sharp rally that then leveled off. And that was the top . The thing that confirmed the top was the visible breakdown below the rising support line right after stocks invalidated a tiny breakout to new highs. That’s what happened in February 2020, and that’s what happened this month.
“Time is more important than price; when the time comes, the price will reverse”. Both rallies took an almost identical amount of time: 60 weeks vs. 59 weeks.
Stocks moved a bit higher recently, but yesterday’s and today’s pre-market decline seem to be telling investors that the initial slide was not just another correction in the bull market. This is the first time when the S&P 500 was unable to get back above its rising support line after temporarily breaking below it. Instead, we saw an attempt to rally, and now we see another slide lower.
This is bearish for gold’s forecast , but also very bearish for silver and mining stocks, which are more correlated with the stock market than gold is.
Speaking of silver, let’s take a look at its price chart.
The white metal has clearly reversed yesterday (May 18), and at the moment of writing these words, it’s trading back below its May 10 high and the $28 level. Just like it is the case with gold, it seems to me that the outlook for silver is bearish.
Mining stocks seem to have reversed in a rather odd manner, but in one that’s ultimately in tune with how tops are formed based on technical analysis principles.
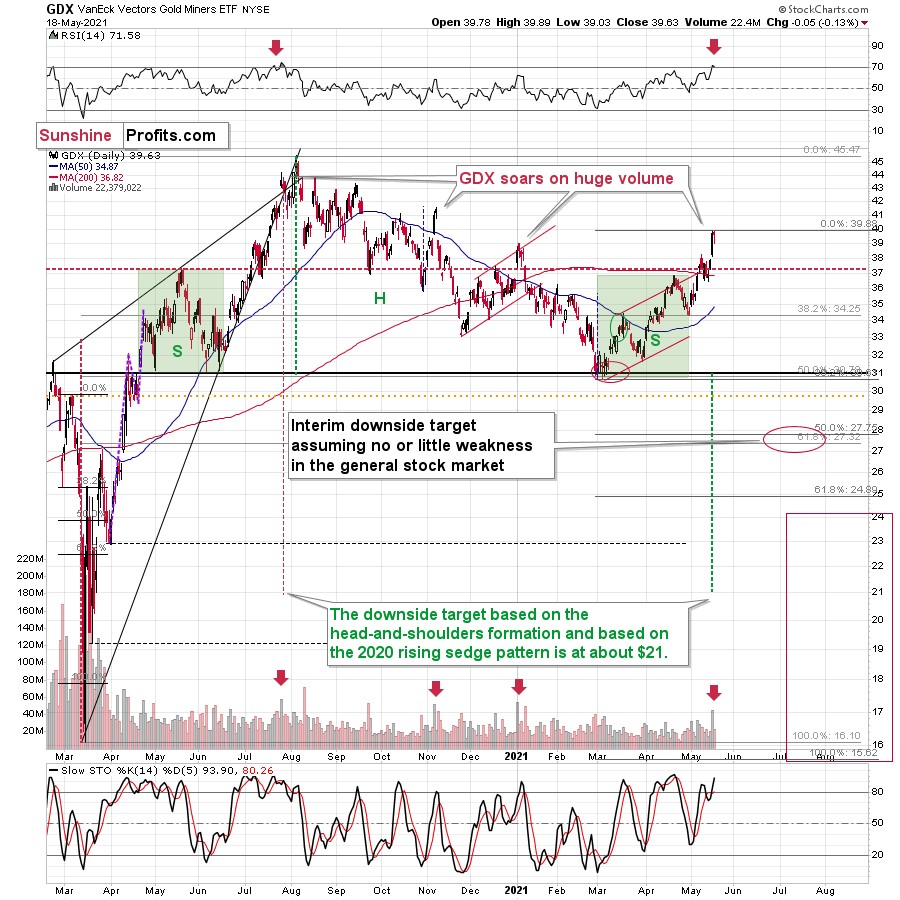
The same (or very similar) opening and closing price levels accompanied by an intraday reversal after an intraday decline – when seen after a short-term rally – are called a “hanging man” candlestick. In short, it’s one of the reversal candlestick patterns. It should have been confirmed by a huge volume – it wasn’t, so it’s not that important, though.
The most important details are still based on the preceding day’s huge volume, the RSI, and the way the GDX ETF topped in the past.
The GDX ETF soared to new highs on volume that was much greater than 40M shares. This happened only three times in the past 12 months. In each of those three cases, it was a major top, or it was very, very close to it.
The RSI just moved above 70, and it happened only twice recently. One time it heralded the 2020 top, and the other time we saw it in late February 2020 – right before a huge slide started.
Consequently, taking all the above into account, it seems to me that the situation in the precious metals market is very bearish right now, as it seems to be either topping or after the top. If I didn’t have a short position in the junior mining stocks right now, I would have opened it today.
Thank you for reading our free analysis today. Please note that the above is just a small fraction of today’s all-encompassing Gold & Silver Trading Alert. The latter includes multiple premium details such as the targets for gold and mining stocks that could be reached in the next few weeks. If you’d like to read those premium details, we have good news for you. As soon as you sign up for our free gold newsletter, you’ll get a free 7-day no-obligation trial access to our premium Gold & Silver Trading Alerts. It’s really free – sign up today.
Przemyslaw Radomski, CFA
Founder, Editor-in-chief
Sunshine Profits: Effective Investment through Diligence & Care
* * * * *
All essays, research and information found above represent analyses and opinions of Przemyslaw Radomski, CFA and Sunshine Profits' associates only. As such, it may prove wrong and be subject to change without notice. Opinions and analyses are based on data available to authors of respective essays at the time of writing. Although the information provided above is based on careful research and sources that are deemed to be accurate, Przemyslaw Radomski, CFA and his associates do not guarantee the accuracy or thoroughness of the data or information reported. The opinions published above are neither an offer nor a recommendation to purchase or sell any securities. Mr. Radomski is not a Registered Securities Advisor. By reading Przemyslaw Radomski's, CFA reports you fully agree that he will not be held responsible or liable for any decisions you make regarding any information provided in these reports. Investing, trading and speculation in any financial markets may involve high risk of loss. Przemyslaw Radomski, CFA, Sunshine Profits' employees and affiliates as well as members of their families may have a short or long position in any securities, including those mentioned in any of the reports or essays, and may make additional purchases and/or sales of those securities without notice.
*********
 Przemyslaw Radomski, CFA, is the founder, owner and the main editor of SunshineProfits.com. You can reach Przemyslaw at: http://www.sunshineprofits.com/help/contact-us/.


