Gold Stocks Leading The Pack Higher?


One may say that not much has happened last week in case of gold and silver, but it’s impossible to describe the action in mining stocks in the same way. Miners started the previous week with a slide only to come back with vengeance before the week was over, changing the short-term picture for the entire sector. The weekly price changes show little changes as long as you only have a quick glance at them, without really digging into details. We did much more than just a glance. We unearthed… a weekly record. Last week was not as dull – overall – as it seems. It was a record-breaker in one precious-metals-related aspects. And since the implications extend from short- to medium-term, it’s definitely something that PMs traders need to consider. And it’s why we’ll start with it.
Many precious analysts stop their analysis at gold’s US dollar analysis alone. Sometimes they add silver or – at most – mining stocks to the picture. But the focus on key ratios and on gold’s performance in terms of other currencies is rare. Silver’s non-USD performance is almost never discussed. And it’s a shame, because that’s where the current weekly extreme can be found.
Silver’s Non-USD Performance
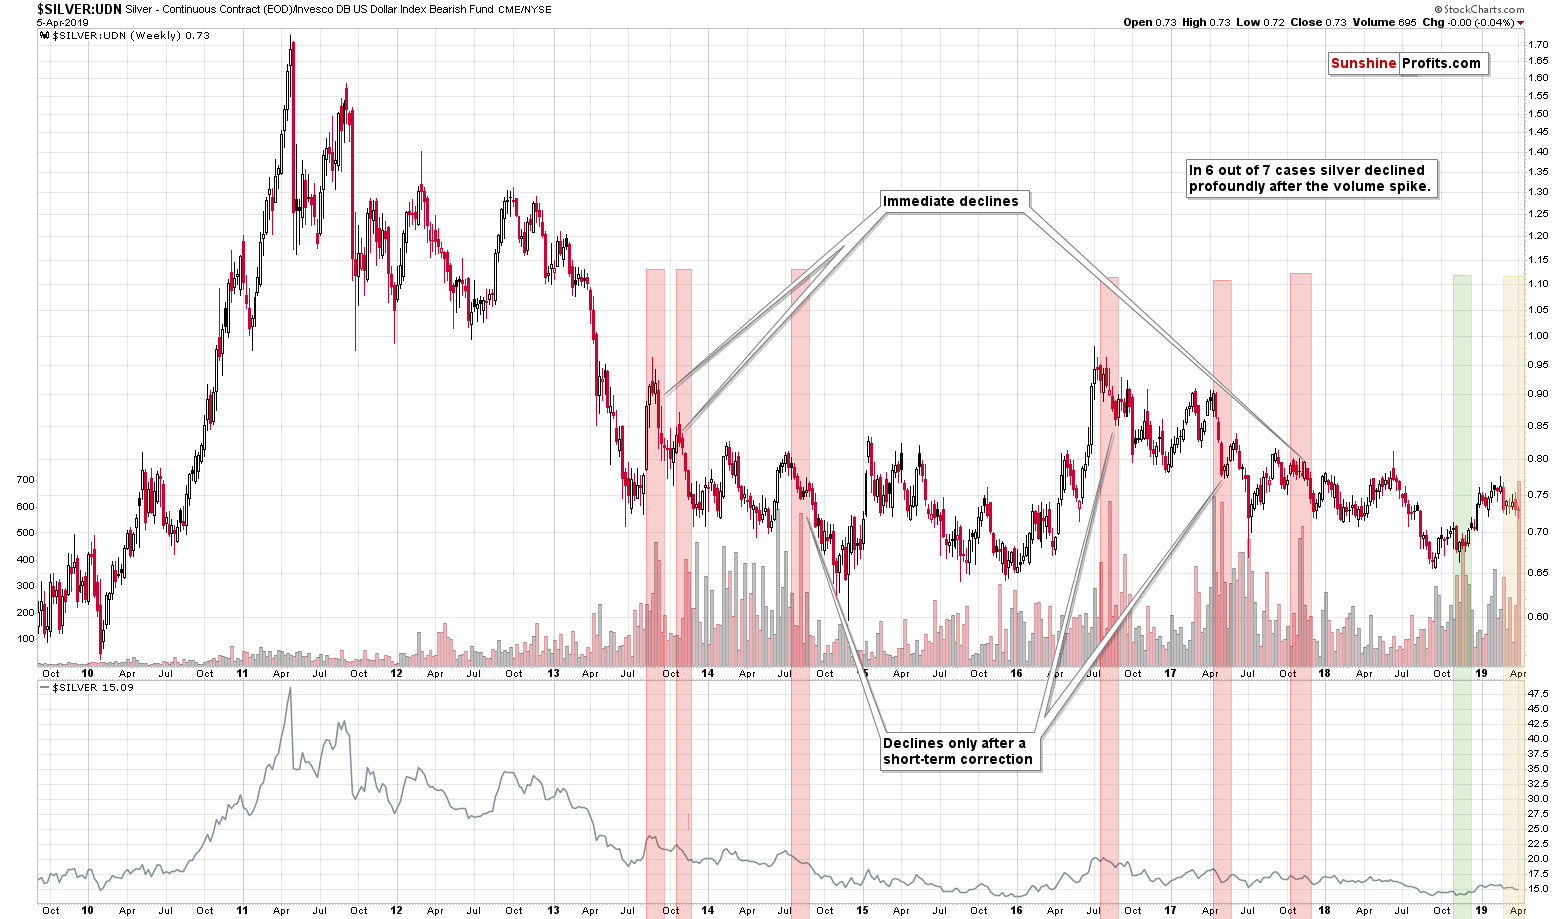
The above chart shows the silver to UDN ratio chart, which is a proxy for silver’s price in terms of currencies other than the US dollar. The UDN ETN is an inverse vehicle that’s based on the USD Index.
In order to check how silver would be doing without USD’s influence, we need to take the latter “out” of the silver price. If the USD was moving in the same direction as silver, we would simply divide silver’s price by the USD Index and we would get the desired values. But, since USD and precious metals move in opposite ways, we need to do the opposite – we will first inverse the USDX so that it moves – on average - in the same direction as the PMs, and then we will divide silver by it. The UDN ETF is an inverse USDX instrument, so it does exactly the above. The silver to UDN ratio is effectively very close to an indicator of silver strength on its own.
What is so special about the above non-USD silver chart? One thing is that it allows for technical analysis that could point to some developments earlier than in case of the regular USD perspective. That’s not the main point here, though. Besides, using ETNs that have sizable time decay can make their technical analysis considerably less effective than the analysis of the underlying, unleveraged instrument (that’s why it’s a mistake to focus on price formations in leveraged ETNs such as NUGT and DUST).
The special feature of the above chart is not the price, but the volume. And in particular, the ratio of volumes. Whenever people get excited about silver and at the same time they are not excited by the USD Index (at least as far the UDN ETF as a proxy for it shows), we get high readings in the volume. If the difference is huge, we get volume spikes.
Naturally, on a daily basis, there would be many spikes as there can be many individual reasons due to which a the UDN ETN can move on sizable volume, and these spikes would not necessarily be meaningful. But, in case of weekly price changes and weekly volume changes, these individual moves should average out, and the readings that we get should be meaningful.
Moving to the point, the weekly volume spike that we saw last week was the biggest that we ever saw.
Why should you care? Because in 6 out of 7 cases where we saw these huge volume spikes silver plunged either sooner or later. That’s the key implication – the silver picture remains strongly bearish for the medium term.
What is very interesting is the short-term implication. Half of the above-mentioned 6 bearish cases was followed by a decline immediately, but the other half was followed by a short-term upswing before the big move lower resumed. If we add the remaining – bullish – case to the above, we get a 4 out of 7 (57.14%) cases that support the bullish outcome in the near term.
This is in perfect tune with last week’s bullish reversal in gold, silver, and – especially – mining stocks.
This is also in perfect tune with what we have identified as an important, yet little known, extreme sign from the silver sector. Silver’s non-USD chart is not the only silver place where we saw record-setting volume spike. Silver stocks provided the heads-up even earlier.
Silver Stocks Lead In
Gold price usually moves in tune with the silver price, and silver stocks usually move in tune with silver. The sizes of the moves are not identical, but the turnarounds often take place at the same time. The price moves are similar enough to say that the big moves will take place at the same time, but they are different enough for the markets to provide different signals. At times, one market might lead the other. There may also be other specific features and in today’s Alert, we’ll focus on one of them.
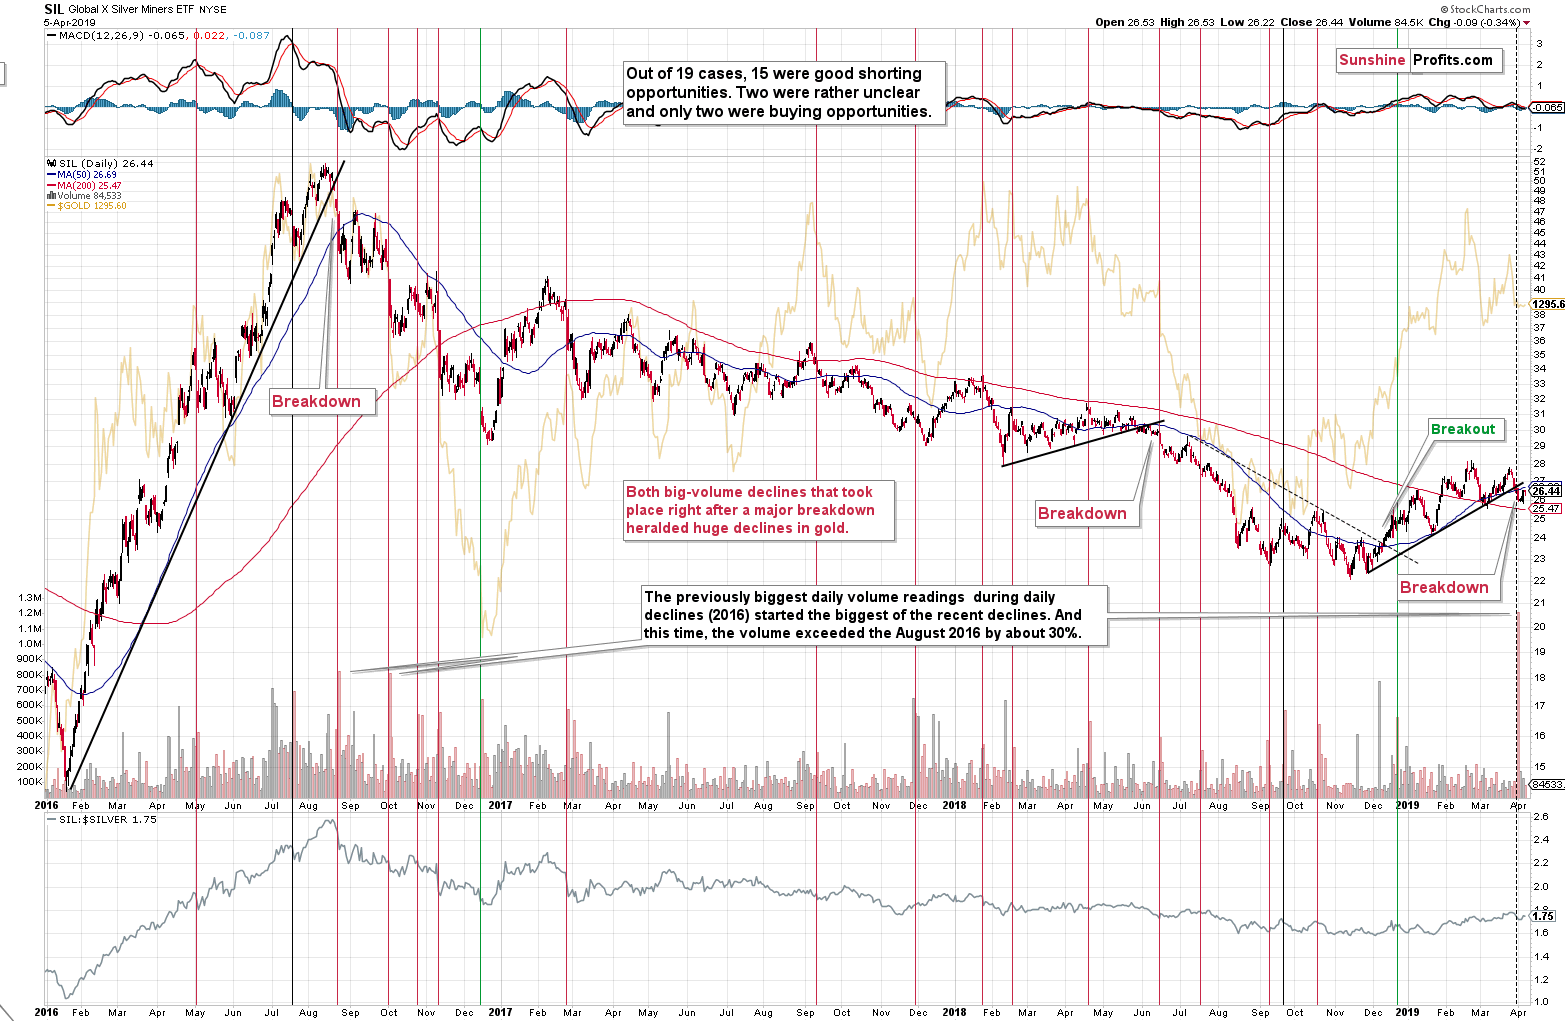
Namely, we’re going to discuss the huge daily volume spikes. And in particular, we’re going to focus on days when the silver miners (we’re using the SIL ETF as a proxy for the sector) declined on big volume. There were quite a few such days since early 2016 and they were almost all characterized by analogous price action - not only in the case of silver miners, but also in the case of gold.
To put it simply, gold usually took a dive after silver miners declined on huge volume.
The above doesn’t reveal the efficiency, nor the severity of the signal, though.
As far as efficiency is concerned, there were 19 signals and 15 of them were good (or excellent) shorting opportunities. In two cases, it was unclear if it was a good shorting opportunity or not. There were only two cases when the signal clearly failed: in December 2016 and in December 2018.
The professional approach is to focus on the losses or things that invalidate a given theory first, and that’s exactly what we’re going to do now. Let’s start with the two cases that were actually buying opportunities. In the opening paragraph, we have mentioned that these two cases are not similar to the current situation. Both cases took place in December and we’re far from this month, but that’s not the main point.
The main point is that in the first – 2016 – case, both: gold and silver miners were already after a several-month-long decline and thus big volume might have really signified the exhaustion of the trend. The second – 2018 – case is when silver miners were right after a breakout. Not only are the miners not after a breakout right now, but they are actually after a breakdown.
Having said that, let’s move to the two unclear cases. One of them was mid-July 2016 case where the market moved higher one more time before forming the final top, and the other one was the September 2018 situation, when the market moved lower in the near term, but that was actually the start of a bigger upleg. One case was a good shorting opportunity in the medium term, but a bad one in the near term, and the other case was the opposite. None of them clearly invalidated the signal, but to be conservative, we can say that only one additional case confirmed the signal, while the other one didn’t. This means that we get the ultimate efficiency of 84.2% (16 out of 19). That’s an extremely high efficiency and…
That’s not everything.
You see, the very recent price/volume action in silver stocks was not average. It was special. There are two reasons for it:
- The daily volume early last week was higher than what we have seen previously. In fact, it was highest daily volume that we ever saw in case of the SIL ETF.
- The volume spike took place right after a major breakdown.
April 1 volume in the silver miners was no April Fools’ Day joke. It exceeded the previous record by about 30%. Out of the recent years, we saw the biggest daily volume during a decline in silver in 2016: in August and September. That was the beginning of the biggest decline in gold of the recent years. In other words, the only analogy that we have based on the size of the volume points to the biggest decline in the recent history. And the volume was even bigger this time – it broke the previous record. Will the decline be bigger than the late-2016 one? That’s what is very likely based on many other techniques and what the above silver chart is confirming.
Moving to the second point, silver miners are right after a major breakdown. There were two similar breakdowns in the recent past that were then followed by the huge-volume signal. That was in August 2016 and in June 2018. In both cases, silver miners and gold continued to decline for many weeks.
Both the above-mentioned factors suggest that 84.2% efficiency is likely understated and should in reality be higher. In particular, both links point to analogy between the current situation and what we saw in August 2016. It then took gold less than 4 months to decline over $200. And let’s keep in mind that the volume was much higher this time, so the move – based on the above chart alone – could also be bigger this time.
There are two things that we would like to add to the above quote based on the recent short-term developments:
- Silver miners broke below their rising black support line and the recent upswing serves as a verification of the breakdown – it’s not bullish, it’s a natural part of a bigger, bearish move.
- The silver miners’ chart shows that the December 2018 case is not as the current situation, and in case of the silver’s non-USD chart, the only case when the white metal didn’t decline in tune with the other cases was in late November 2018 – very close to the above-mentioned case. The only case that invalidates the analogy seems to be less relevant than other cases, which increases the reliability of the silver’s non-USD volume spike signal and its bearish implications for the medium term.
Still, the above doesn’t rule out the possibility of seeing a short-term upswing before the decline resumes. Silver stocks would likely simply verify their breakdown in this case. This kind of performance wouldn’t change anything that we wrote previously.
The full version of the above analysis also includes the assessment of the gold to Japanese yen ratio or how gold miners action fits into the 2012-2013 – now link in gold. Other crucial factors, patterns and thoughts not discussed in today’s paper are also covered. Altogether, they provide key clues as to the next short-term moves, vital confirmations and superb analytical strength. They shape how we and our subscribers play there moves and are discussed in the full version. If you’d like to read it and receive follow-ups (including the intraday ones, when things get hot), we invite you to subscribe to our Gold & Silver Trading Alerts today.
Przemyslaw Radomski, CFA
Editor-in-chief, Gold & Silver Fund Manager
Sunshine Profits - Effective Investments through Diligence and Care
* * * * *
All essays, research and information found above represent analyses and opinions of Przemyslaw Radomski, CFA and Sunshine Profits' associates only. As such, it may prove wrong and be a subject to change without notice. Opinions and analyses were based on data available to authors of respective essays at the time of writing. Although the information provided above is based on careful research and sources that are believed to be accurate, Przemyslaw Radomski, CFA and his associates do not guarantee the accuracy or thoroughness of the data or information reported. The opinions published above are neither an offer nor a recommendation to purchase or sell any securities. Mr. Radomski is not a Registered Securities Advisor. By reading Przemyslaw Radomski's, CFA reports you fully agree that he will not be held responsible or liable for any decisions you make regarding any information provided in these reports. Investing, trading and speculation in any financial markets may involve high risk of loss. Przemyslaw Radomski, CFA, Sunshine Profits' employees and affiliates as well as members of their families may have a short or long position in any securities, including those mentioned in any of the reports or essays, and may make additional purchases and/or sales of those securities without notice.
 Przemyslaw Radomski, CFA, is the founder, owner and the main editor of SunshineProfits.com. You can reach Przemyslaw at: http://www.sunshineprofits.com/help/contact-us/.


