The Golden Triangles


My last article "gold stocks are breaking down" has incited a few hate mails from the gold bugs. Some of them wrote to apologize after learning that I've been a gold bull since 2001, and my last sell signal was primarily for hedging since many of our subscribers are holding long term profitable positions. However, despite the rally this week, nothing has changed. The "head & shoulder" topping pattern is still in play and will not be negated until the right shoulder is exceeded. And the good news is, until the neckline is violated, there is a good chance this topping pattern could be negated. I've been trading the gold sector since 2001, with the first purchase around $275. After reviewing some old data stored in an old disk, I came across the following chart which reminds me of a very significant pattern in the gold sector, something which has helped tremendously during previous corrections.
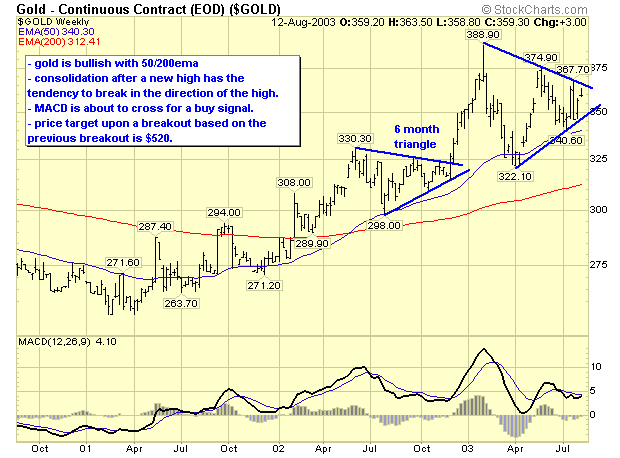
Gold is a volatile commodity, and the beauty of this market is that it constantly corrects and consolidates, and therefore, it is quite normal to drop 10 to 20% very sharply after a rally to new highs, to begin this self correcting process. The first triangle was a drop of 10% and lasted about six months. The second triangle was a drop of 20% and lasted about six months.
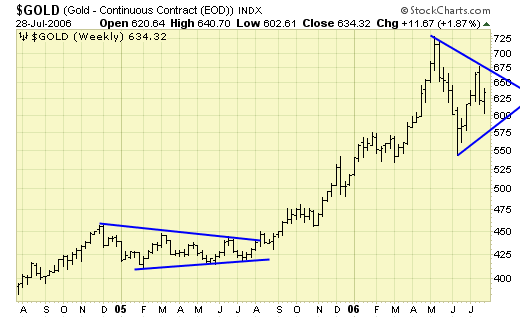
The third triangle dropped about 10%, but lasted eight months. The current correction dropped 24% and it is not yet three months long so far.
Summary
Assuming the sell off since May is a correction and not the end of the bull market, there are a few conditions which should be met.
- prices should not exceed the low of $550. If it does, the correction scenario is out and gold will be in a new down trend.
- prices should continue sideways for at least a few more weeks.
How did gold stocks as represented by the $HUI do during these gold corrections?
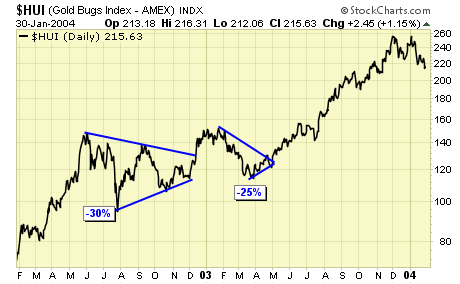
Correction #1 dropped 30% and lasted six months. Correction #2 dropped 25% and bottomed after two months. This quick correction was probably due to the close proximity of the previous correction.
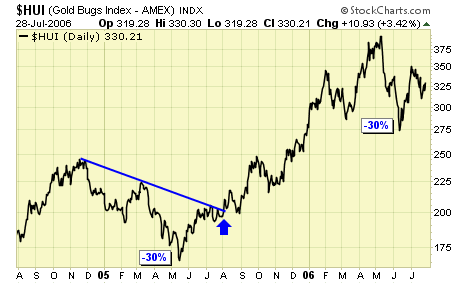
Correction #3 dropped 30% and lasted 6 months. Correction #4 has dropped 30%, and currently in its ninth week of correction.
Summary
Also assuming we are in a correction and not the end of a bull market in gold stocks, the correction in price has been satisfied, but the correction in time has not been satisfied. The future of gold and gold stocks are quite clear at this point: prices should not go below the June low to stay bullish, and sideways action is likely for a few more weeks before the next leg up. If and when we do get the breakout, allocations should weigh heavily in the gold sector for the best potential return. Traders be mentally prepared for more potential whipsaws as prices continue to be volatile during this consolidation. Once again, our breakout model should help to guide us during this difficult trading environment……
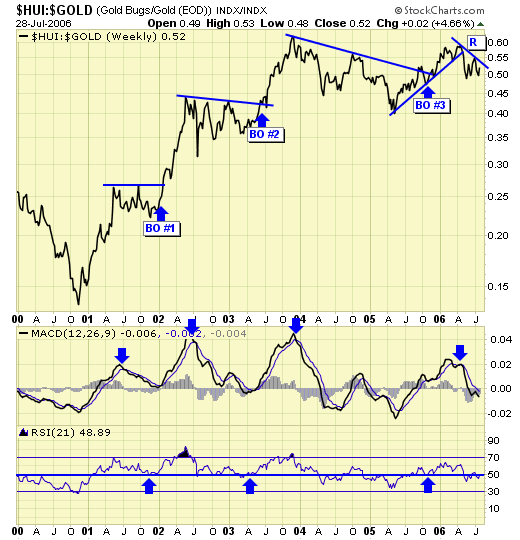
BO #4 cannot occur until current resistance is broken at the minimum. Then the old high near .60 must be exceeded for a legit breakout because BO#3 failed to take out that old high after BO#2. In any event, time is on our side, and for those who watch the markets closely everyday, the next few weeks could seem like eternity as prices will likely remain very volatile within this major correction. Those holding long term positions can continue with the hedging until BO#4. Those in cash remain patient, wait for signals and set ups, and be prepared to be whipsawed a few more times if the signals occur before the major breakout. Conservative folks can simply sit it out until BO#4, you may end up buying higher but it will more than make up for the potential whipsaws short term traders are likely to suffer over the next few weeks.
********

Jack Chan is the editor of Simply Profits, established in 2006. Chan bought his first mining stock, Hoko Exploration, in 1979, and has been active in the markets for the past 37 years. Technical analysis has helped him filter out the noise and focus on the when, and leave the why to the fundamental analysts. His proprietary trading models have enabled him to identify the NASDAQ top in 2000, the new gold bull market in 2001, the stock market top in 2007, and the US dollar bottom in 2011.


