Gold's Highest Hurdle Toward 1400


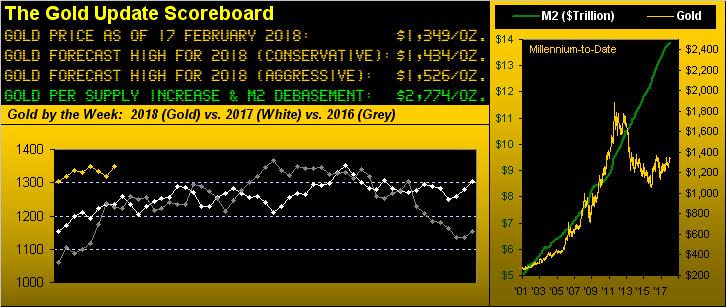
Such a high hurdle indeed: Base Camp 1377. For as we stated a week ago, each time gold as if a magnet pulls in the prices of the 1360s, 'tis is repelled by the pushing forces emanating down from the opposing iconic magnet at 1377, ostensibly gold's highest hurdle in history:

We've already seen gold having wasted little time in taking out last year's high (1362) by trading up to 1365 on 25 January. Then having since endured a little ebb in its stead, this past week gold challenged that high but to fall a point shy at 1364 ... and then unraveled in settling out the week yesterday (Friday) at 1349.
And all about came the shout of the Dollar being en route for its biggest weekly loss in two years. Stop the presses, for from the "Change is an Illusion, Price is the Truth Dept." comes our updated monthly chart of the Dollar Index. And as was the case three missives back, we find the Dollar (89.045) still pretty much where 'twas in late January, rather desperately clinging to the two violet lines of "once resistance now support". Quel drame, eh?
Still of late, 'tis been the world against the Dollar as, save for the Bond the balance of our BEGOS Markets (Euro/Swiss, Gold/Silver/Copper, Oil, S&P 500) have been in lockstep positive price correlation for better than a week.
"Wait a sec, mmb: you said last week that the S&P was going to drop 25%. What happened?"
Yes, Squire, but not all in one week. As was written: "Whether that occurs in full this month, or 'conveniently' right up to November's mid-term elections", our S&P downside target remains 2154, (which is 25% less than the S&P 500's all-time closing of 2872 on 26 January). In fact, if you observed the S&P's bollocking back up this past week, you'd have noted that it comprehensively ran out of puff on Friday essentially smack on a perfect Golden Ratio retracement from the recent low. And why? Because that infamous ratio is programmed into every algorithmic trading script from here, Squire, to Uranus. "Let the selling resume!"
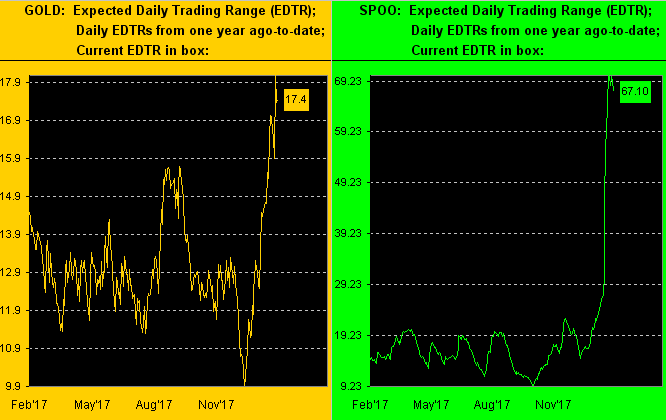
To be sure, the stock market's gain this part week hardly puts a broader decline at bay. The daily contract volume of the S&P 500 futures continues running above average with bids and offers at but half their usual size. Each time we log into our trading platform, we're warned about margin requirements having been moved from X to Y. Thus the trading volatility remains amped up as we expect shall be the case for some time to come. To wit, the following two-panel chart depicts from a year ago-to-date the "Expected Daily Trading Range" for both gold on the left and the S&P on the right. Gold's EDTR at 17 is running several points above its norm; but look at that for the S&P: 67 points per day vs. a norm of less than 20 ... again, that is scary:
Moreover, technical confusion is dominating some of the textbook measures for the S&P: at week's close, our "Bollinger Bands" reading shows the S&P still in recovery mode from being "oversold", yet our "Relative Strength Index" states it as "overbought". What to do? This technical anomaly has occurred but one other time in this millennium: 'twas on 21 June 2011. Then come early that October, the S&P had declined from the 1300s into the 1000s ... during which stretch (as you well know) gold went on to record its All-Time High of 1923 on 06 September. Not that history always repeats, of course, but ... when is market confusion not a Gold Positive? Or as Goldman's Lloyd Blankfein quipped this past week with respect to the StateSide tax cut, increased government spending and interest rate pressures: "The odds of a bad outcome have gone up".
So what about the odds of the "S"-word rearing its ugly head? "Stagflation" certainly was a highlight we saw in the bevy of data fed this past week into the Economic Barometer. Import prices up; wholesale inflation up; retail inflation up; retail sales down; industrial production down, capacity utilization down. Add in the rise in the Philly Fed Index, but a decline in the New York State Empire Index and what do we have? An Econ Baro confused:
To borrow from the late, great Greg Lake, confusion may be the market's epitaph, but we like the uptrend we're seeing next in gold's graph. The rightmost weekly bar has bounded up off the dashed trendline, the rising blue dots of parabolic Long trend offer plenty of wiggle room (80 points) between their level at 1269 and the present price of 1349, and as formidably high is the hurdle at Base Camp 1377, 'tis time for gold to slather on some liniment and "Go Go Go" for it!
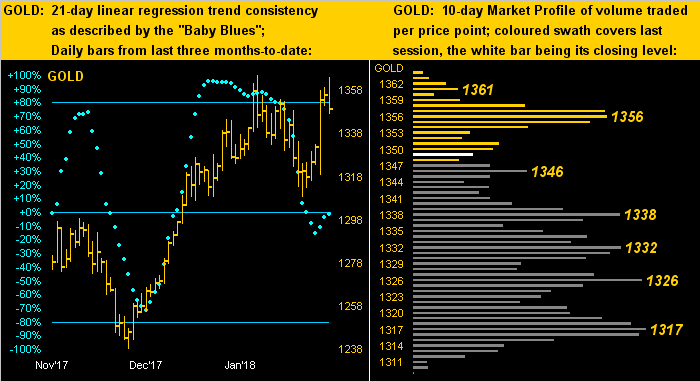
Note as well as we next turn to gold's daily bars (below left) from three months ago-to-date, the slide of the baby blue dots has been curtailed right 'round their 0% axis: that means although the 21-day linear regression uptrend came undone, it hasn't to this point become a downtrend, despite price's recent pullback coming out of January. In the 10-day Market Profile (below right) the resistive apices have morphed into those of support. Should Gold clear the 1356 apex in the new week, the door really does open for a new yearly high and the run to Base Camp 1377:
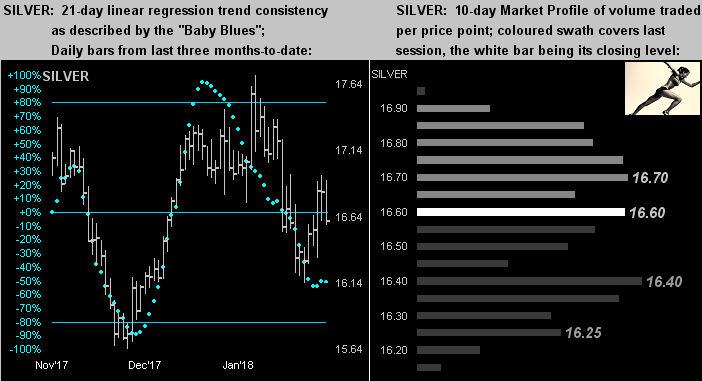
Silver this past week, too, recovered. But unlike the yellow metal, the white metal is in a 21-day linear regression downtrend, her "Baby Blues" being below their 0% axis and price more centered in her Market Profile, whereas that for gold is positioned higher. No wonder, therefore, that the Gold/Silver ratio has increased to 81.3x: Gold may face having to hurdle 1377, but Sister Silver has track privilege to simply sprint 'round the outside in order to catch up:
Speaking of making tracks, here's Gold's Stack:
The Gold Stack
Gold's Value per Dollar Debasement, (from our opening "Scoreboard"): 2774
Gold’s All-Time High: 1923 (06 September 2011)
The Gateway to 2000: 1900+
Gold’s All-Time Closing High: 1900 (22 August 2011)
The Final Frontier: 1800-1900
The Northern Front: 1750-1800
On Maneuvers: 1579-1750
The Floor: 1466-1579
Le Sous-sol: Sub-1466
Base Camp: 1377
2018's High: 1365 (25 January)
10-Session directional range: up to 1364 (from 1309) = +55 points or +4.2%
Trading Resistance: 1356 / 1361
Gold Currently: 1349, (expected daily trading range ["EDTR"]: 17 points)
Trading Support: 1346 / 1338 / 1332 / 1316 / 1317
10-Session “volume-weighted” average price magnet: 1334
2018's Low: 1305 (02 January)
Neverland: The Whiny 1290s
The Box: 1280-1240
The Weekly Parabolic Price to flip Short: 1269
The 300-Day Moving Average: 1262 and rising
In closing, this perhaps smallest chart tells the biggest story: let's again put into stark perspective just how little the stock market has thus far come off. Here we've updated the monthly track of the S&P 500 for the past thirty years. Obviously the wee rightmost hook is where the S&P now sits, the level of the recent low (-11.8%) as noted at 2532. And yet we read such silliness as "Eight things to watch for that the US stock rout is over". What was the phrase we used last week? "...the complacency, the ignorance, the greed, the naïveté..." Upon completion of the -25% run down to 2154, we'll then accept "rout" as a dutiful description:
"Ladies and Gentlemen, the high hurdles event is about to begin. In lane No. 1: Gold!"

Mark Mead Baillie has had an extensive business career beginning in banking and financial services for two years with Banque Nationale de Paris to corporate research for three years at Barclays Bank and then for six years as an analyst and corporate lender with Société Générale.
For the last 22 years he has expanded his financial expertise by creating his own financial services company, de Meadville International, which comprehensively follows his BEGOS complex of markets (Bond/Euro/Gold/Oil/S&P) and the trading of the futures therein. He is recognized within the financial community of demonstrating creative technical skills that surpass industry standards toward making highly informed market assessments and his work is featured in Merrill Lynch Wealth Management client presentations. He has adapted such skills into becoming the popular author each week of the prolific “The Gold Update” and is known in the financial website community as “mmb” and “deMeadville”.
Mr. Baillie holds a BS in Business from the University of Southern California and an MBA in Finance from Golden Gate University.


