Markets Broiling


The markets have been quite volatile recently, not so much in terms of major trends – as yet? – but definitely in terms of high volume activity, many signs of intervention in most markets and lack of proper and clear direction. It is like the weather when clouds begin to build up helter skelter, streaming east then off to the north; changing shape almost continuously and with sudden gusts of wind along the surface to blow leaves and papers hither and thither. The warning signs are there that something is brewing and it won’t be something good, it seems.
One could speculate whether it is the trend to higher inflation which is causing all the activity in the financial markets, or is the turmoil going on the precursor to the higher inflation? Perhaps it is a recurring cause-effect cycle of feedback between the trend to higher inflation and increasing uncertainty as a consequence of a badly mismanaged pandemic virus and the resulting effects on the economy. Whatever it is, this is all now history and the focus should be on what is likely to happen. How to survive is of greater importance now than how to identify and fix the problems later to prevent similar mistakes in a hopefully more benign future.
On the inflation front, the routinely under-reported month on month CPI for January was 7.5% after the 7.0% of January. That is a month on month increase also of 7% over the December figure. Should this rate – which has been increasing through most of 2021 – be sustained at this level (unlikely?) for the rest of 2022, the year will end with a month on month CPI of 21%. Even if the month on month rate declined by half to ‘only’ 3.5%, in December the CPI could exceed 14%. Month on month! Granted, few people would expect this to really happen, but this probably rather example paints a dismal picture of what 2022 could be like.
No wonder the markets are in turmoil, partly because some of them have reached levels that paint a very optimistic picture of the future, compared to what reality may well turn out to be. Here are some views of where equity markets and the dollar could go to during this year and probably into 2023 and beyond.
Following the Covid sell-off of March 2020, the S&P500, broad measure of Wall Street proper, settled mostly in the upper band of its steep new bull channel. The index has reversed lower after making a recent new all time high, this despite a very high daily turnover that revealed the presence of a strong buyer who is keen at almost any cost to keep prices from starting a slide. There is no need to guess about the source of the funds to keep on doing so, yet still with the question on whether it can last.
The S&P500 recently broke below the upper band for the first time in almost 2 years, then recovered to make a tight double top. Last week, the losses on the last two days have taken the index back into the lower band. This week should prove decisive.
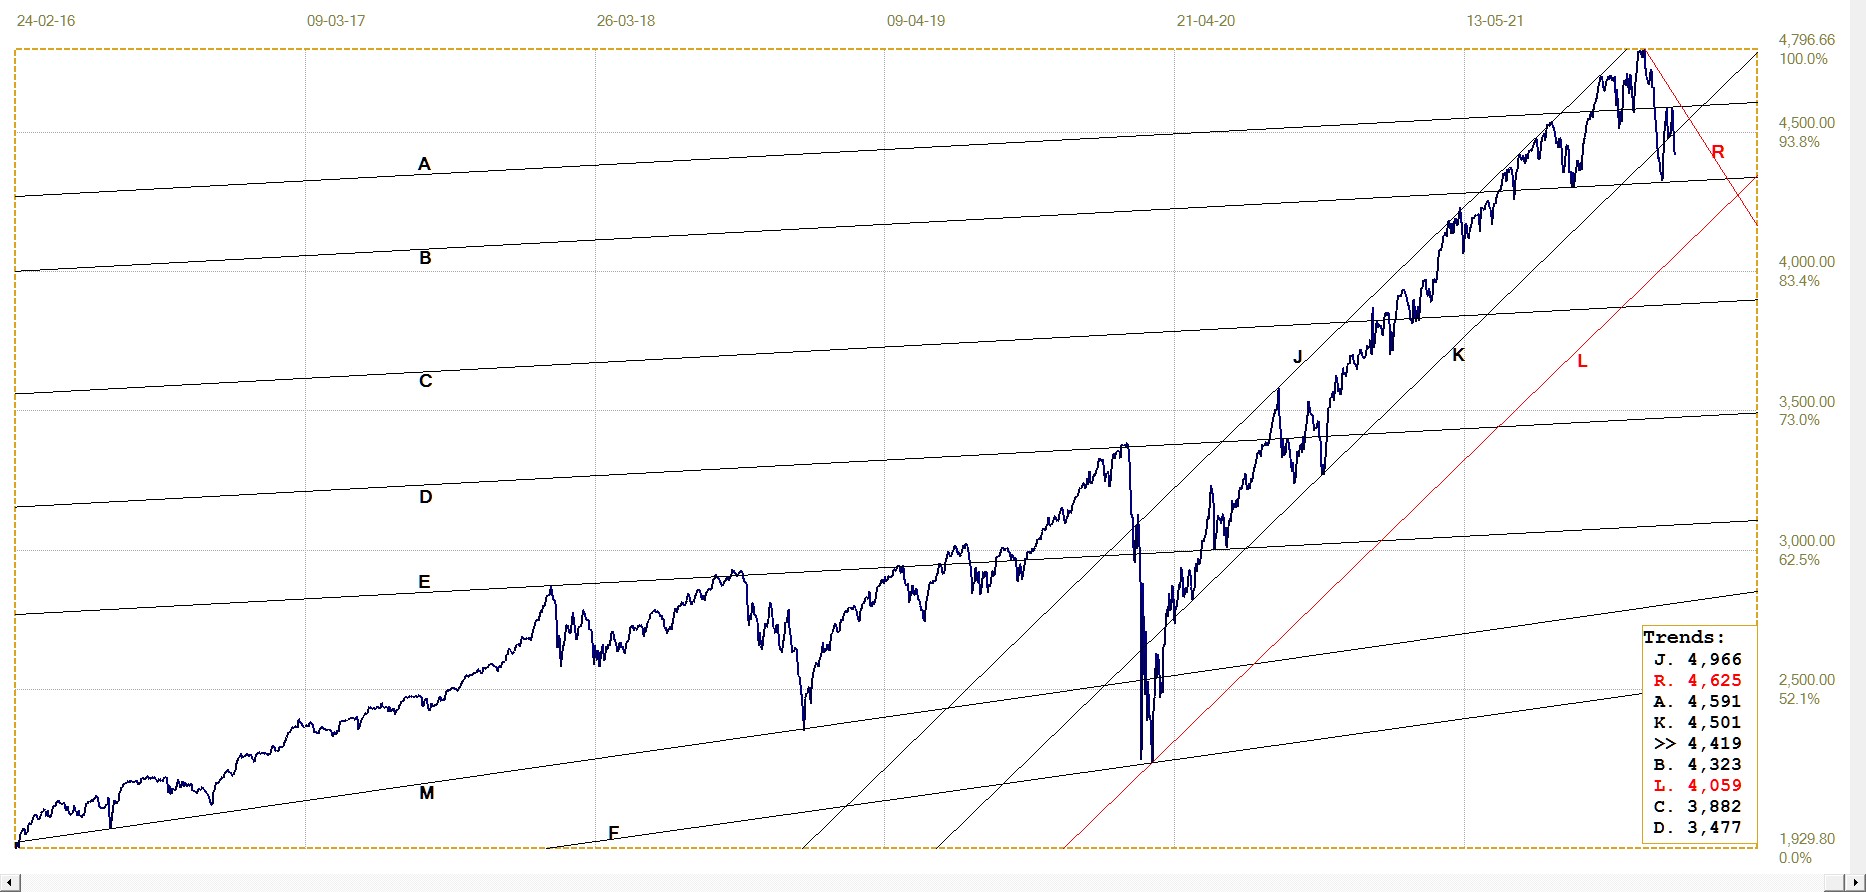
S&P500. Last = 4418.64
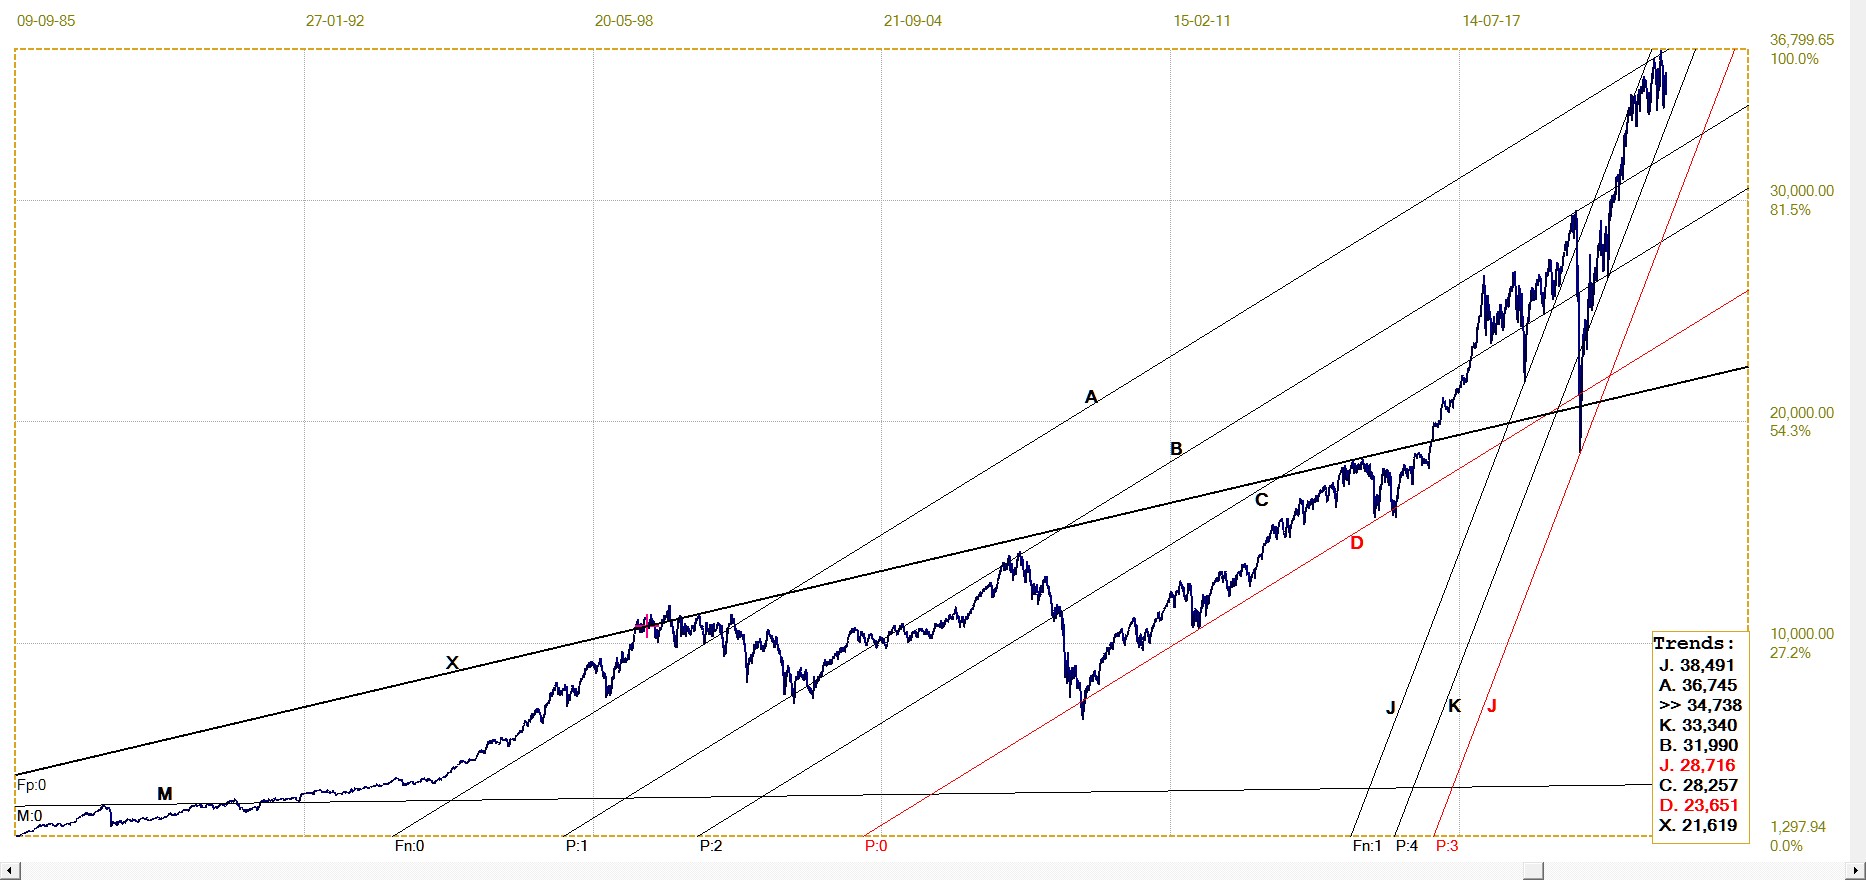
DJIA daily close. Last = 34738.06
The longer term view of the DJIA is very similar, with the DJIA also holding in the upper band of an even steeper bull channel; doing so with more recent success than the broader market. The 3 month average of the trading volume in the top 30 shares is now 371 million shares after having been close to 300 million about a month ago. It must have required a pretty large amount of dollars to prop up the market given the recent much higher volume of selling as investors flee the stock market. There is always the possibility that the Buyer can off-load purchases again once a sufficiently high volume of stop loss orders has been triggered, but the net outflow must still be on the high side; while Bears are stopped out, the higher prices will draw many more genuine sellers who readily accept higher than expected prices.
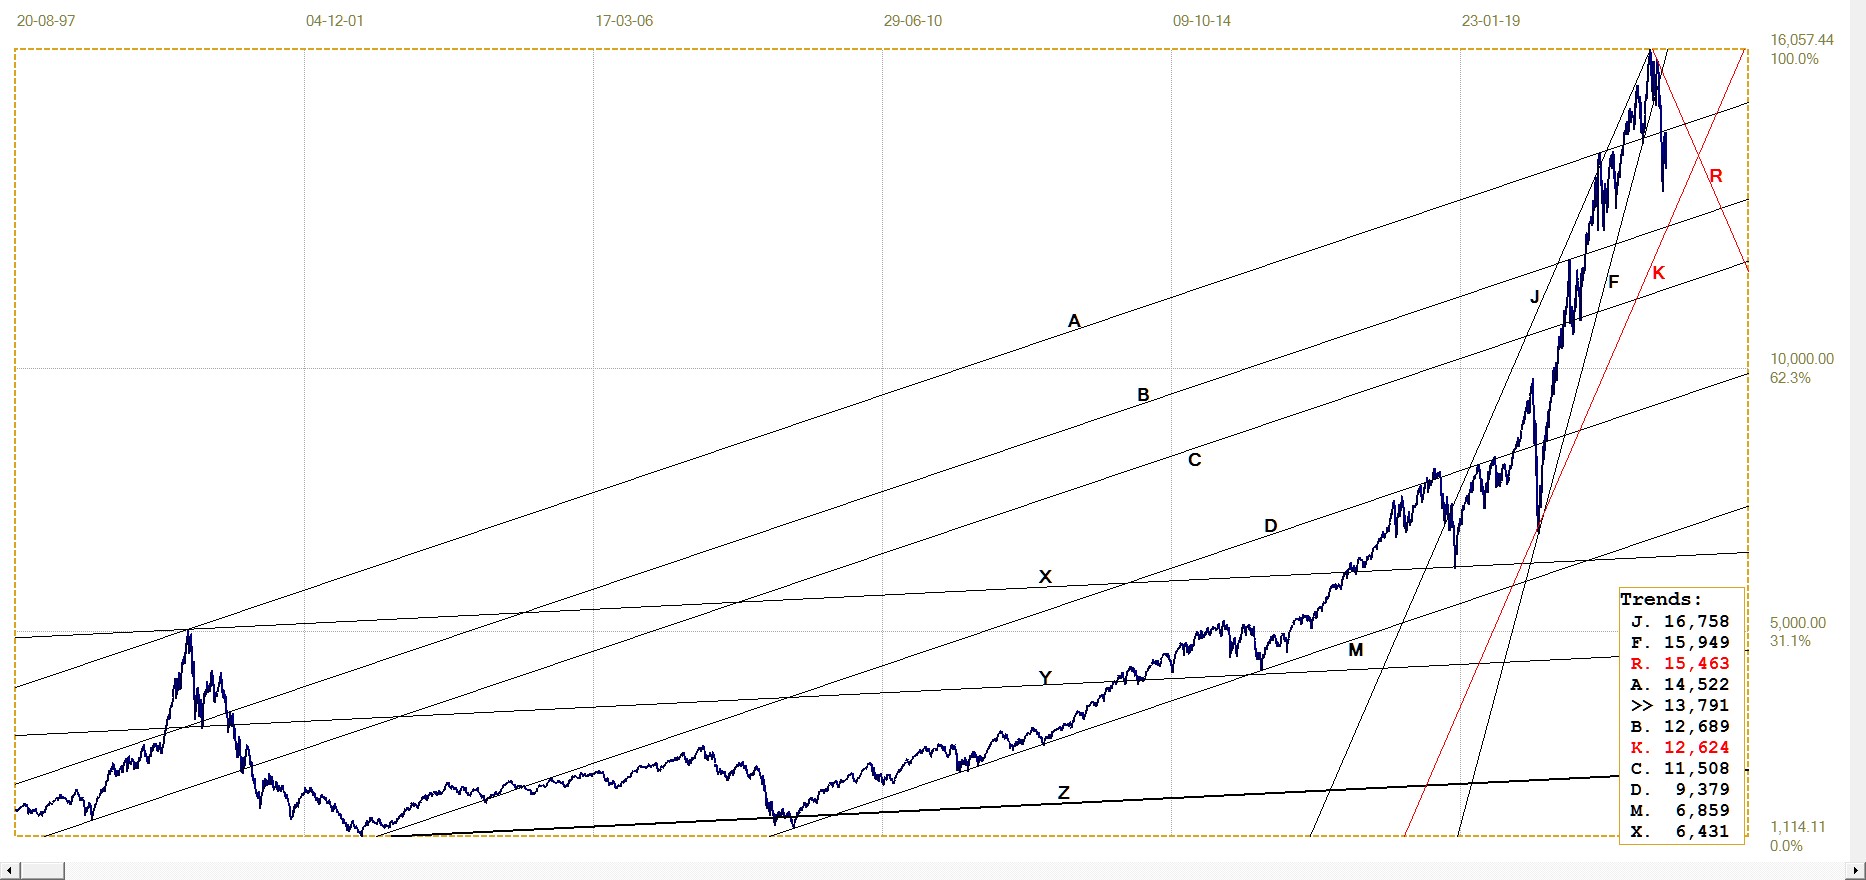
Nasdaq. Last = 13791.49
The Nasdaq chart shows the index holding in an even steeper rising wedge than the channel of the DJIA, but as people say, the higher they fly the greater they fall. The Nasdaq has already broken decisively from the wedge and back into shallower channel AB. A correction of the FB triggered sell-off has the index back at line B, seemingly in an attempt to recover into channel AB. However, depending on what Monday and the rest of the week will bring, this move higher may well turn out to be no more than a ‘goodbye kiss’ on line B to confirm a coming bear market.
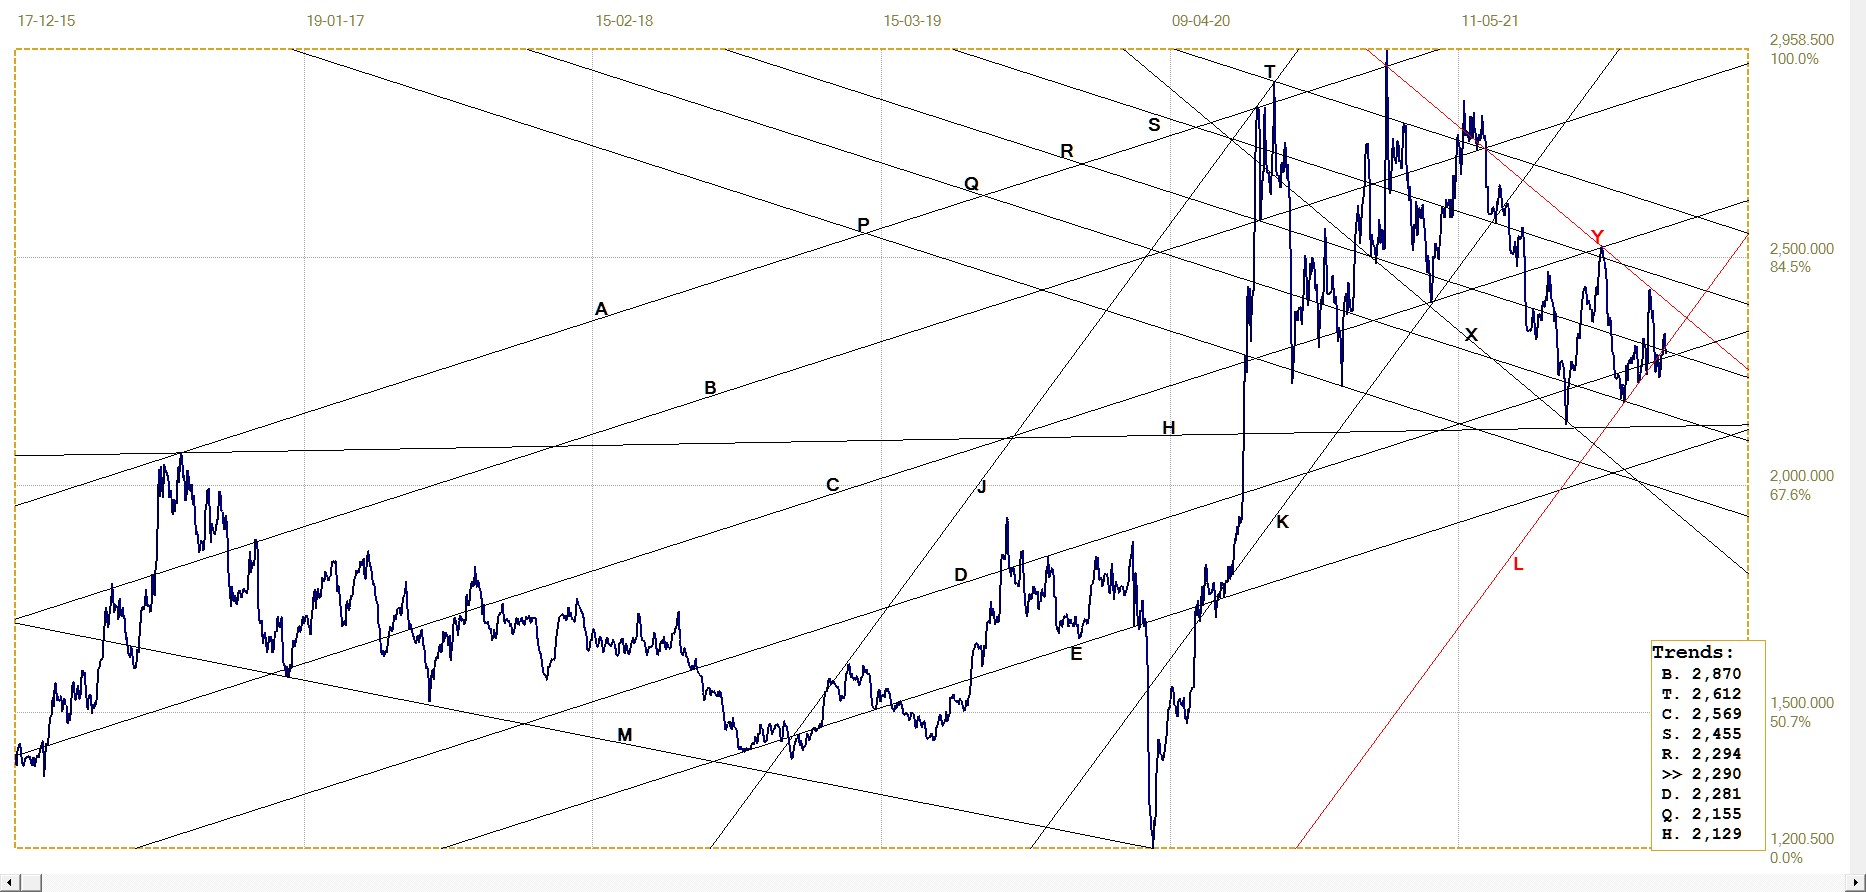
Confirmation of a bear market for the S&P500 will come with a break below bull channel JKL, currently with support at 4059, and rising. A target could be line D, passing through the pre-March 2020 high, which is now at 3477. A similar long term target for the DJIA – should a good sell-off take root – is line X, currently at 21 619. Line X on the chart of the Nasdaq, currently at 6431 implies that the technical market has more downside than Wall Street proper as represented by the DJIA and S&P500.
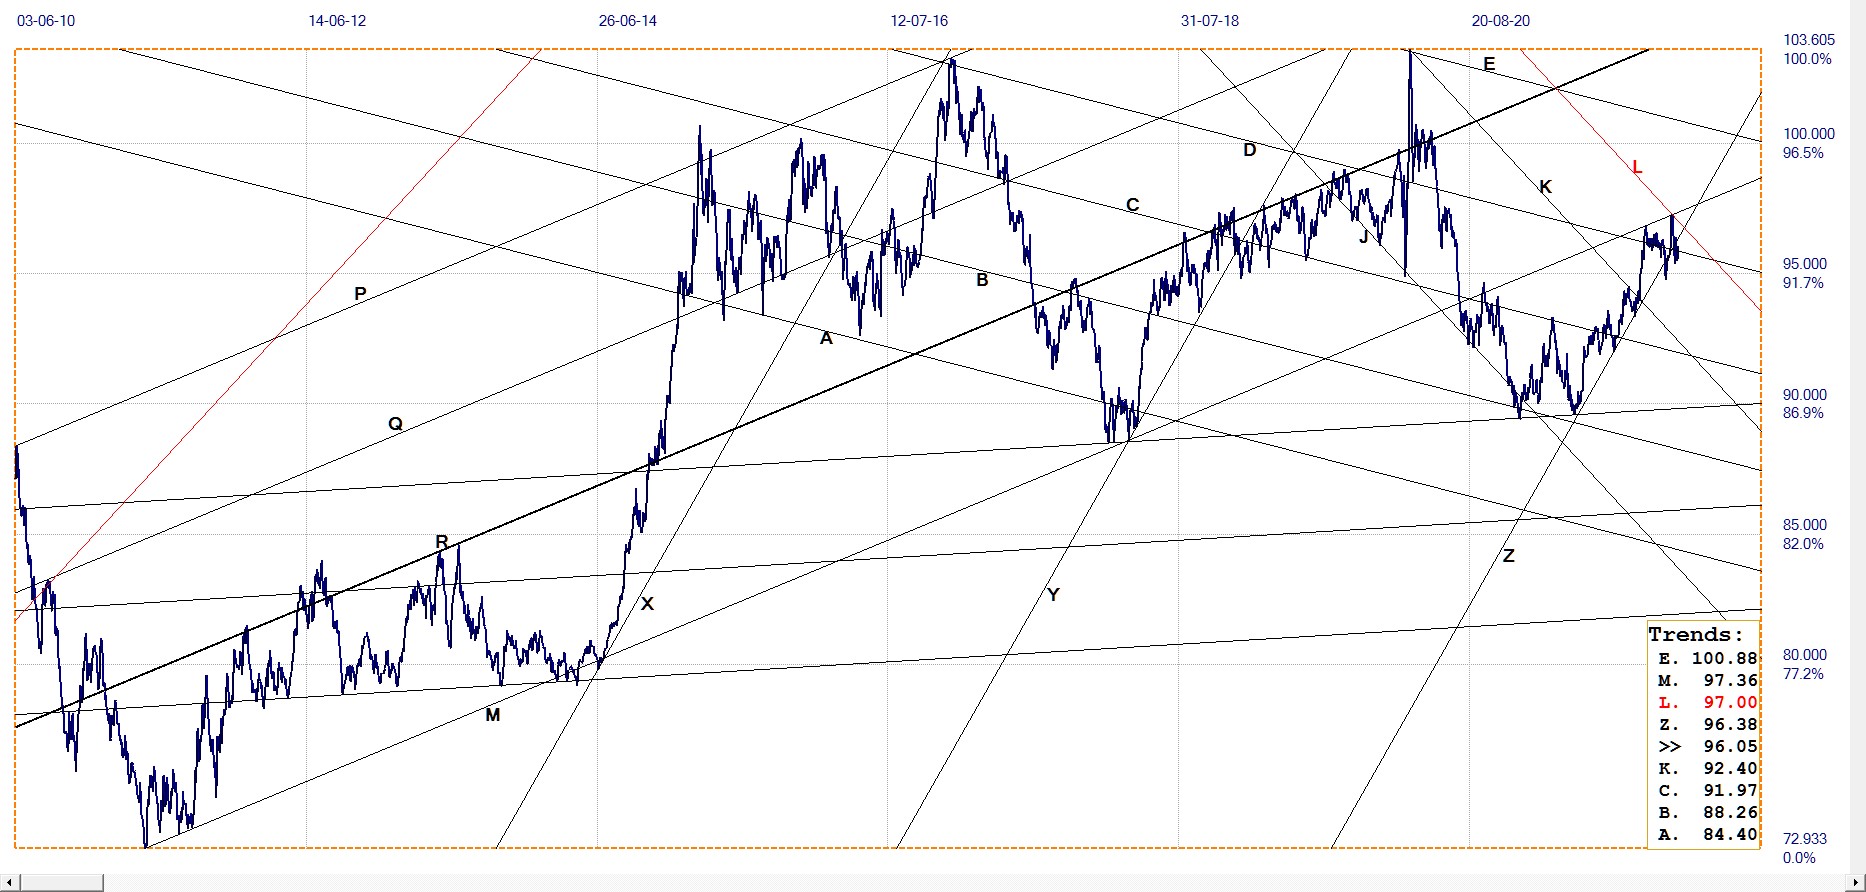
Dollar index. Last = 96.047
As mentioned not too long ago, the recent bounce in the value of the dollar smells as if it were used as a means to support the stock markets, which it had contributed to until late last week when selling took control of the direction. The dollar index has broken out of its bull channel XYZ and is trying to recover a bullish bias. Here too this week will be critical to decide on the direction for the near term.
Last week ended on a positive note for gold and silver. There is still time before the month end games begin and perhaps given the uncertainty on some other markets, the precious metals might regain their safe haven status.
Euro–dollar. Daily close
The euro bounced off the support of line E at the bottom of shallower bull channel AE to recover into the steeper bull channel, JKL. Then, later last week, Wall Street turned bearish again under the sustained selling that is going on and the dollar received a call to again come to the assistance of the stock market, among others.
The bullish break into channel JKL failed to hold and the euro ended the week resting on steep trend line G. The break above line G was bullish and still held on Friday in what possibly could become a goodbye kiss on line G – if the euro can muster a new rally, one able to make it back above line Q and also again into channel KL.
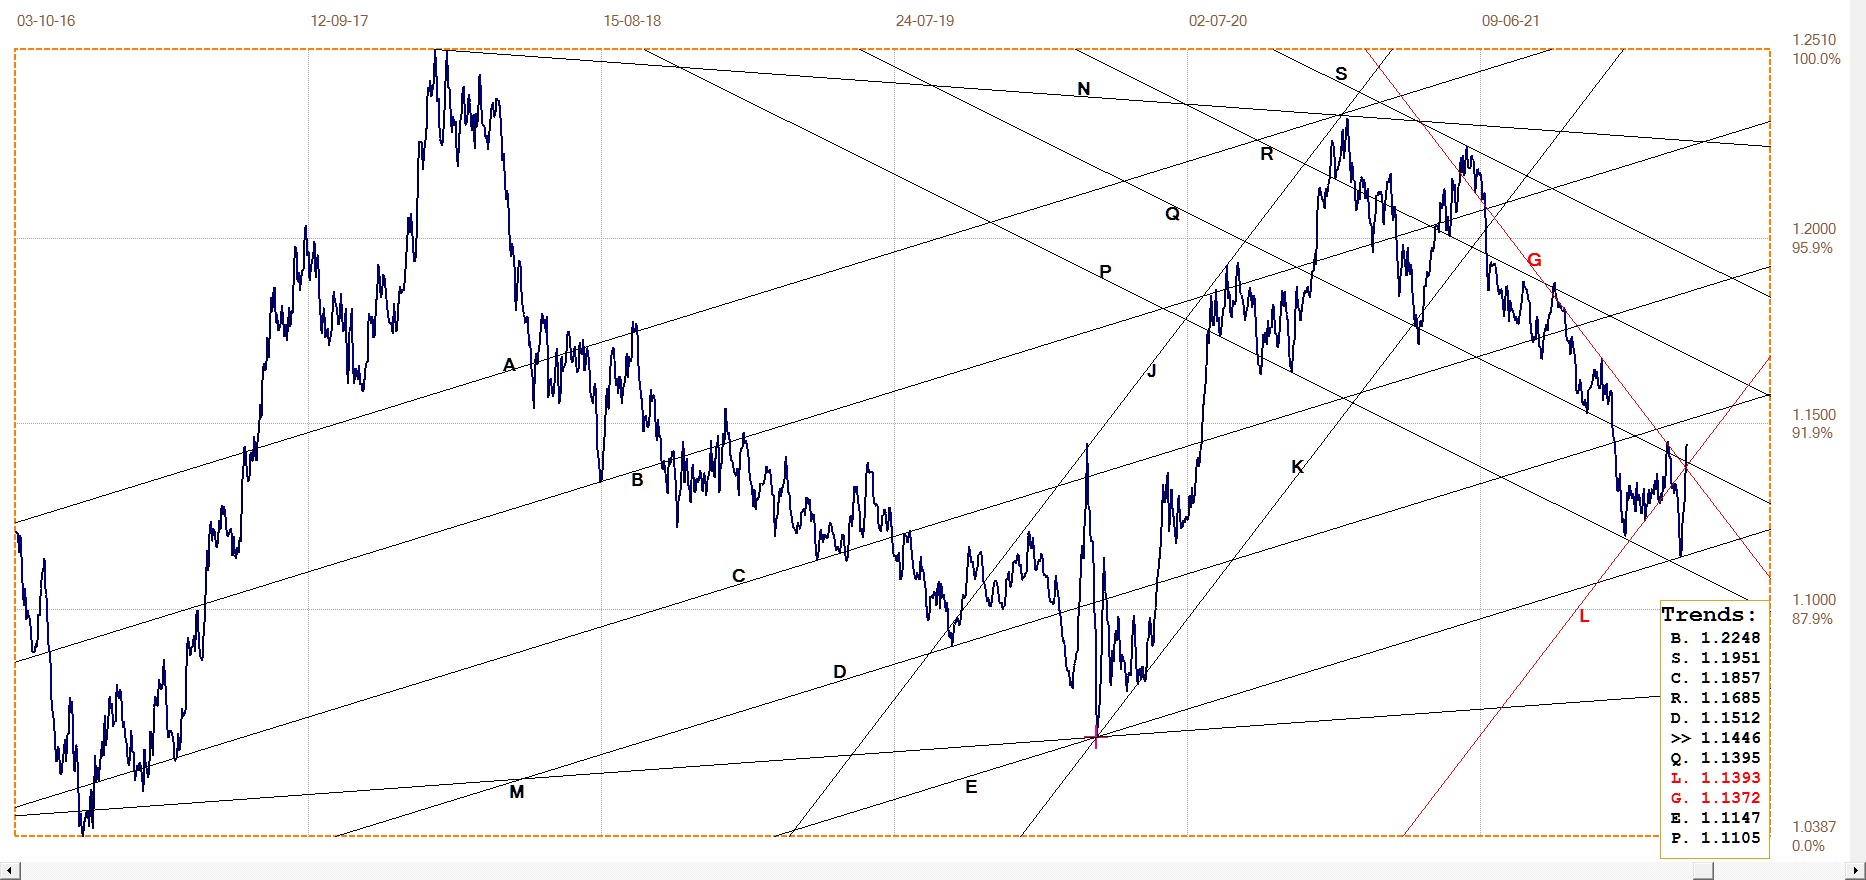
Euro–dollar, last = $1.1446 (www.investing.com)
DJIA daily close
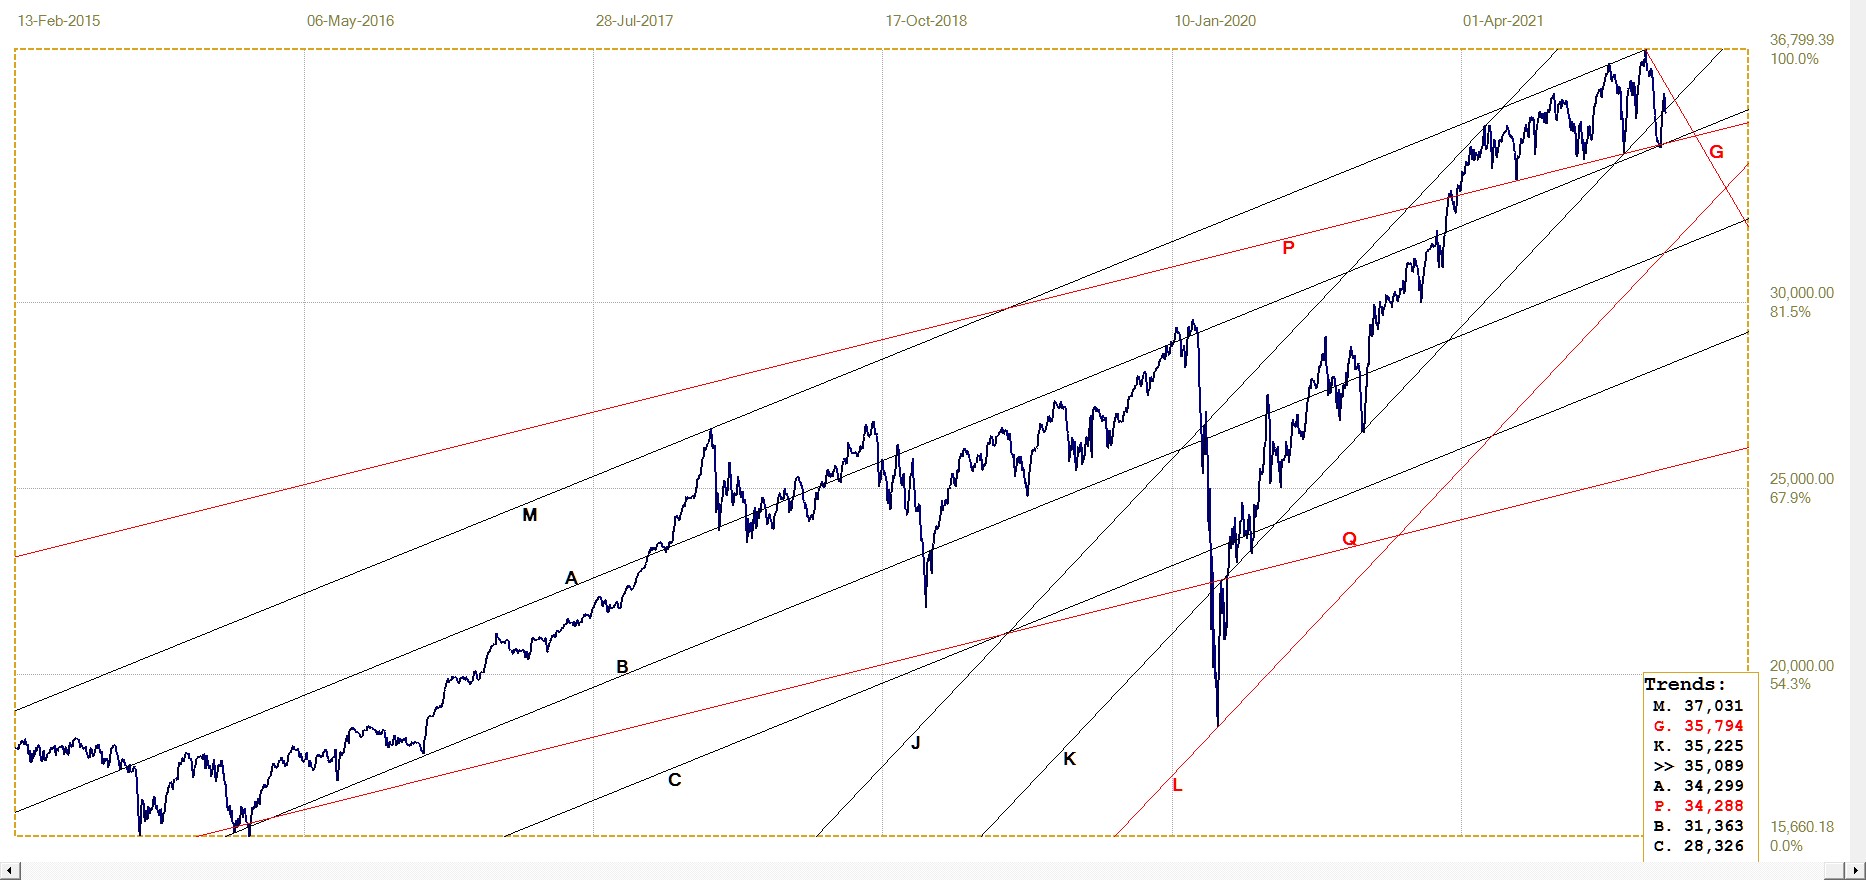
DJIA last = 35089.15 (money.cnn.com)
The DJIA was discussed earlier on a longer term chart, where it still looked quite bullish – but at risk. Here the outlook has already turned more bearish, with a break below line K and then a recovery into channel JK again after a rebound off the top of channel PQ. The index is still below inverted line G and has a bullish bias while continuing to do so and also holding above line K.
On a previous occasion not long ago when Wall Street was lower on the preceding Thursday and Friday, I anticipated a strong run on the Wall Street futures markets in Asia to set the day off on a positive note. This failed to happen. The futures were in a steady sideways range until the US trading day began, when out of the blue the DJIA rallied steeply for a few hundred points. The Bears which had positioned themselves for a weak open were caught short – literally! – and paid a heavy price. It clearly was a stratagem that was designed exactly for that purpose. It will be interesting to see in early trade if something similar is being planned for Monday.
Gold London PM fix – Dollars
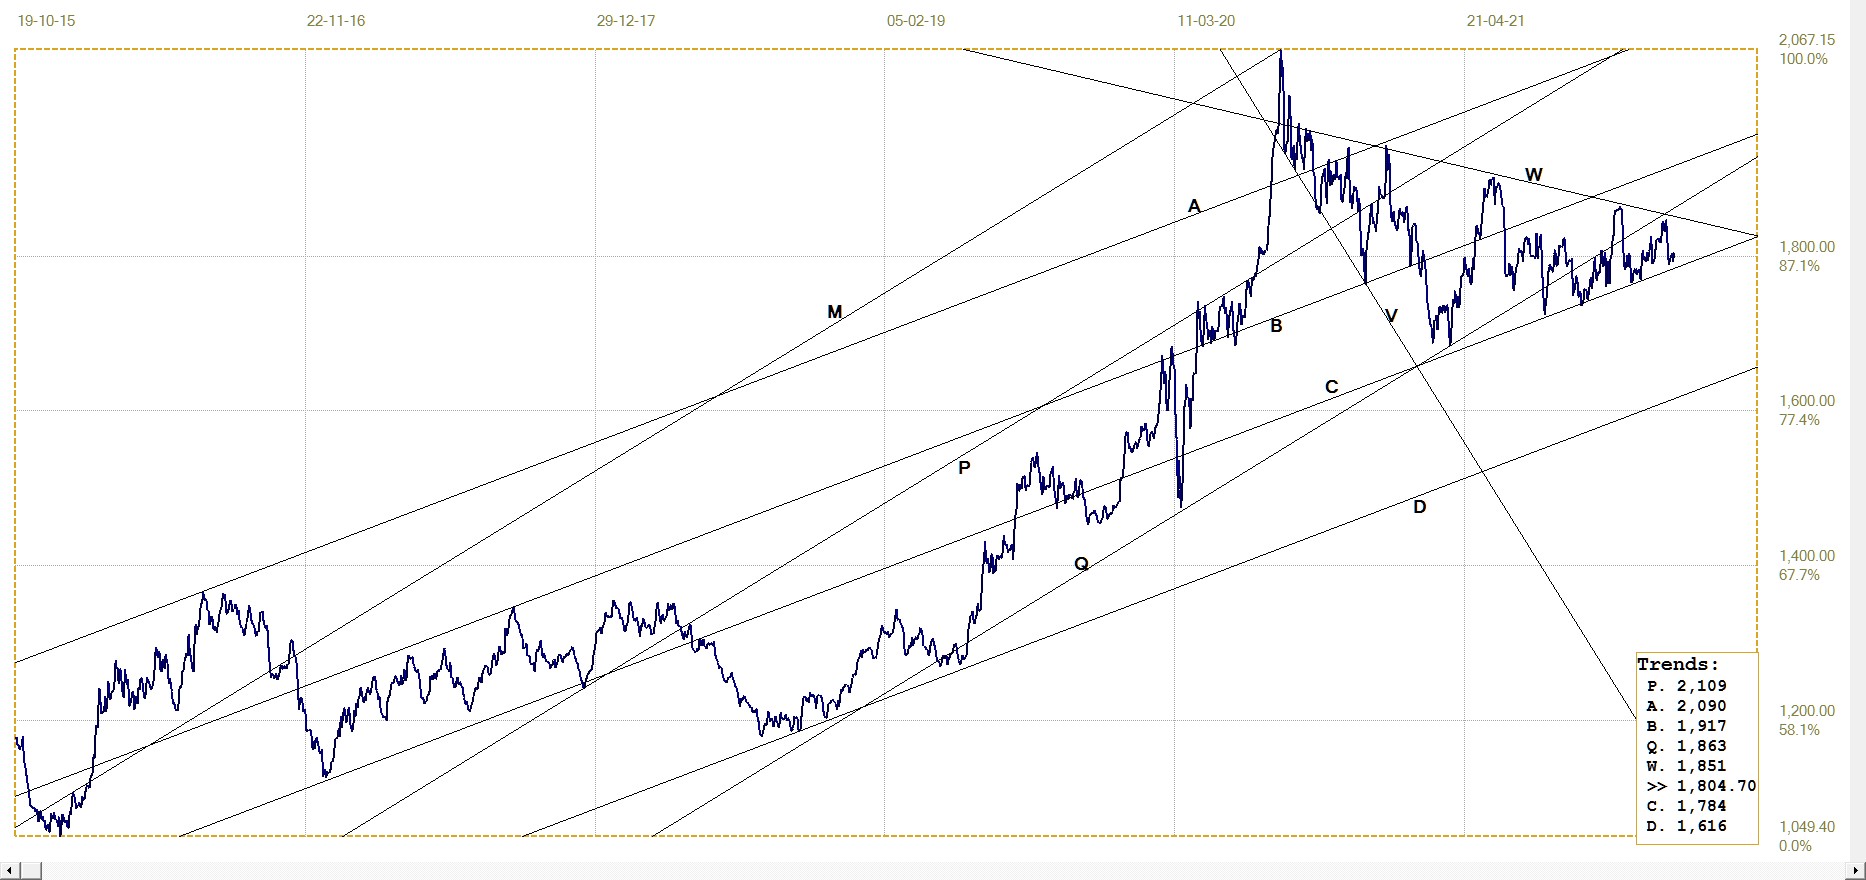
Gold price – London PM fix, last = $1804.70 (www.kitco.com)
Despite the uptick in the price of gold last week, the gold price remains trapped in a sideways move between lines W and C. One can speculate one way or the other about what might happen next, but until the price definitely breaks from its controlled range, it is mostly based on suppositions and not enough hard facts.
So let us wait and see what happens when the range narrows to where the natural up and down changes in the price can no longer be contained and a long awaited break higher – or lower? – happens. The longer term odds as well as most recent informed opinion favour a break higher, yet we all know how often in the past such hopes have been misplaced. Perhaps this time, when it comes?
Euro–gold PM fix
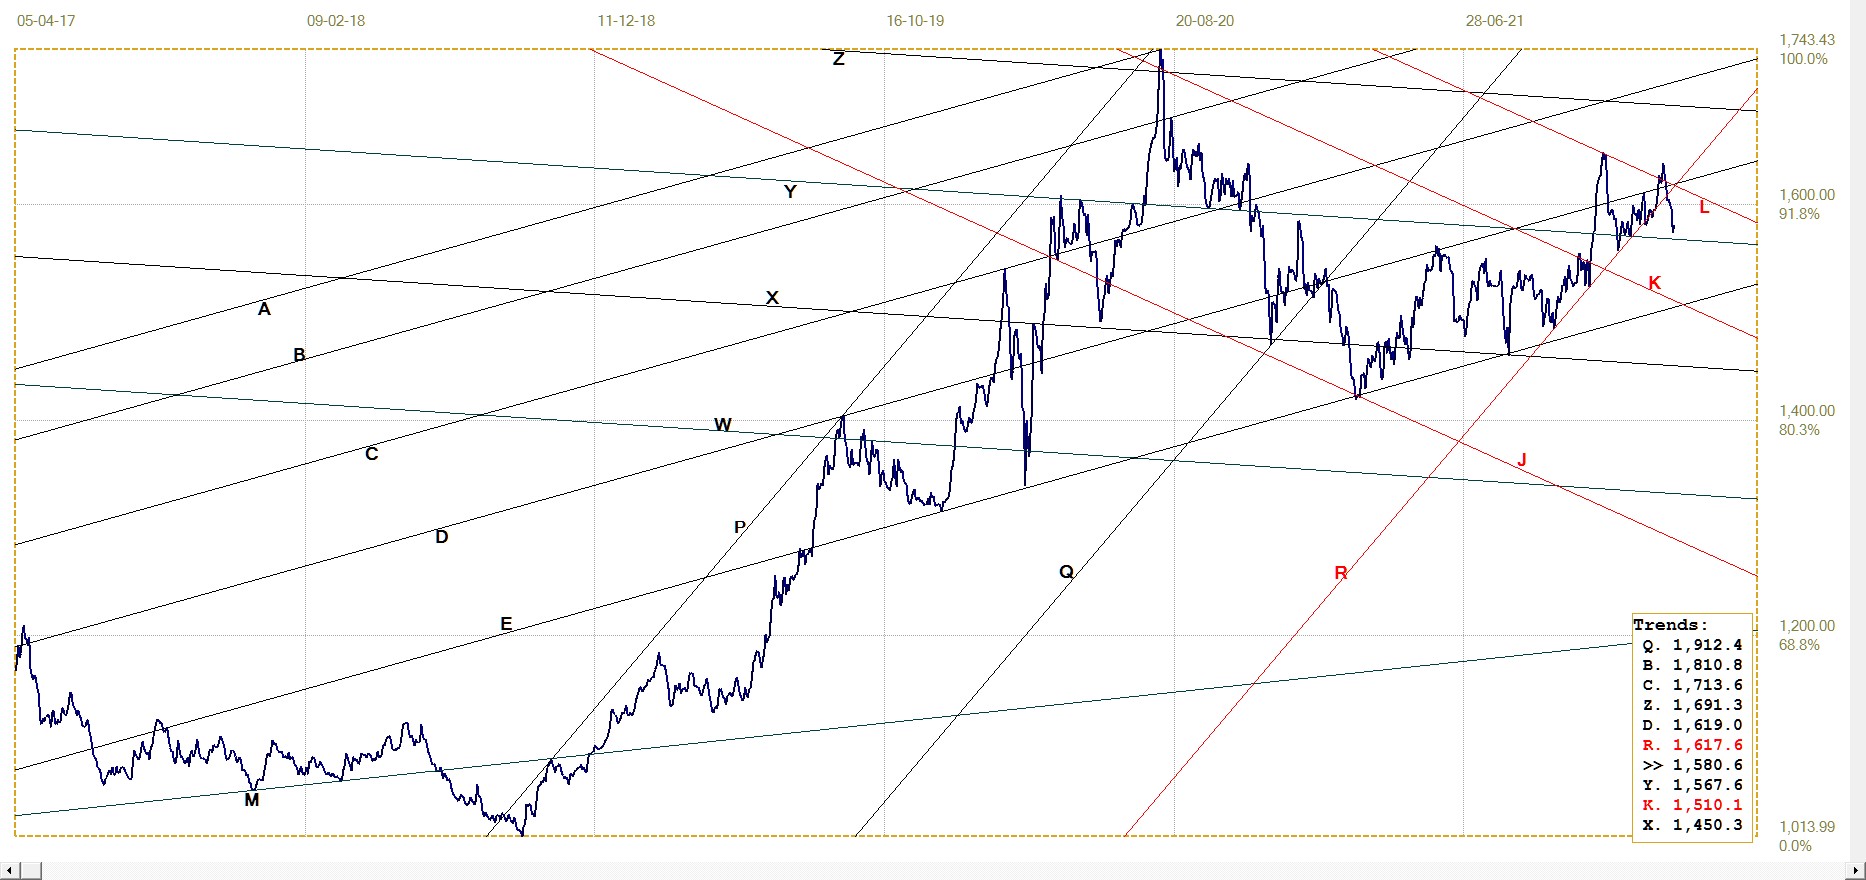
Euro gold price – PM fix in Euro. Last = €1580.56 (www.kitco.com)
Gold priced in euro has been dismal of late, after the break below the bull channel PQR which has held so well since late in September last year. A generally stronger dollar is supposed to favour a higher euro price of gold due to a combination of a better price for gold and a weaker euro, both of which boost the euro price of the metal.
This time around this combination has failed to work when the dollar started to firm again and kept the price of gold in check. The euro appeared to find its own strength could rally more than it had to concede to a stronger dollar. As a consequence, gold as priced in euro in effect suffered a double whammy. The break below its bull channel could usher in an extended sideways drift, while the euro holds mostly steady against the dollar so that the exchange rate and dollar price of gold balanced out each other’s changes as these were reflected in the euro price of gold .
Silver Daily London Fix
Silver daily London fix, last = $22.90 (www.kitco.com)
The price of silver has again lost the battle to hold in bull channel KL, however, this time – so far! – by a smaller margin than when it recently briefly broke below line D. The break lower has to remain minimal and correct back into the bull channel before too much time has passed. Silver is naturally kept weak by the price suppression and it does not need to have a negative technical slant to its prospects as well.
As for a number of the counters discussed this week, silver too is facing a quite critical few days.
U.S. 10–year Treasury Note
Holding within in rising channels – mostly bullish, as for the yield in this case, but also bearish for bond prices – appears the proper place to be in the charts this week. The yield on the US 10-year Treasury note is no exception, except that really none of the other markets have shown the acceleration visible here.
News of 7.5% YoY inflation for January had bond owners running for cover. Some calm returned to the market after Biden assured the market that the high inflation should not last any longer than the end of 2022. Whether that belief will outlive the second quarter we will have to wait and see. Perhaps not even the first quarter, if all the inherent troubles of the economy combined with the mounting risk of international conflict do not ease off, yet instead erupt into actual large scale fighting with a wide range of potential consequences.
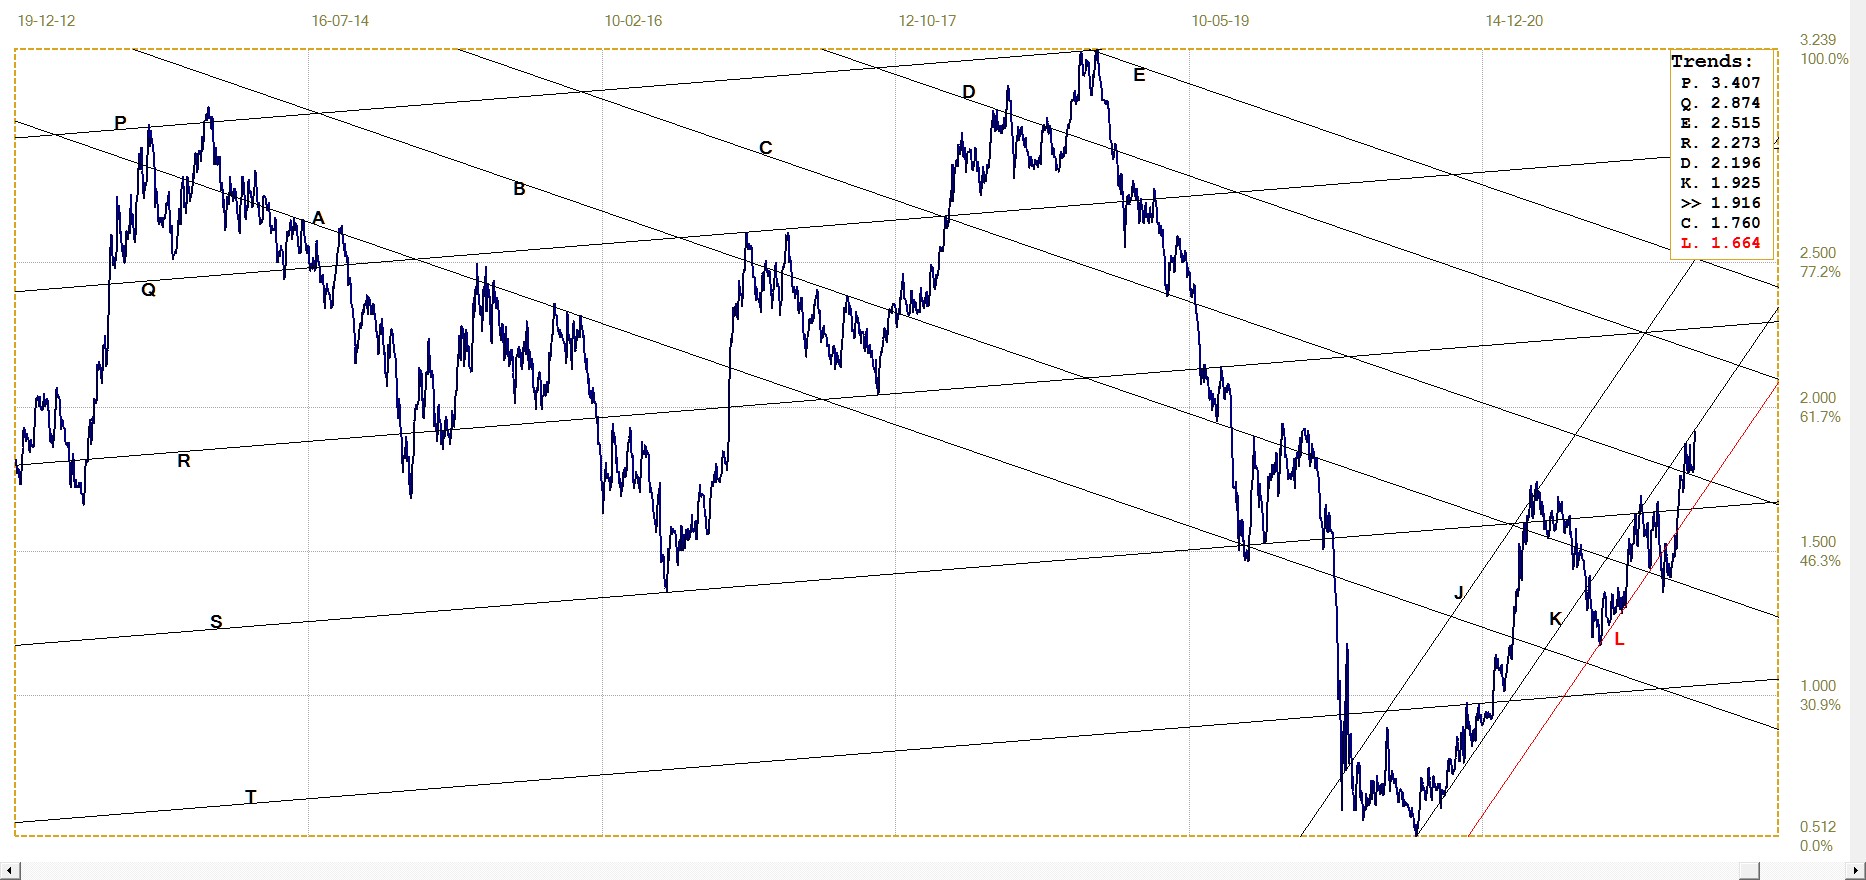
10–year Treasury note, last = 1.916% (Investing.com )
West Texas Intermediate crude. Daily close
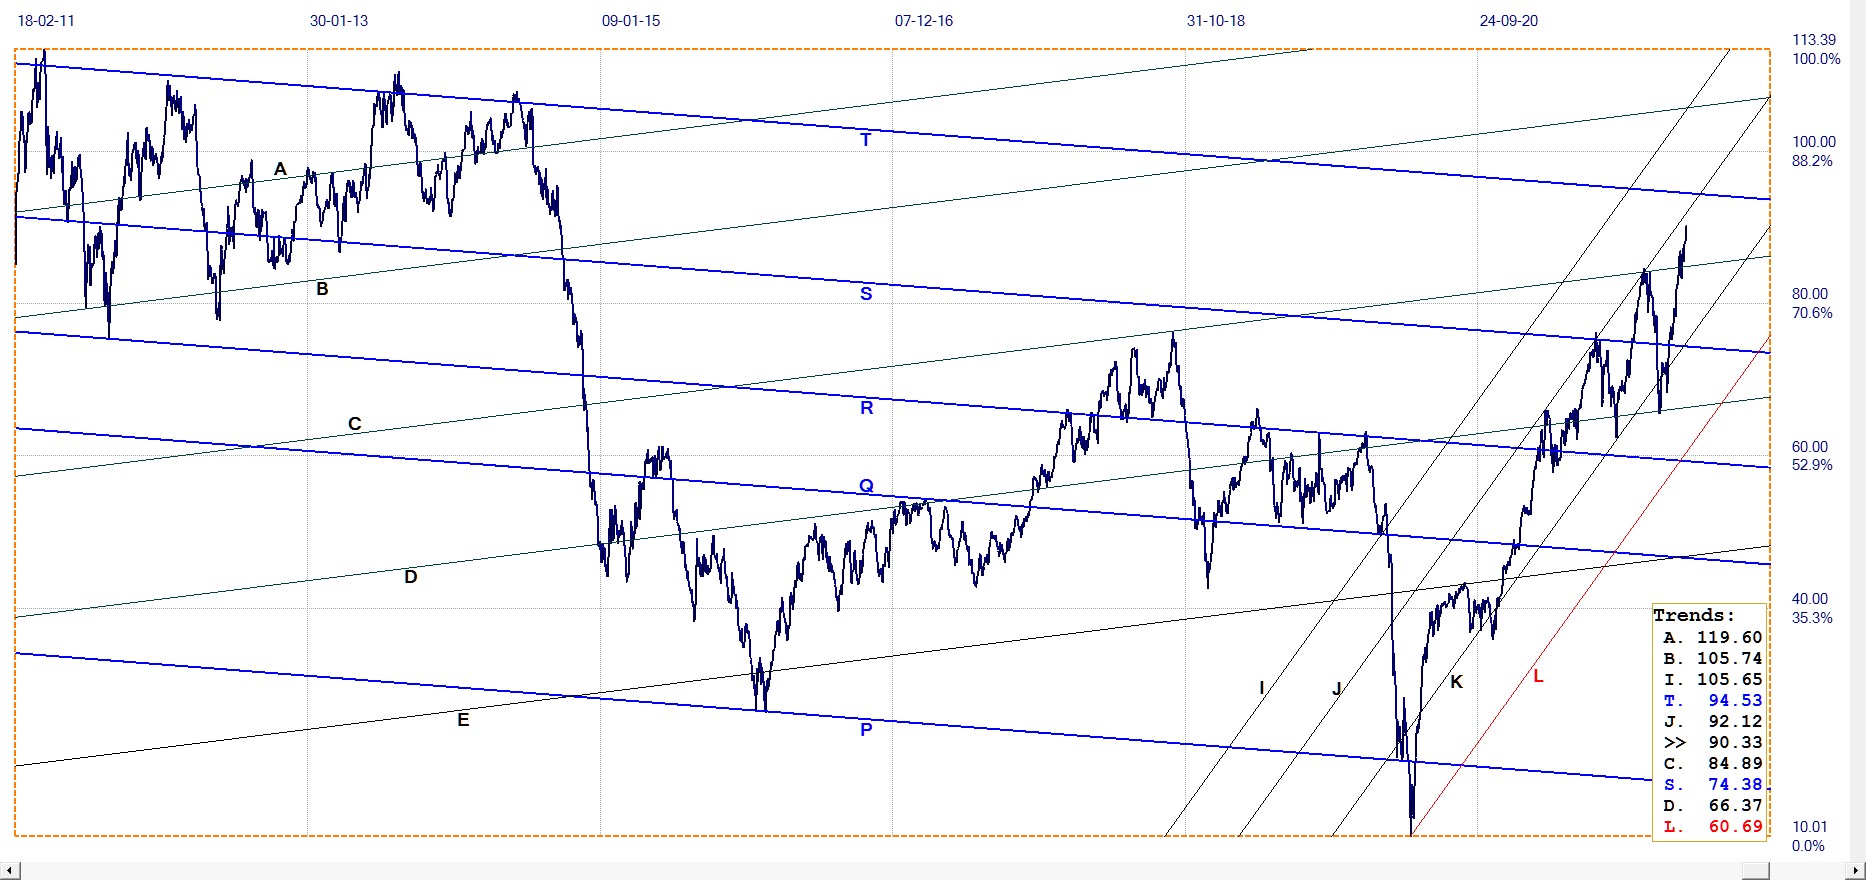
WTI crude – Daily close, last = $90.33 (www.investing.com)
It so happens that the yield on the US 10-year Treasry is not the only price to have spiked higher last week. Also driven by the higher CPI, the price of energy – one of the major causes of the higher CPI – joined the fun. The final break above channel CD had by Friday almost made it into the steeper band of channel IJKL. This week is almost due to make it a case of ‘too much, too soon’ and it would not surprise to see the price of crude reversing a little during the coming week.
While that might be like pouring out oil to calm the waters, further increases in the price of oil certainly will have the opposite effect.
©2022 daan joubert.
*******
More from Gold-Eagle


