Month Of May And 1987…And All That


The month of May still has a few days to go before, as is generally assumed, action will return to the markets when the calendar turns to June. It is not known whether the widely held view that the month of May is a time of lackadaisical markets can be justified by statistics or whether it is just a perception that has taken root like the age old belief that crops should be planted according to the waxing or waning phase of the moon. Yet considering such repeating behaviour, one should always be aware of Mark Twain’s warning that history may not repeat, but it does rhyme.
Another similarity of recent market behaviour with the past applies to October 1987 and what has happened recently. In 1987 the DJIA peaked at 2722.42 on August 25 before falling steeply to 2492.82 by September 21, down by 8.5%. The recovery off the low achieved an intermediate high at 2640.99 on October 2, representing a gain of almost 6%. During the next 10 trading days, the DJIA showed a gain on two days, but gained little. The other 8 days were all bearish to a lesser or greater degree. Then on Monday, October 19th, the DJIA collapsed by 22.4%.
The recent and very long bull market peaked at 26 626.71 on 26 January this year. It then fell by almost 9% to 23 860.40 on February 3, recovered to 25709.27 on 26 February, only to resume the bear trend to reach a low at 23 533.20 on 23rd March (11.6% off the high) with another rebound. Yet another steep decline was followed by a recovery to close last Monday above 25 000 for the first time since the end of February. Following an earlier dip below 24 000, that break above the psychological target of three weeks of sustained rallies to raise confidence could not last one day.
Last Friday, the DJIA closed at 24 753.09, less than 2% down since Monday’s high, but it was not a good week for Wall Street and any bad news on Monday morning after a weekend of stress about the stock market could trigger a new sell-off. There will be however no repeat of 1987’s major sell-off. Measures to prevent a repeat of the 1987 event were instituted not long afterwards with the establishment of the committee known by its acronym of PPT as the ‘Plunge Prevention Team’.
For quite some time now, intra-day market behaviour on Wall Street has hinted at intervention by the PPT, or someone with similar objectives, whenever a severe sell-off threatened or it looked as if the close would be too low for many investors’ comfort. Sudden V-shaped bottoms on a jump in the immediate volume happen too fast for general market reaction. Of course, high frequency trading plays a part in a sudden change in trend, but using that as an excuse might be only welcome cover for a major force entering the market to halt a slide before it becomes a rout.
Nevertheless, unless there happens a major and lasting change in fundamentals – which in the turbulent times we experience today cannot be excluded – the odds favour a broadly sideways at best to longer term bearish market. It is likely that the reason given for this will be either much too high debt at all levels of the economy or increased interest rates as the Fed tries to normalise matters before the situation with respect to fundamentals deteriorated much further.
Last week the crude oil price pulled back below $70/bbl to end the steep increase in its price since mid February. Gold recovered above $1300 – doing so again, but for how long? – with silver also higher, back above $16.50. That too may not last long before it is lobbed back below that level. Yields on the US 10-year pulled back quite sharply, from above 3.1% down close to 2.9%; this time, strangely, while the dollar also strengthened. Most of the time the yield and dollar trend in opposite directions to maintain stability for the Treasuries from the perspective of foreign investors.
This week we enter the month of June and we stand to find out whether Wall Street is to try and rhyme with 1987 even though it is not yet October. At least one can wish readers to enjoy the summer even if the markets continue to laze around as if they too have nothing better to do.
Euro-Dollar
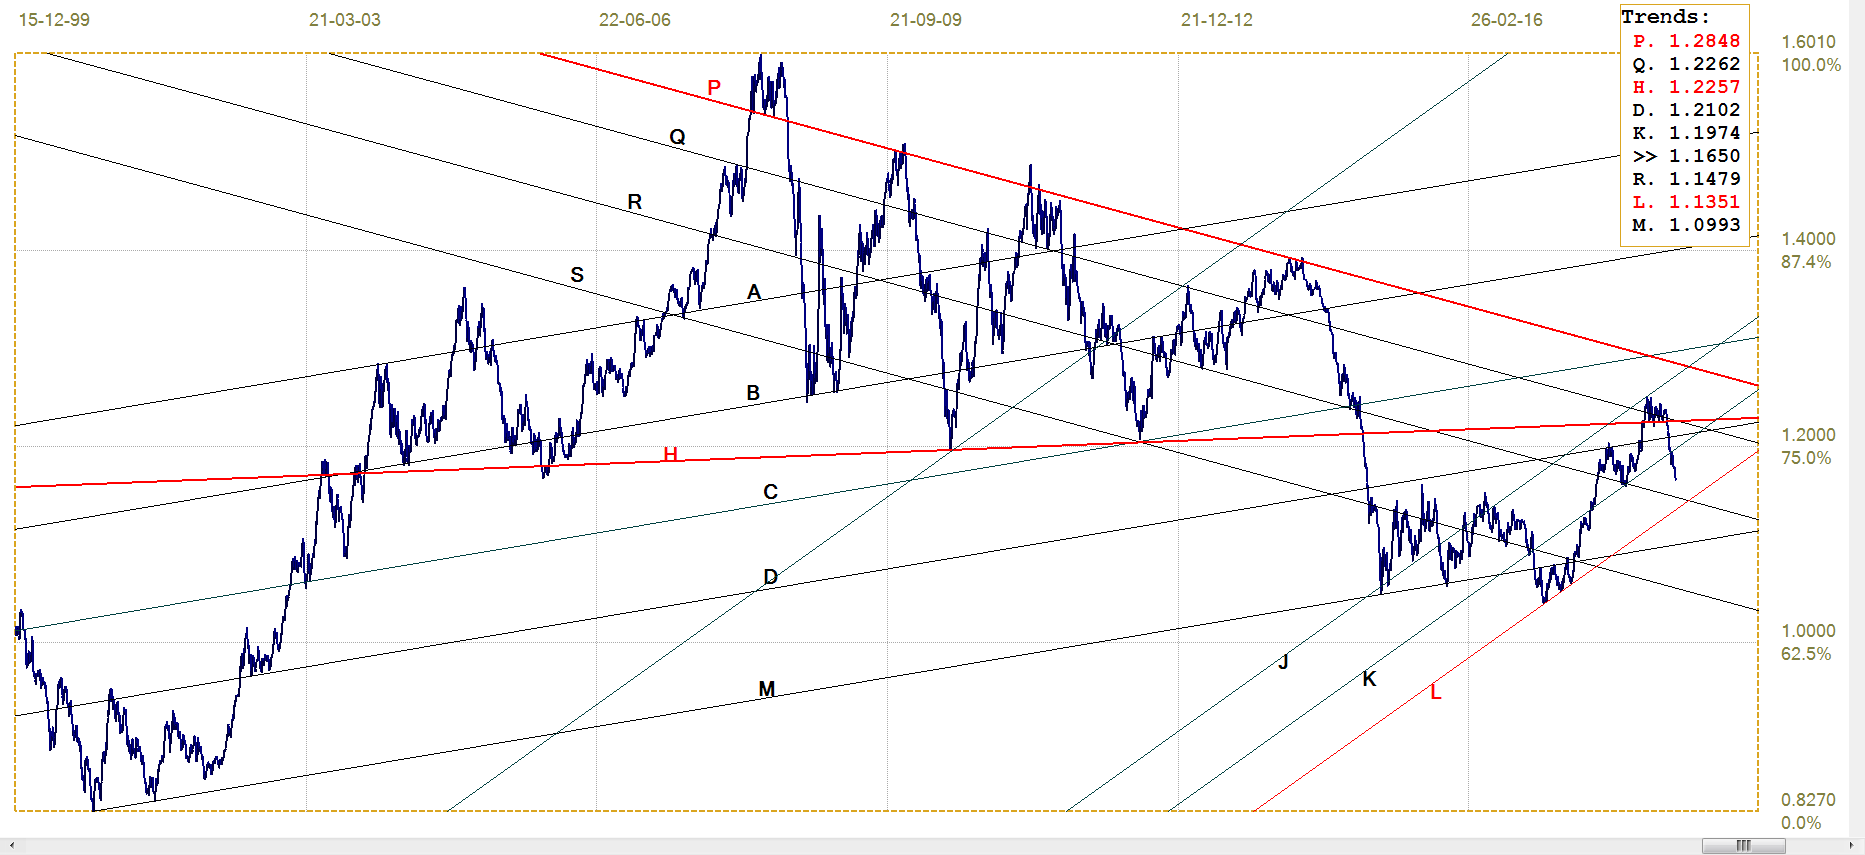
Euro-dollar, last = $1.1650 (www.investing.com)
After holding sideways in a very tight range above line H ($1.1650) for a number of weeks, the break below that support had the euro emulate the flight of a stone as it first fell to rest on the bottom of bull channel JK ($1.1974), but then immediately broke lower to continue the almost vertical fall. It is now midway through channel KL ($1.1351) with some support at line R ($1.1479). Europe is now clearly suffering from internal strain…and so far the euro’s bear trend seems set to continue.
DJIA
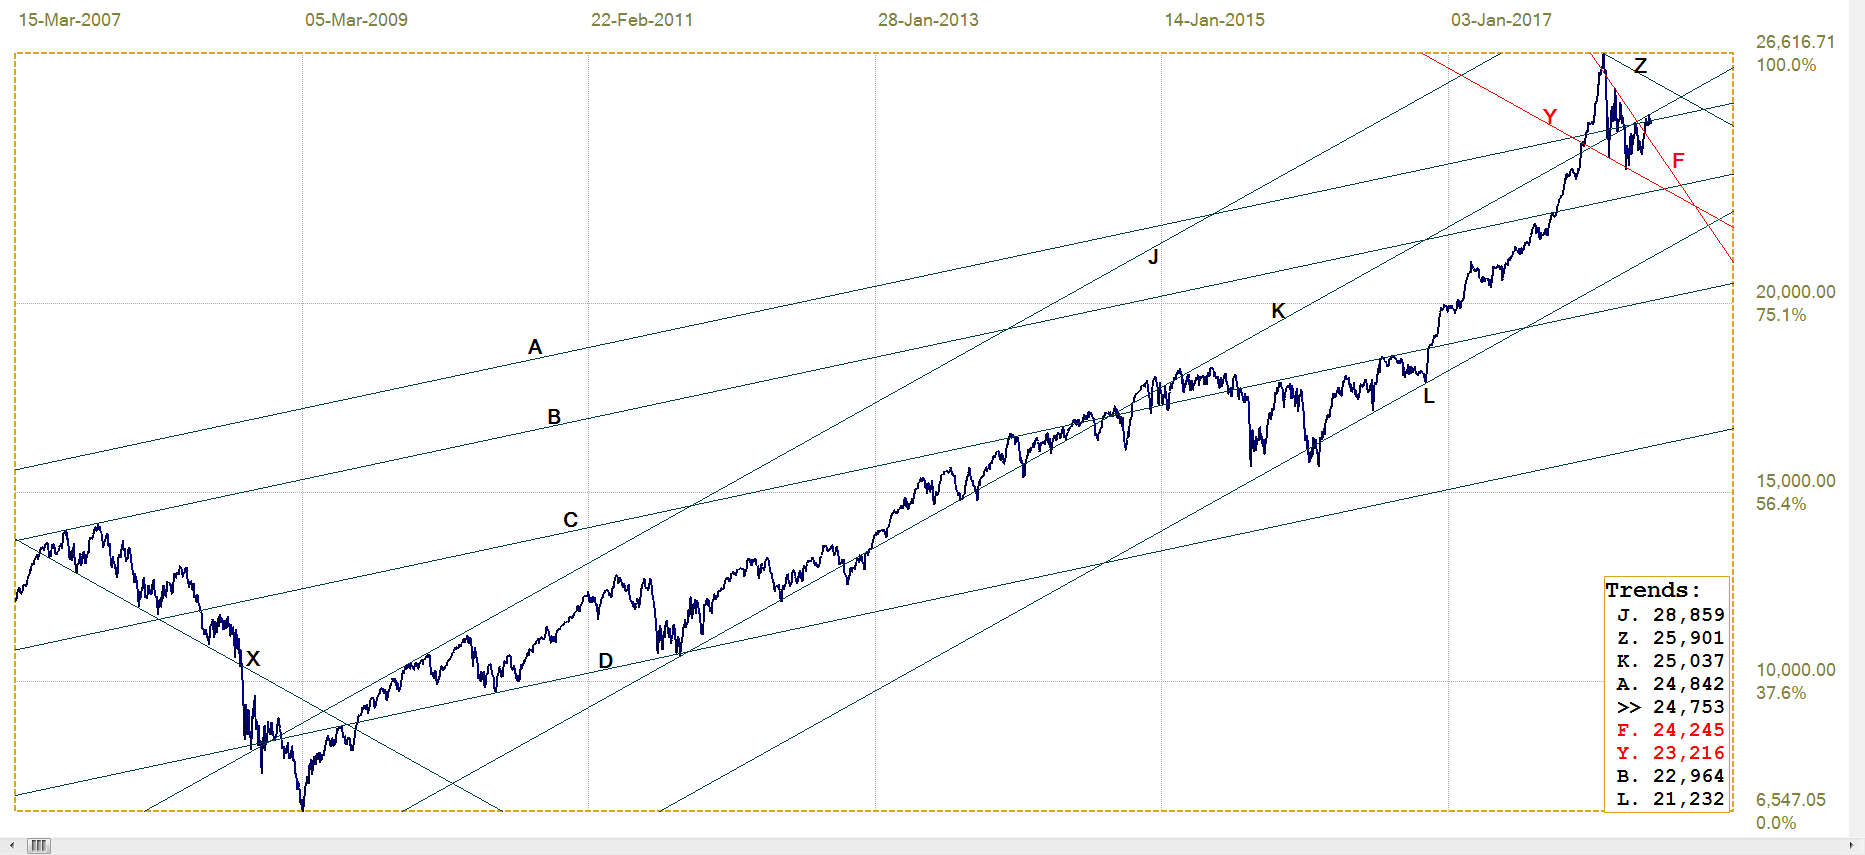
DJIA, Last = 24753.09 (money.cnn.com)
The two conflicting technical signals in the analysis – the DJIA having broken clear of pennant YF (24 240) at the end of its fifth leg within the pennant – which is a bullish sign as pennants are known as continuation patterns, while line K (25 037) is still intact as resistance, are not yet resolved. The DJIA has pulled back below the support of line A (24 842) which adds a bearish bias to the outlook for Wall Street, but this is not yet conclusive evidence the Big Bad bear is knocking at the door.
The discussion in the introduction explores the possibility that a situation has arisen which is rather similar to what existed in 1987 before the Big Panic. Similarity in how the market has behaved again for a few weeks after a major high does not imply that the outcome will be the same. Particularly given there are all manner of devices to prevent a repeat of anything remotely like 1987. One can almost make a near certain bet that if the fed with its deep pockets can halt a sell-off, the markets will be closed until a form of sanity among investors can be induced by whatever means are needed to do so.
Even sustained slide will not be allowed to continue too long without being broken by a day of recovery, even if of very limited extent. It is really bad news when the media report 4 or 5 consecutive days when Wall Street closed in the red and that is to be prevented almost at all costs. Four or five days with green numbers for the close is of course very good. It keeps investors smiling.
Gold PM Fix - Dollars
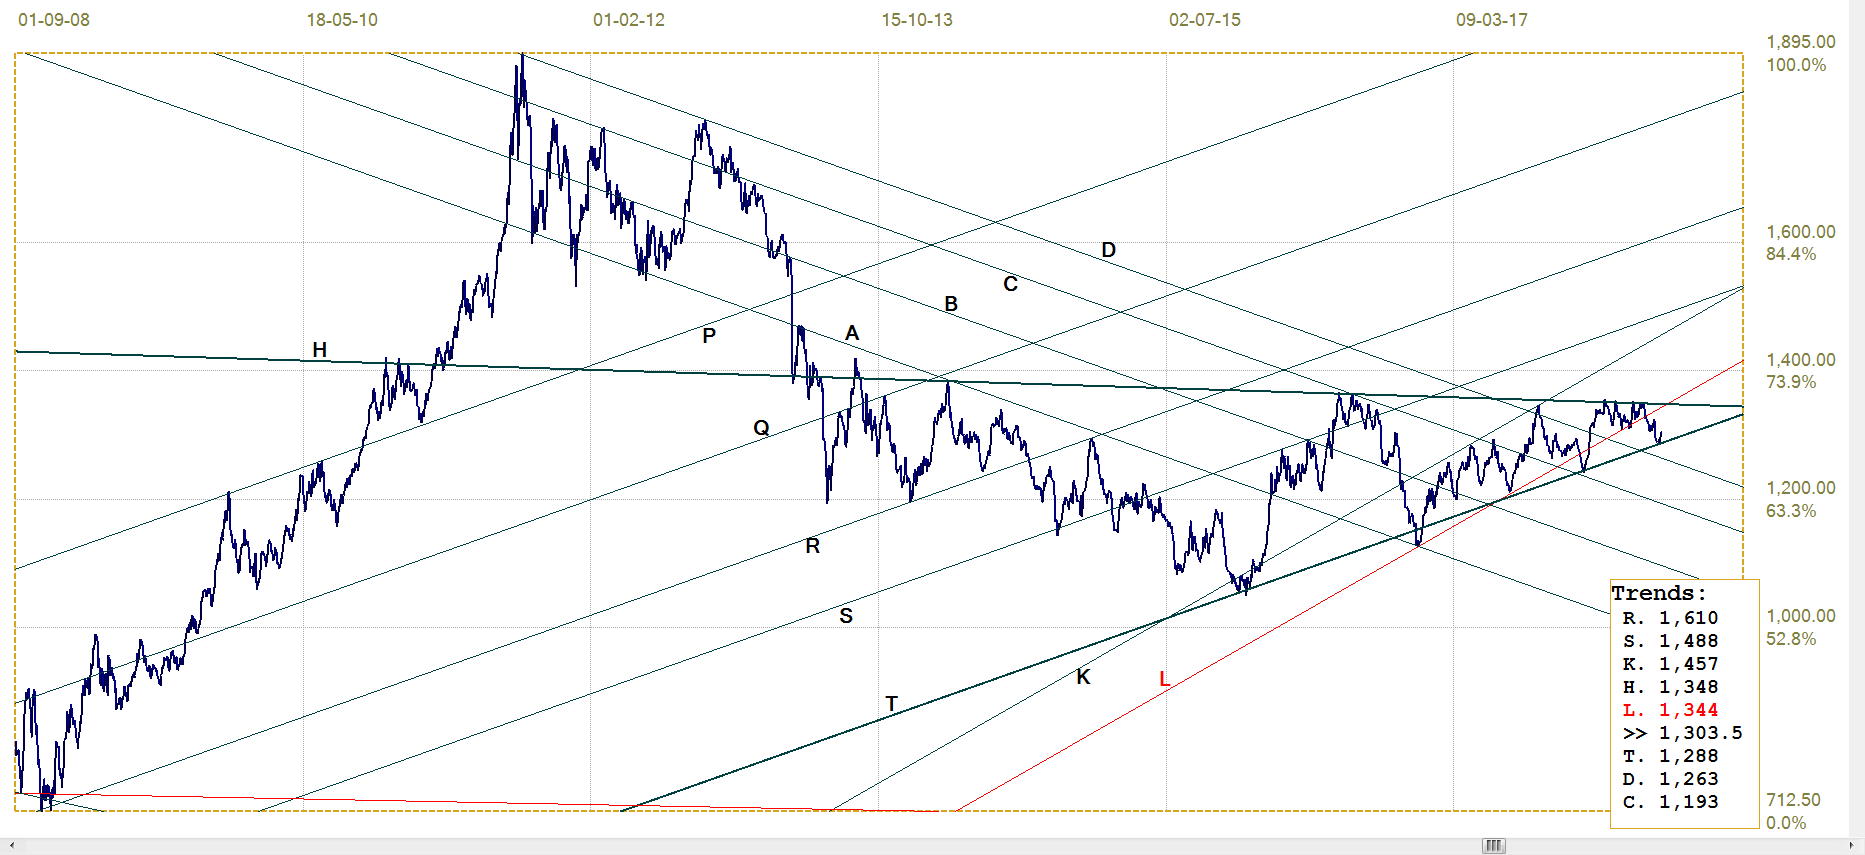
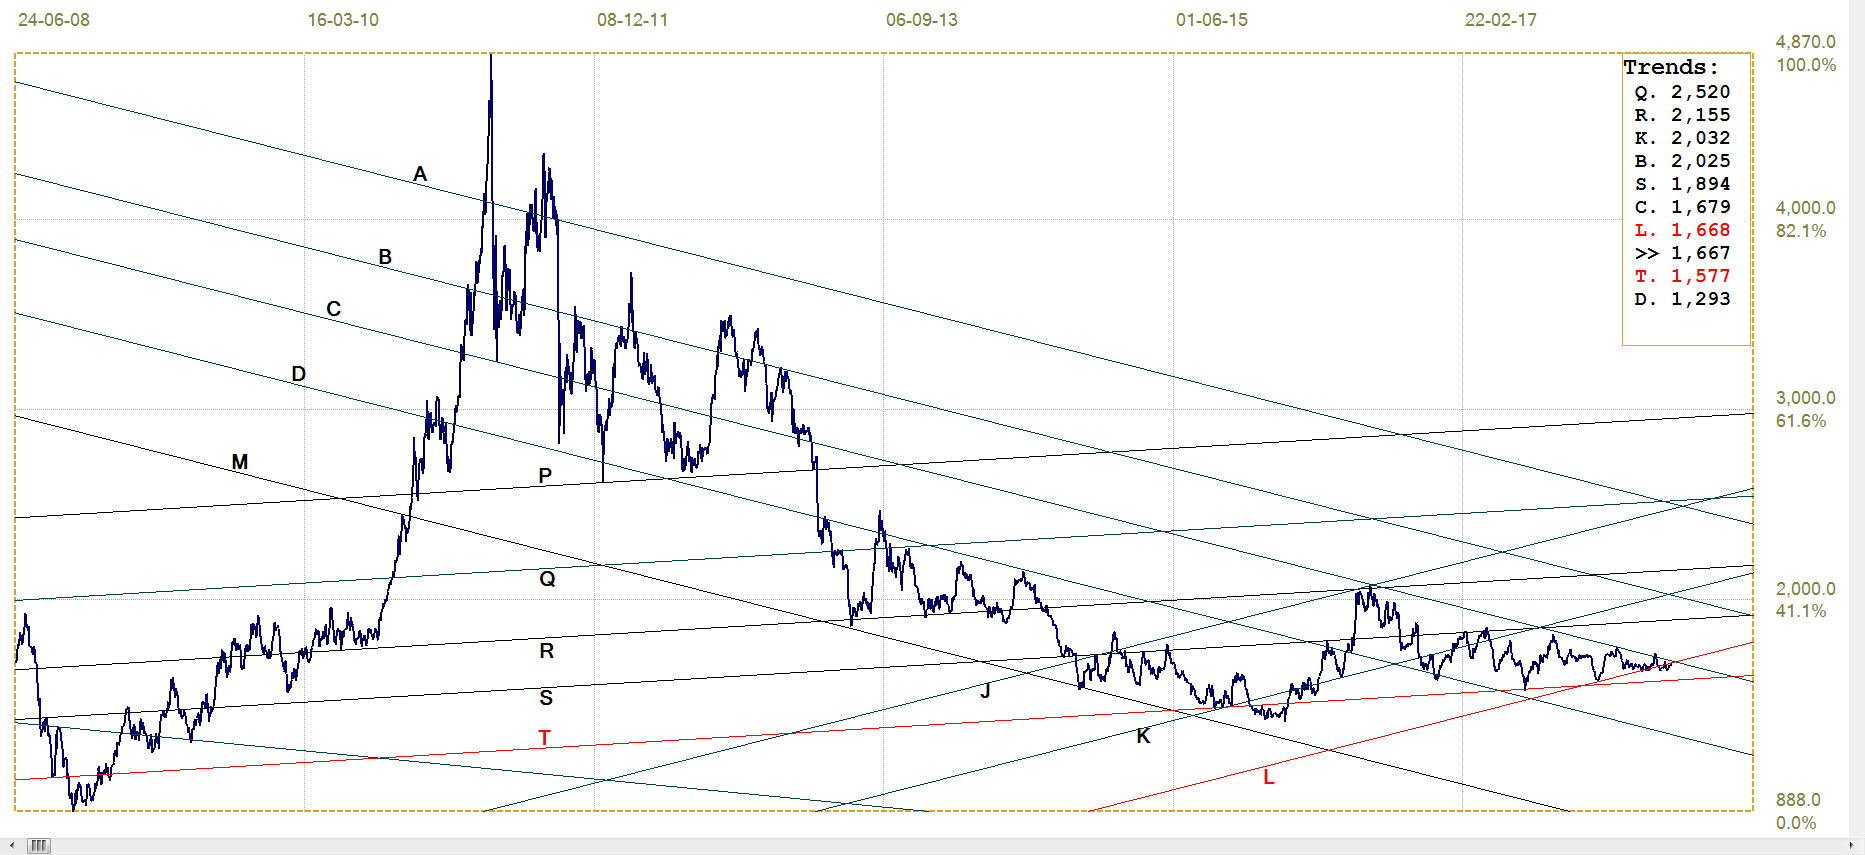
Gold Price – London PM fix, last = $1303.50 (www.kitco.com )
The break below bull channel KL ($1344) reached support along line T ($1288) and then held to effect a small rebound higher. Gold even managed to break above the psychological support of $1300, but it has not yet shown it can hold that level, let alone use the break higher as a launching pad to resume the bull trend.
The price still has a long way to go before there can be a break above flat topped triangle HT ($1348) to signal that the bull trend finally has resumed. At least for the moment – and with no certainty whether it can last – the support at line T, as has happened previously, has to hold to keep the bullish bias alive.
Euro-gold PM fix
The weaker dollar and a steady to weaker price of gold had the euro price of gold on a slide down line C (€1061) until it had hit the bottom of steep bull channel KL (€1113). Then a stronger dollar had both the price of gold and the euro under some pressure, but with sufficient difference to have the euro price of gold creep higher along line L. As mentioned earlier, Europe seem to be trapped in problems of its own. Consequently, this has now helped firstly to have the euro price break back into channel KL after having dipped marginally lower.
The break above channel YZ (€1099) after a previous challenge on line Z had failed to hold, is perhaps of greater significance than the recovery into channel KL.
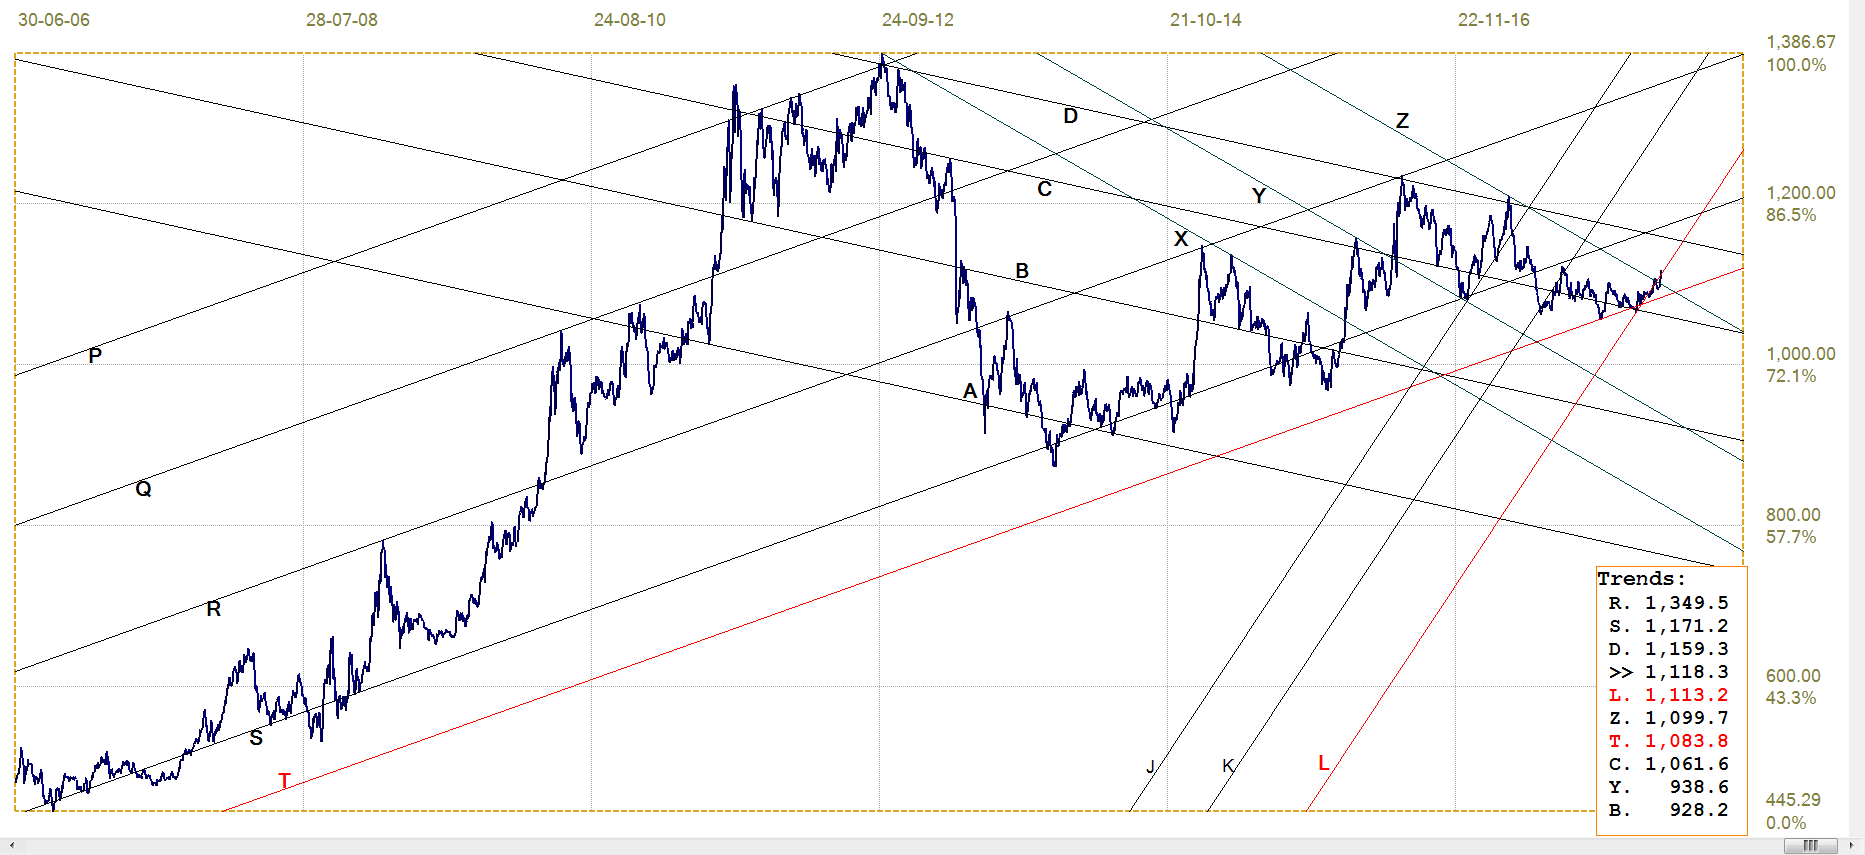
Euro Gold Price – PM Fix In Euro, Last = €1118.3 (www.kitco.com)
Silver Daily London Fix
Silver Daily London Fix, Last = $16.67 (www.kitco.com)
Whenever the price of silver shows a sign of life, it gets beaten down again. That was the opening line of the comments last week and has held true for quite a long time. This is particularly true of the ‘tennis game’ that has been going on for some time at the ‘$16.50) net’. Whenever the price popped higher, it was ‘lobbed back’ to below that level.
Last week, after starting on the wrong side of the net on Monday, the price of silver managed to cross the net and not only remained there for the rest of the week – in terms of the London silver fix – but trended slowly higher to end the week at the highest fix for the past two weeks. It will be interesting to see what happens this week – extending the trend to break higher at line C ($16.79) for the first time in years would be most welcome. But then only if the break manages to hold.
US 10-Year Treasury Note
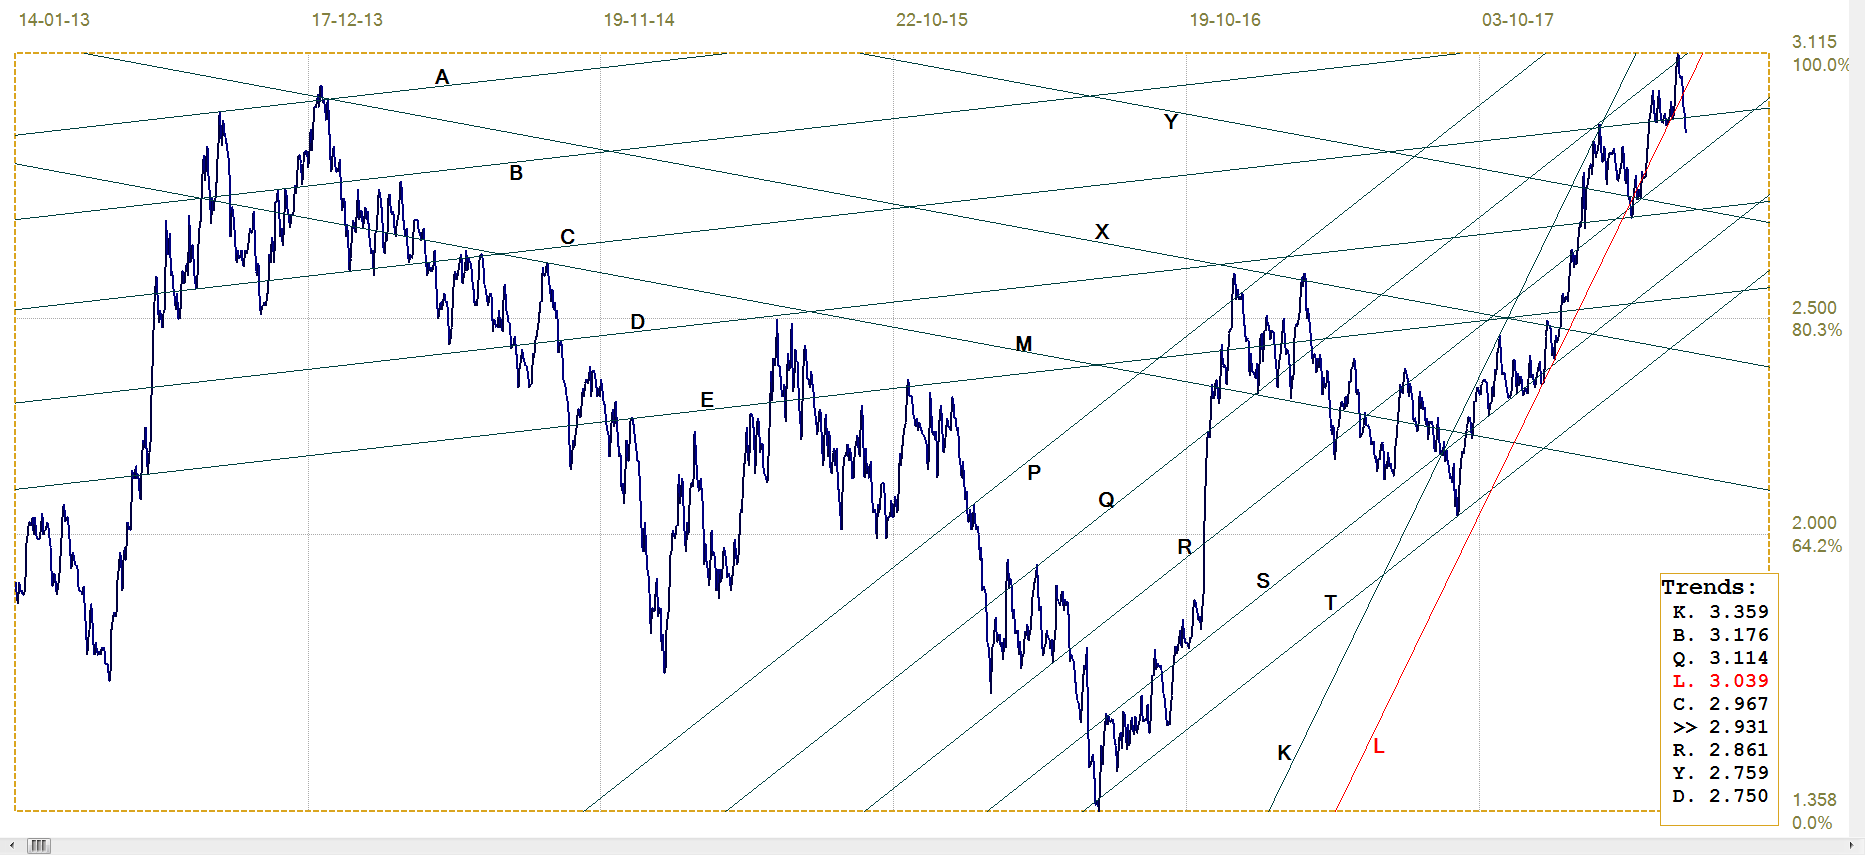
US 10-Year Treasury Note, Last = 2.931% (www.investing.com )
The break above the 3% level now seems a fact of life. That, too, was the opening sentence of last week’s comments, which turned out to be very wrong. Despite a near consensus that June’s FOMC meeting would see another 25 bp jump in rates, the bond market last week rallied to get away from the yield for the 10-year above the scary 3.1% level and to add a safety margin by dipping below 3%.
The rally extended lower to below line C (2.967%) which has recently acted as both strong support and resistance. Whether that indicates staunch belief in the market that the Fed will refrain from increasing rates in June or whether national security somehow depends on the yield being held below 3% can only be guessed at.
West Texas Intermediate Crude. Daily Close
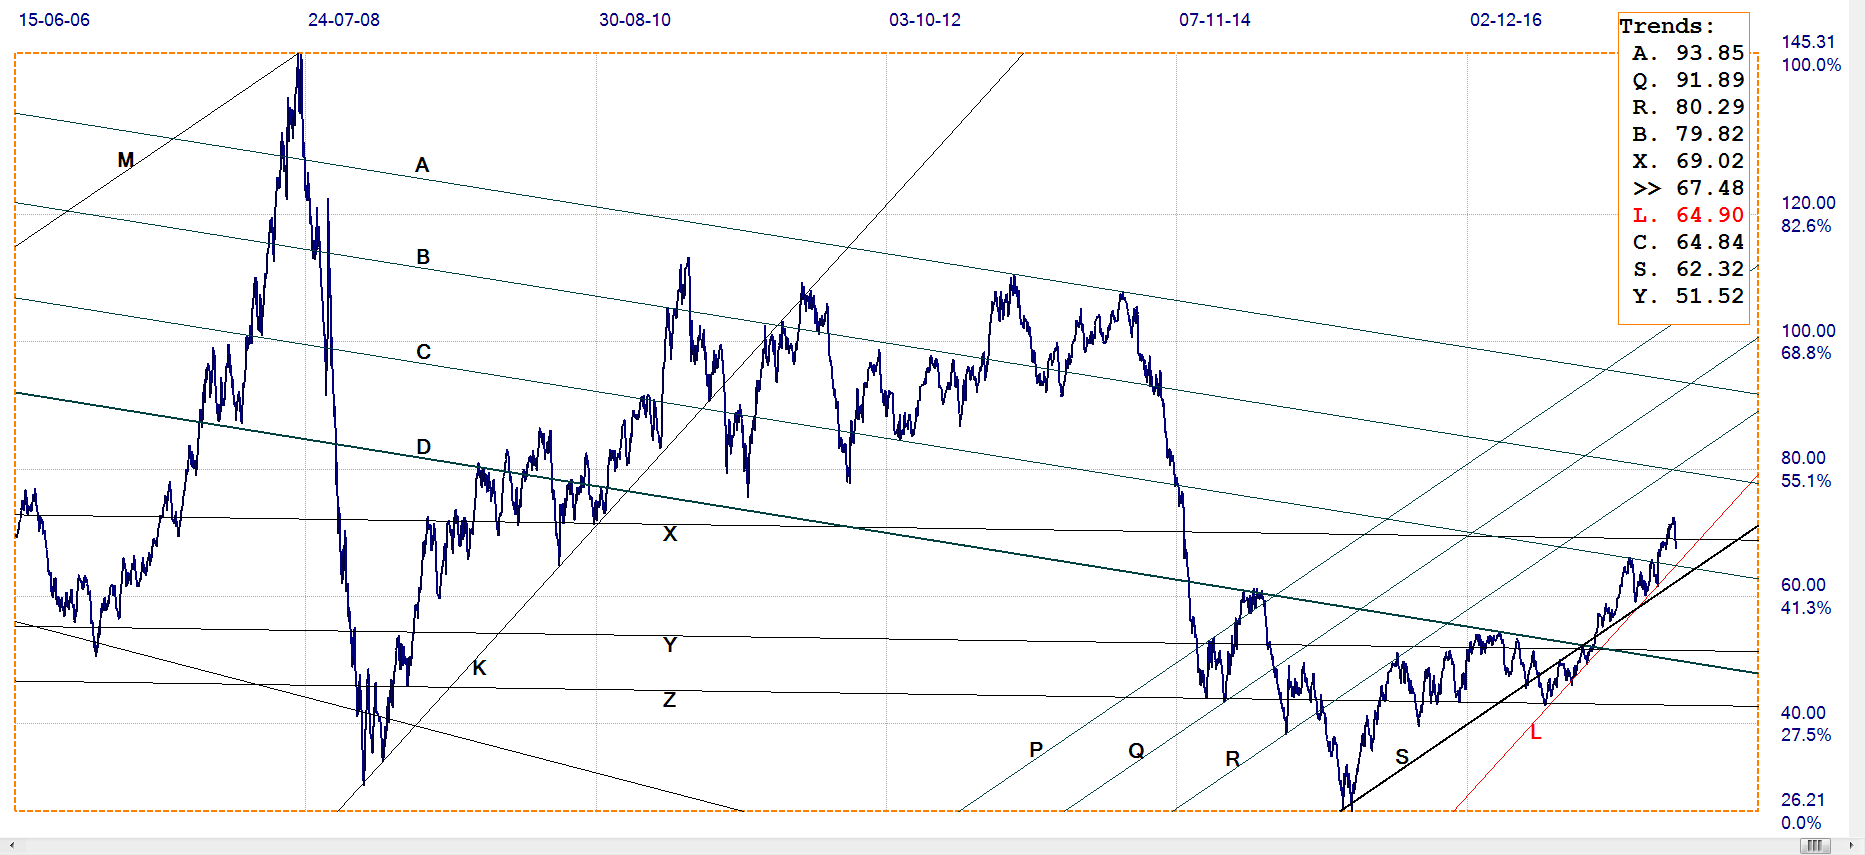
WTI Crude – Daily Close, Last = $67.48 (www.investing.com )
The break above the horizontal resistance at line X ($69.02) some weeks ago has failed to hold. While the bias in the market for crude has been bullish for some months now, the US has managed to isolate itself from OPEC to some degree given strong growth in local production and a policy desire to keep the price of crude low enough not to risk stalling growth in the economy.
Of course, the stronger dollar may also play a role since some US production is being exported and the stronger dollar will result in a lower dollar price to remain competitive with other sources of crude.


