Nail Biting Time For Gold Price And The DJIA


Last week the theme was that when a large river runs deep and fast, the surface is smooth with only an occasional swirl of water that reveals all is not so placid below. This has been the situation with the PM metals for the past few months. Prices were in a steady rising trend and raised expectations that this time, as had happened at the end of January, the prices of gold and silver again would do the same, at least. Prices would increase over month end, seeing that silver was getting geared up to challenge $16.00 again, continue higher with no pull back. However, as the selling pressure increased when Friday came around, we learned to our disappointment that in (some?) markets one should always beware of surprises.
Last week began with the price of gold holding above $1330/oz. It appeared to have stabilised and made a bit of a base after having cleared $1340 briefly during the week before. The odds are that most observers would have expected on recent history for the price to move higher again. The price drifted lower as the first notice day on Thursday approached and then continued even lower on Friday. The Friday London PM fix at $1311.95 was the low of the week. After the fix, gold sank more during the afternoon. It close the day below $1300 after touching $1290 briefly.
This surely is not well received by the gold bulls. No wonder the large shorts were handed an end of the month bonus with more than 21 000 contracts being closed over Thursday and Friday – a significant number for only two day’s trading. One can guess that a good proportion of these contracts were closed when panic set in after the price broke below $1300 and kept on going lower.
A second guess that should be right on target is that a significant proportion of gold bulls, many more than those who had closed their long positions on Friday and also earlier the week when gold dropped below $1330, have now turned very pessimistic on the near term future for the metal. The same holds for silver, of course. While its noon fix in London was at $15.56, the price of silver also kept falling during the NY afternoon to end at $15.19 – a dollar and more below the recent highs when the break above $16 had seemed to launch a new bull trend.
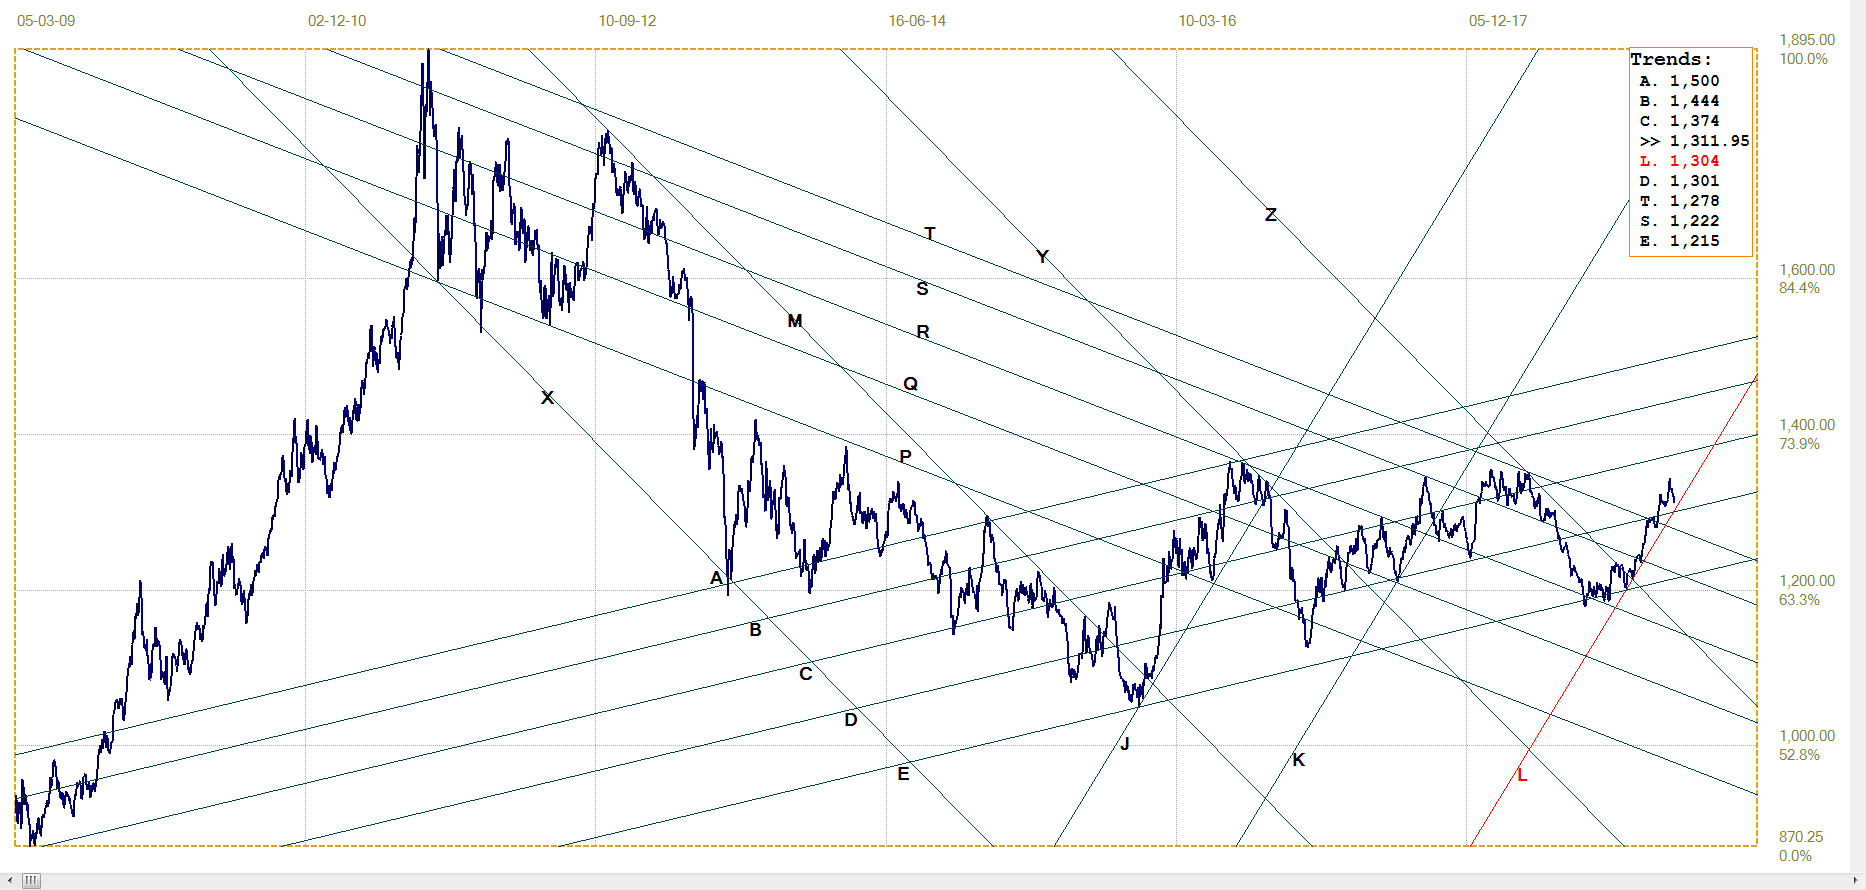
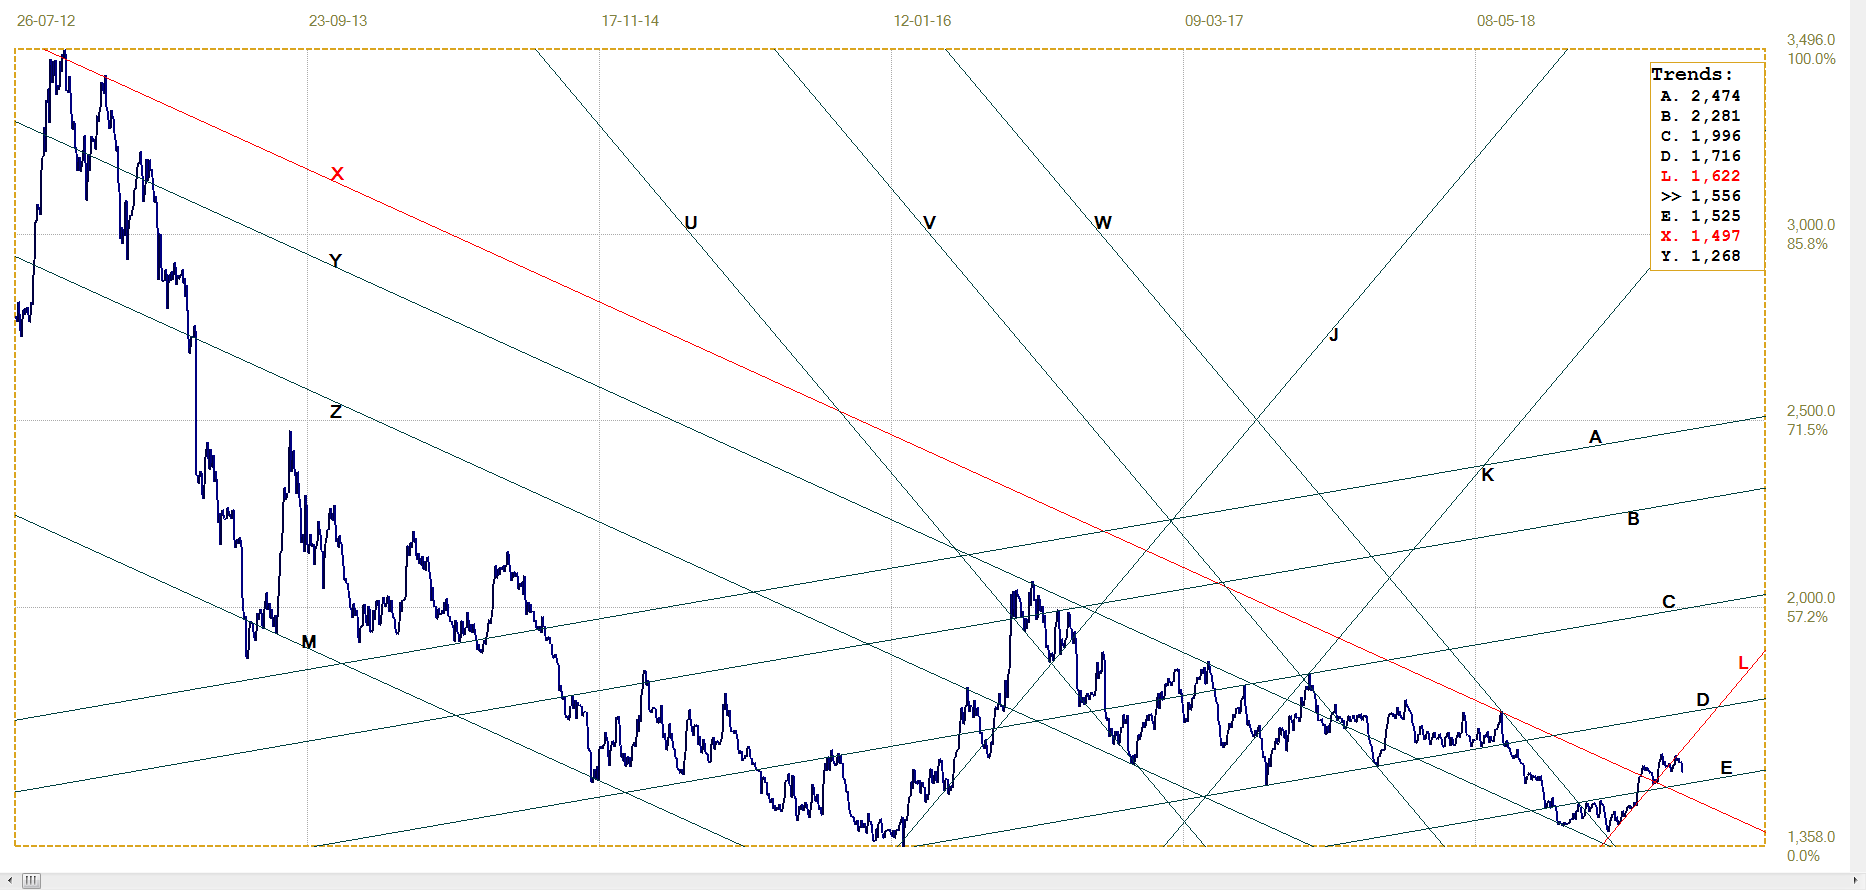
On the usual long term chart for gold, the price is still holding to the steep support of the past two months or so – at least in terms of the PM fix on Friday, which was still a little bit above the eventual close below $1300. On that chart the gold price has broken above the longer term bear trend, which holds longer term promise for the metal. A shorter term view of the gold price is presented in the chart below.
The chart shows that since 2013 and with the exception of the extended and severe assault on the gold price during the second half of 2015 that brought the post 2011 bear market to a close, the price has spent all the time in a slightly bearish channel MABC with bull channel PQR also in play after the low in December 2015.

London daily PM fix. Last = $1311.95
When gold broke above $1340 two weeks ago, it was the fourth occasion since late in 2013 that the price tested the top of shallow channel MABC at least once without breaking higher. The new reversal lower took place not off line A, but after failing to break above line Q, of the medium term bull channel. The good news is in terms of the London PM fix the bull market KL is still intact and has to be at or above $1303 at the next PM fix to hold within the channel.
The sad news is that the close on Friday was a little below $1300, which means the hoped for recovery is again facing an old and strong barrier before it can take off. This negative outlook is balanced by the promise of a break above the six-year old sideways channel should the price manage to break clear of resistance at the top of that channel at line M and of course also above line Q to move into band PQ.
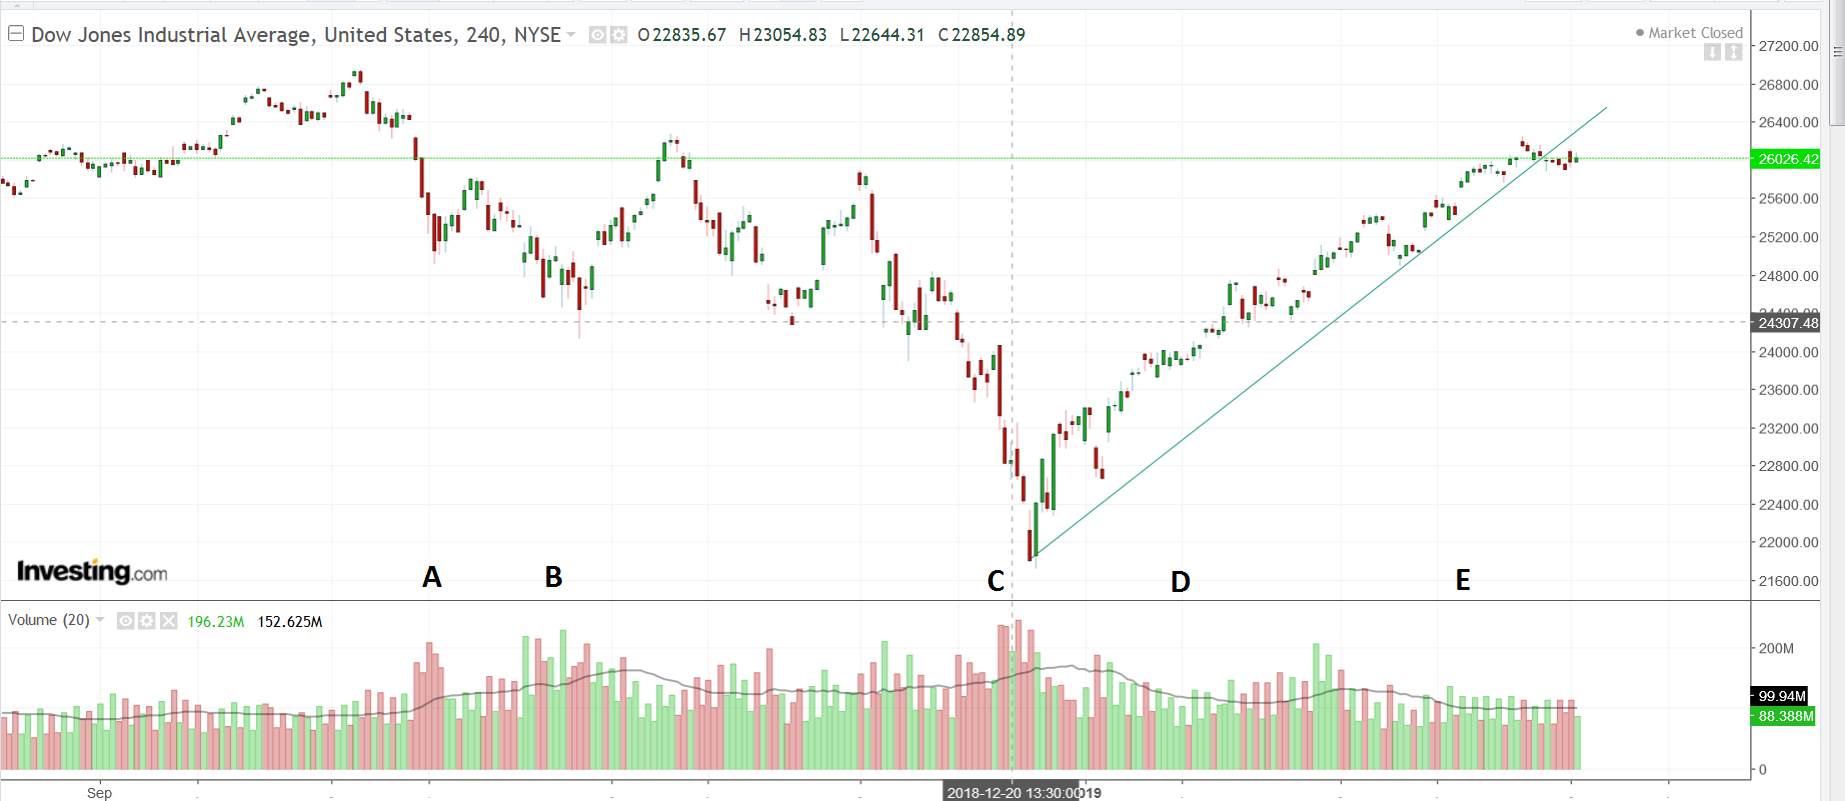
The post-Christmas rally on Wall Street is one of the best sustained and steepest rallies in Wall Street history. It was practically promised by the meeting between Mnuchin and the bank CEOs on the eve of Christmas that amounted to a PPT pep talk. The chart below shows there is now a technical possibility that the rally has run its course. This does not mean the Bear is standing ready to take over centre stage this week, but that it does warn that it is already waiting in the wings for an opportune moment to make its appearance.
Investing.com
This does not exclude the start of a bear market this week, but the odds of a bear trend starting and holding without strong forces countering such a trend are very small. When a normal market falls steeply, the normal reaction is for buyers to run for the sidelines to wait for really low prices. Initially, when buyers begin to return to the market, desperate sellers hit the bids as soon as these appear and the rate of decline becomes steeper.
Only when prices fall so low that they are true bargain do the feeding frenzy begin with buyers snapping up everything of any value. This is not what happens on Wall Street. The letters A and B show that as soon as prices began to fall, buyers stand ready in place to prop up the market, spiking the volume. C indicates a two stage bear market where the first sell off was mild and easily reversed. The second leg down was persistent and required a major investment of funds to keep control of the market – which failed to work; the market kept on falling on high volume. It required the mustering of the PPT by Mnuchin just before Christmas to bring the message to the sellers that they were going to be out-gunned and it would be a major mistake to take on the minions of the Fed in a price slugfest.
Letters D and E show that during the rally volumes tended to be higher on days when the price had increased. It seems that a rising price invited sellers to get out or go short, but with sufficient buyers to overcome the selling and keep the rally going. The two month rally since Christmas has now broken sideways through the steep rising trend support. It remains to be seen whether the rally can continue higher at a slower pace, or whether it has reached a plateau for the near term. As for the longer term, Wall Street and the US economy share a glum future.
Euro–Dollar
The tight consolidation in a narrow range along line L ($1.1344) continues, despite a brief blip below that support that has now been recovered. It would seem line W ($1.1422), the top of bear channel VW, is exerting a strong containing force on the euro that has kept it close to line L.
As time passes, the euro needs to either break above line W to leave the steep bear channel or it has to break below line L to resume and extend the bear trend. This has to happen quite soon, as there is not much room left in which to maneuver. The possibility of a break higher is preferred given the anticipation of a weaker dollar in the near future.
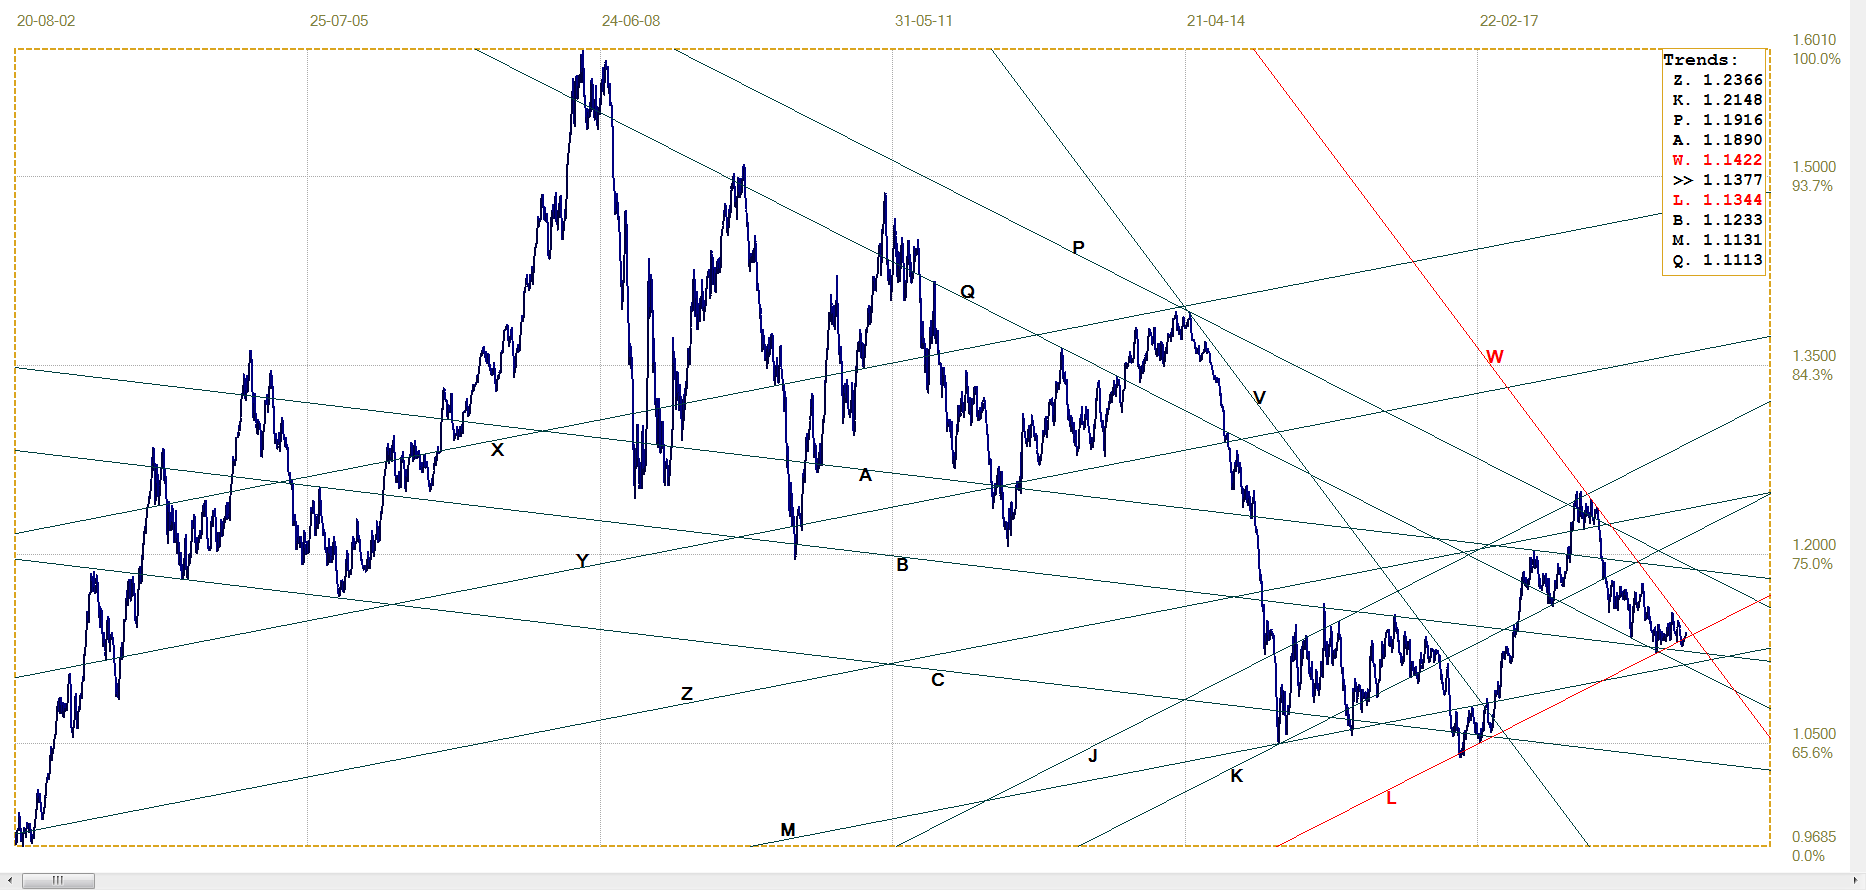
Euro–dollar, last = $1. 1377 (www.investing.com)
DJIA
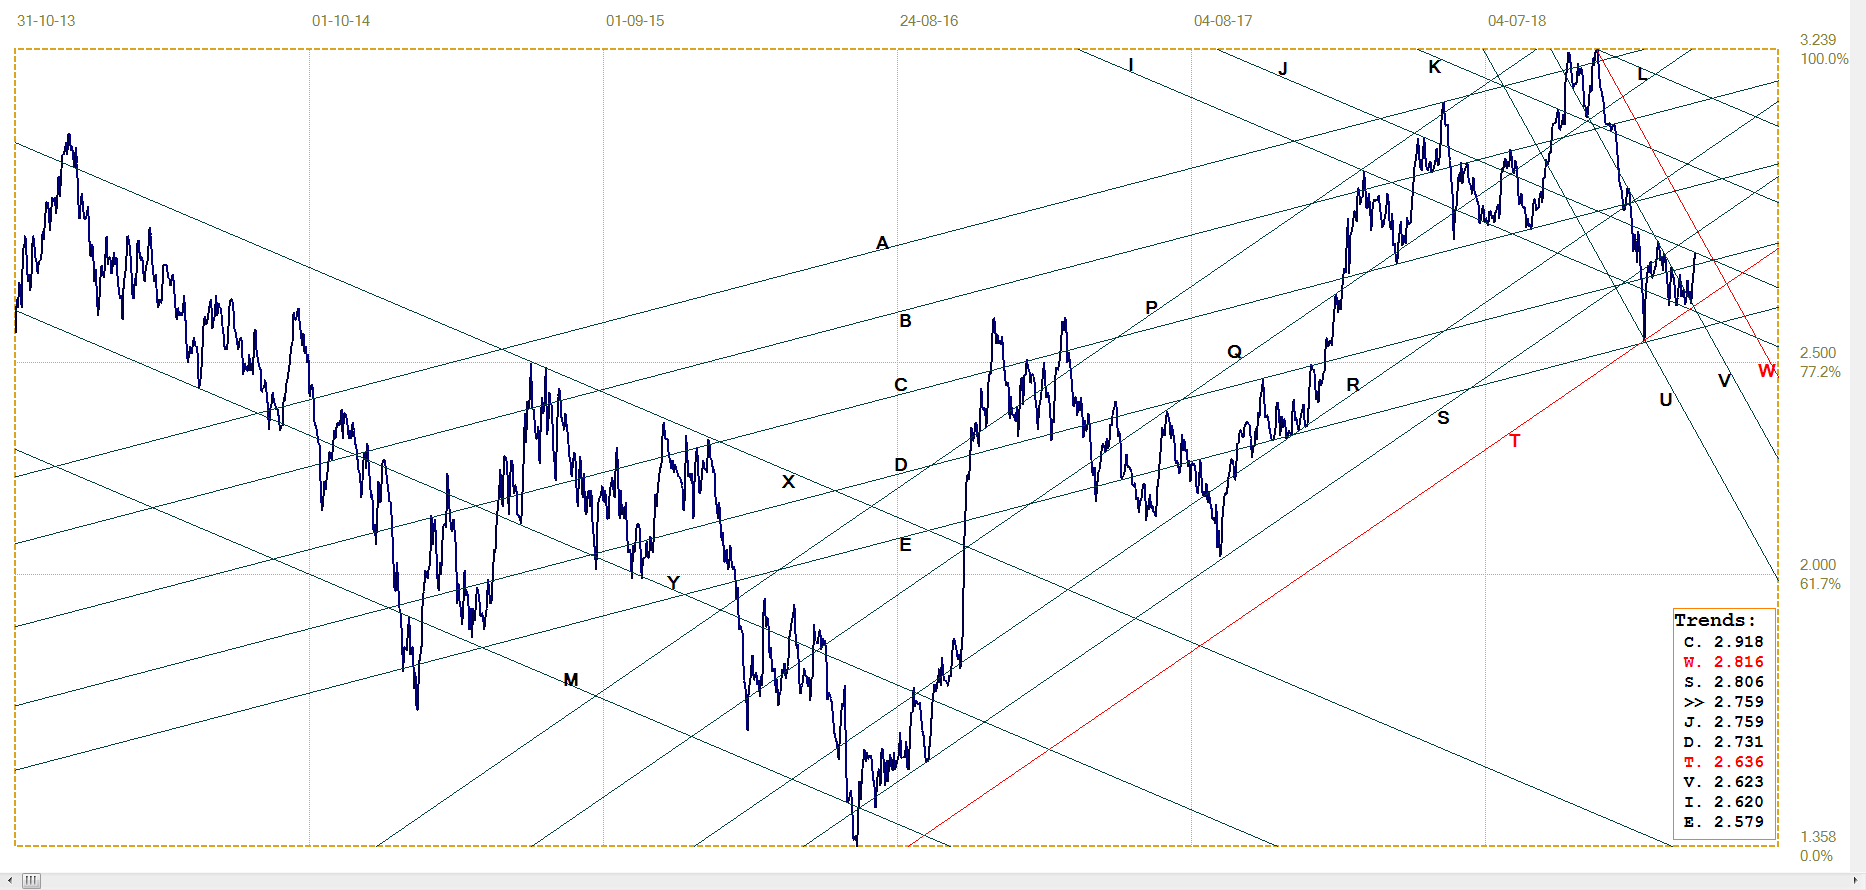
The DJIA has spent a few days in the vicinity of the top of channel UVW (25 954) without being able to extend the rally above the channel – as yet. It has broken marginally below the very steep support of line S (26 132) as already shown in the introduction. This week should reveal whether that is a warning that the bull trend is over and that bear channel VW is going to hold. Or not.
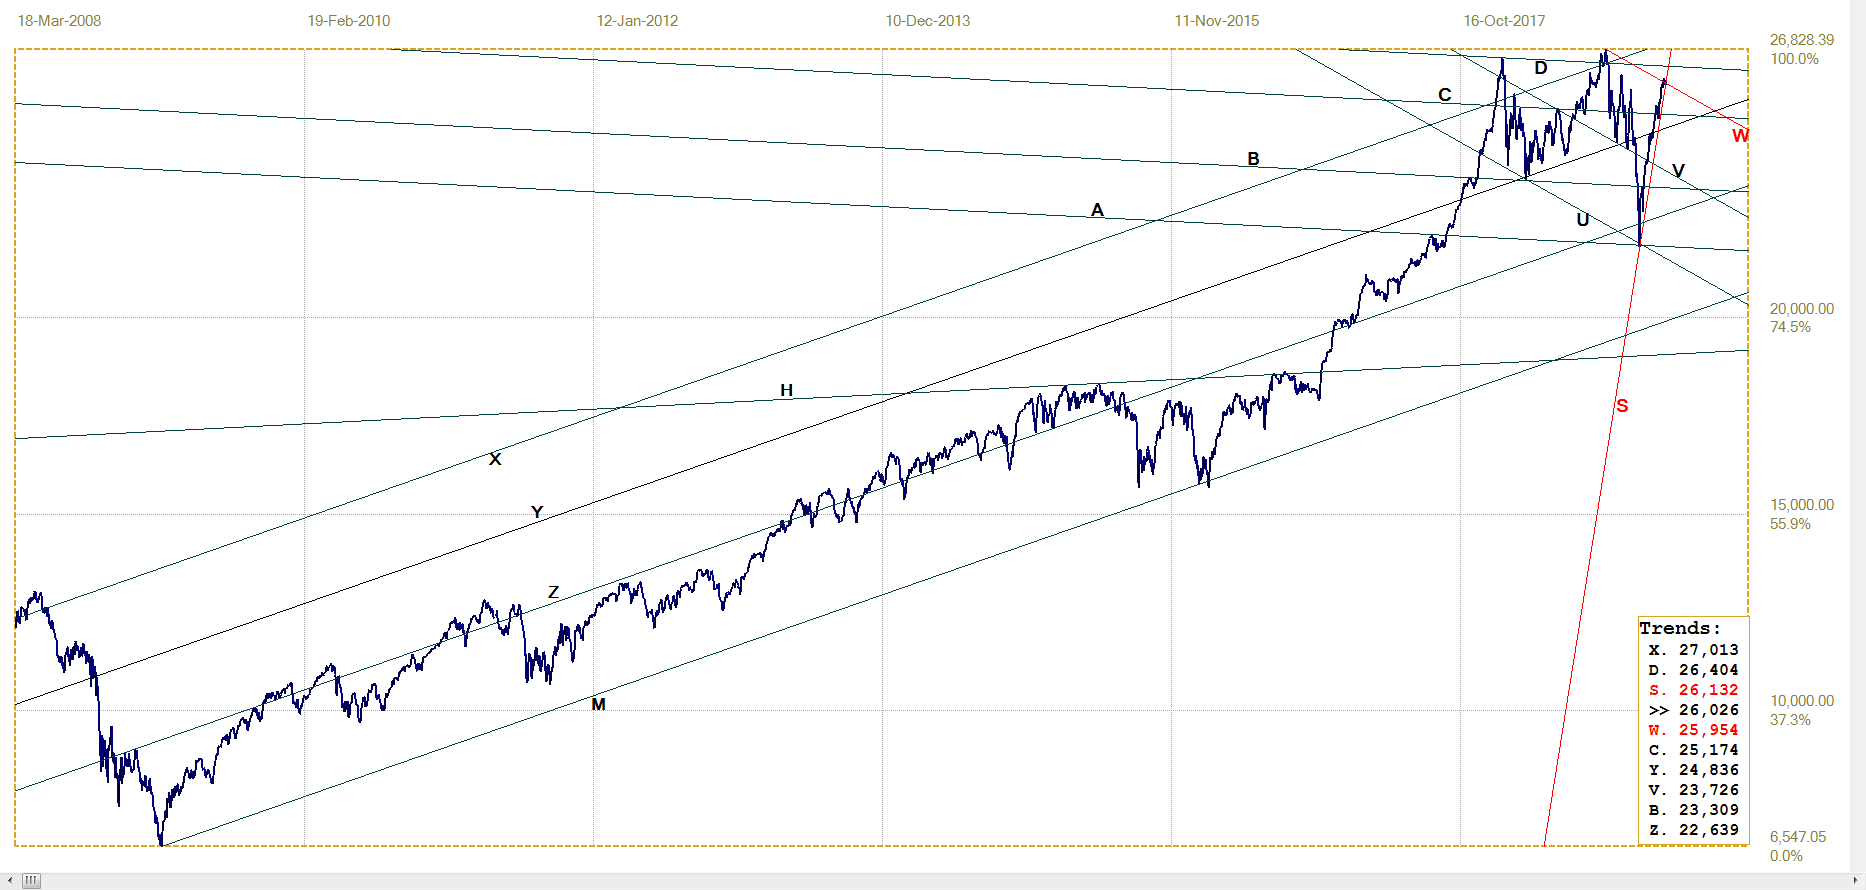
DJIA, last = 26026.32 (money.cnn.com)
Gold London PM fix – Dollars
Gold price – London PM fix, last = $1311.95 (www.kitco.com )
As mentioned earlier, the fact that the price of gold per the London PM fix is holding in steep bull channel KL ($1304) is good news that is tempered by the Friday close being below $1300. This is another major market that has to show direction this week – either to recover above the psychological $1300 level and $1304 technical level by the next PM fix, or to extend the bear trend further. Observe that line D is at $1301, which adds some more technical support to the psychological $1300 – IF the price can recover soon to above that level.
Euro–gold PM fix

Euro gold price – PM fix in Euro, last = €1150.45 (www.kitco.com)
Given the extended month-end attack on the price of gold, it was simply too much to expect that the euro price of gold could hold above steep support line L (€1159). The break lower is marginal, and so is the break below line Z (€1154), which is not yet intimidating, but a warning. Here also we should learn this week whether a new bear move will extend clear below support or whether the reaction lower will prove to be only a correction of limited extent and duration.
Silver Daily London Fix
As mentioned last week and often before, given the severity of the attack on silver it is no surprise that it could not sustain its rising trend above line L ($16.22); now more than $1.00 above Friday’s close. While many other markets are teetering between two outcomes, either up or down, the outlook for silver has to be bearish to sideways at best for the near to perhaps medium term. At least until there can be a recovery back into bull channel KL.
Silver daily London fix, last = $15.56 (www.kitco.com)
U.S. 10–year Treasury Note
U.S. 10–year Treasury note, last = 2.759% (www.investing.com )
The yield on the 10-year Treasury note held to the bond market bull channel UV (2.623%) as long as possible and even continued sideways after a break from the channel. Then the bears finally took over. The yield last week ended steeply higher, breaking clear above line D (2.731%) to reach line J (2.759%). While looking quite bearish now, the yield still has to break above line D and also break from the broader bullish channel VW (2.816%) before a bear trend can assume dominance.
West Texas Intermediate crude. Daily close
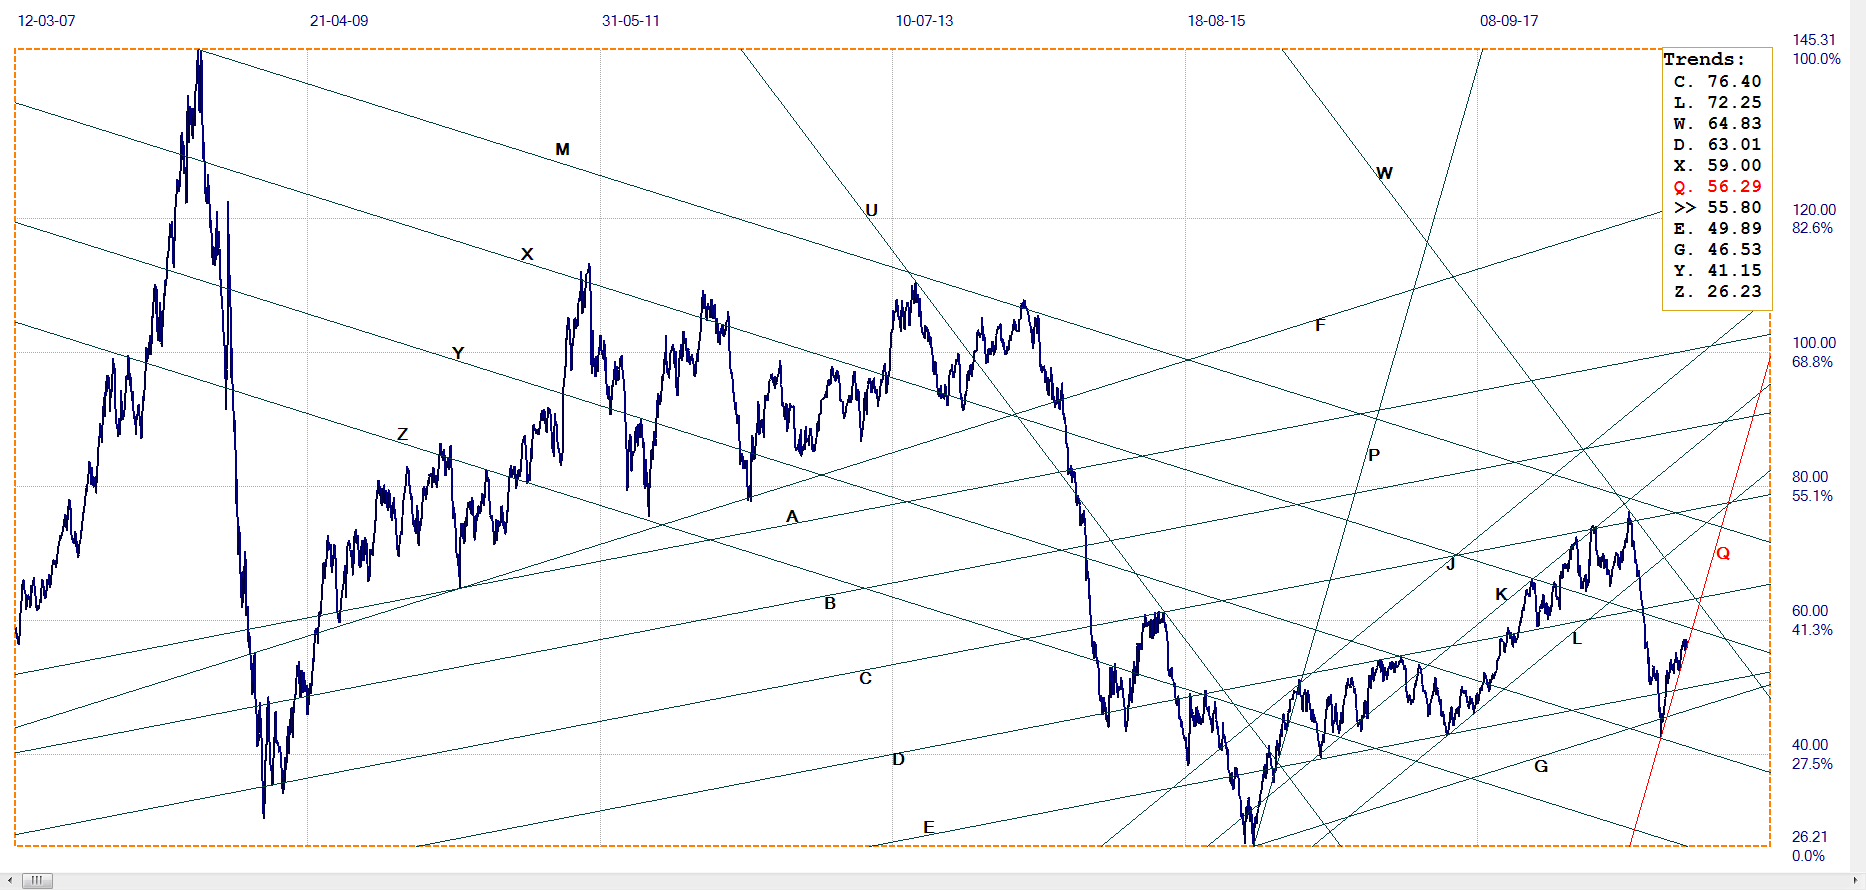
WTI crude – Daily close, last = $55.80 (www.investing.com )
A number of the charts show that financial markets have become adept at holding steep trends. This also applies to the market for crude oil. The close fit of the chart along line Q ($56.29) is evidence of the difficulties the market experienced to hold to the very steep gradient. However, it is starting to look as if the battle could be over, probably before resistance at line X ($59.00) is reached – and where a break higher will be required to confirm the bull trend should it be reached.
©2019 daan joubert, Rights Reserved chartsym (at) gmail(dot)com


