An Objective Look at Silver


Recently, I have received many requests from both paid subscribers and public readers for more coverage on silver. Reason being, according to the consensus, is that gold at $700 is a gimme, and should reach $1000 by summer. When that happens, silver will blow gold away because of this and that. Therefore, according to these traders, silver will outperform gold and that is where smart money should be going forward.
As always, I do not believe in predictions and forecasts; I prefer to follow price action. Having been an investor for thirty years, one thing I know for sure, and that is nothing in the financial world is a "gimme".
Yes, silver has been and is outperforming gold since 2003. Will it continue? The consensus is a resounding "yes". I prefer to take an objective look at it…..
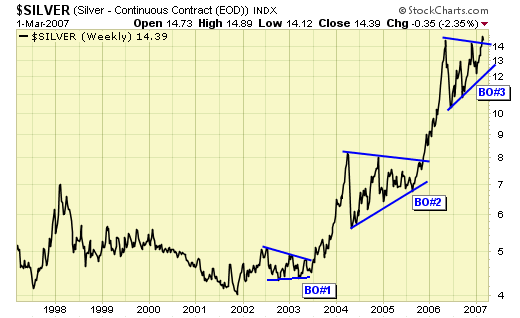
Both gold and silver have broken out currently, with silver leading the charge. My previous special report has outlined these breakouts and what it would require to negate these breakouts. In fact, silver has already broken out to a new weekly closing high as of 2/23 while gold has not. This is what many traders are excited about. As the above silver chart clearly shows, the first breakout (BO#1) in this silver bull market occurred in 2003. Then a second breakout (BO#2) took place in late 2005. BO#3 is happening right now, and if history is a guide, silver should reach a minimum of $20. What are the chances of that not happening?
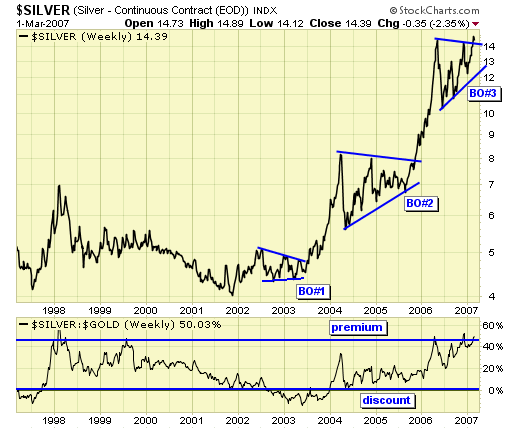
The same silver chart except this one has the silver/gold ratio on it.
- The ratio is very effective in showing us when silver outperforms gold.
- Obviously we want to overweigh silver when the ratio is rising, and under weigh when the ratio is falling.
- The ratio peaked in 98 and bottomed in 2003, therefore, silver was trading at a premium to gold in 98, and at a discount to gold in 2003.
- BO#1 occurred when silver was trading at a discount to gold. Buying BO#1 was a smart call.
- BO#2 was no longer trading at discount, but far from a premium. Buying BO#2 was a good call.
- We are now at BO#3, and silver is now trading at a premium to gold. Still a good buy? You make the call.
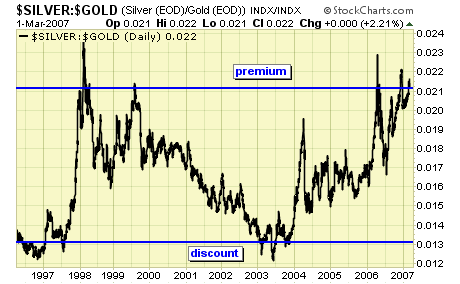
The same silver/gold ratio on a price chart, showing the premium/discount cycles of silver to gold.
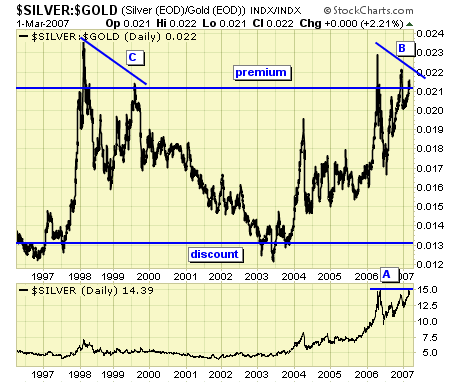
Again, same chart but with the price of silver at bottom of chart. I want to draw your attention to:
- on a daily closing basis, silver has reached the price level of May 2006.
- however, the ratio is falling, indicating that silver is now underperforming gold.
- the same divergence in 99 led to a sell off in both gold and silver, with silver underperforming gold until the ratio bottomed in 2003.
Will this time be different? You make the call.
SUMMARY
This is my objective look at silver. Technical analysis is nothing more than an educated guess. But being independent and thinking outside of the box allows me to see things other analysts may not see, and as a result, may not agree. For me and my subscribers, I would like to see this silver/gold ratio continuing up and never drops again, so that we can park our money in silver and become filthy rich. But the markets are seldom that accommodating, and the best offense is a good defense. So, while many are cheerleading the current breakout in silver with $20 being a "gimme", I exercise caution and pay attention only to price action.
Note: do not begin shorting silver based on this analysis. In trading and investing, whether you are long or short, do so only if you can manage risk. Spread traders may see an opportunity here by long gold/short silver, do so at your own discretion and always manage risk.
********
Disclaimer: Words of caution: public readers of my commentaries should exercise their own judgment as to whether to buy or sell anything. Never trade based on other people's analysis. Knowing which way to place our bets is only half of the formula to success. Wishing you peace and profits......................................

Jack Chan is the editor of Simply Profits, established in 2006. Chan bought his first mining stock, Hoko Exploration, in 1979, and has been active in the markets for the past 37 years. Technical analysis has helped him filter out the noise and focus on the when, and leave the why to the fundamental analysts. His proprietary trading models have enabled him to identify the NASDAQ top in 2000, the new gold bull market in 2001, the stock market top in 2007, and the US dollar bottom in 2011.
More from Gold-Eagle


