Technical Analysis Of The Markets


Current Position Of The Market
SPX Long-Term Trend: If the market strength persists, the long-term trend may need to be re-evaluated.
SPX Intermediate-Trend: SPX intermediate P&F count to 2270 has now been met, but there are higher counts that could still be filled before a serious reversal take place.
Analysis of the short-term trend is done on a daily-basis with the help of hourly charts. It is an important adjunct to the analysis of daily and weekly charts which discuss longer market trends.
Is An Intermediate Top Forming?
Market Overview
In previous letters, I have warned that signs of a market decline of intermediate proportion are accumulating. These include extreme greed sentiment, strong negative divergence in the NYSE McClellan Summation Index, and relative weakness to the SPX exhibited by the QQQ (Nasdaq 100 ETF). In addition, the SPX weekly indicators are beginning to show deceleration and negative divergence patterns.
Cycles are undoubtedly at the root of this budding negativity which is still well-disguised by a seemingly strong stock market in which major indices have been making new all-time highs on a regular basis. Focus is now on the DOW industrials reaching 20,000. Last week it came within 13.50 points of this landmark, but disappointed the bulls when it pulled back for a couple of days. Most likely, they can pop the champagne cork next week when we are likely to see the last vestiges of market strength for a while. But the celebration should be short-lived! After that, it could be downhill all the way into April/May 2017. This is when the next 34-wk cycle is supposed to make its low, along with the 20-wk cycle. These alone could put a serious crimp in the current advance, but if Erik Hadik (www.insiidetrack.com) is right, their significance will pale in the light of the 17-yr cycle low which he expects to take place at the same time.
We don’t have to make a solid forecast of this occurrence for now, but we must continue to monitor the intermediate-term market indicators (and prices) to see if they weaken further over the next few weeks. The last time the 34-wk and 20-wk cycle bottomed in close proximity was in January, when they did so about three weeks apart along with the 7-yr cycle. This time, their coincidence should be even more exact, and they could have the 17-yr cycle as a companion!
Analysis (This chart and others below, are courtesy of QCharts.com.)
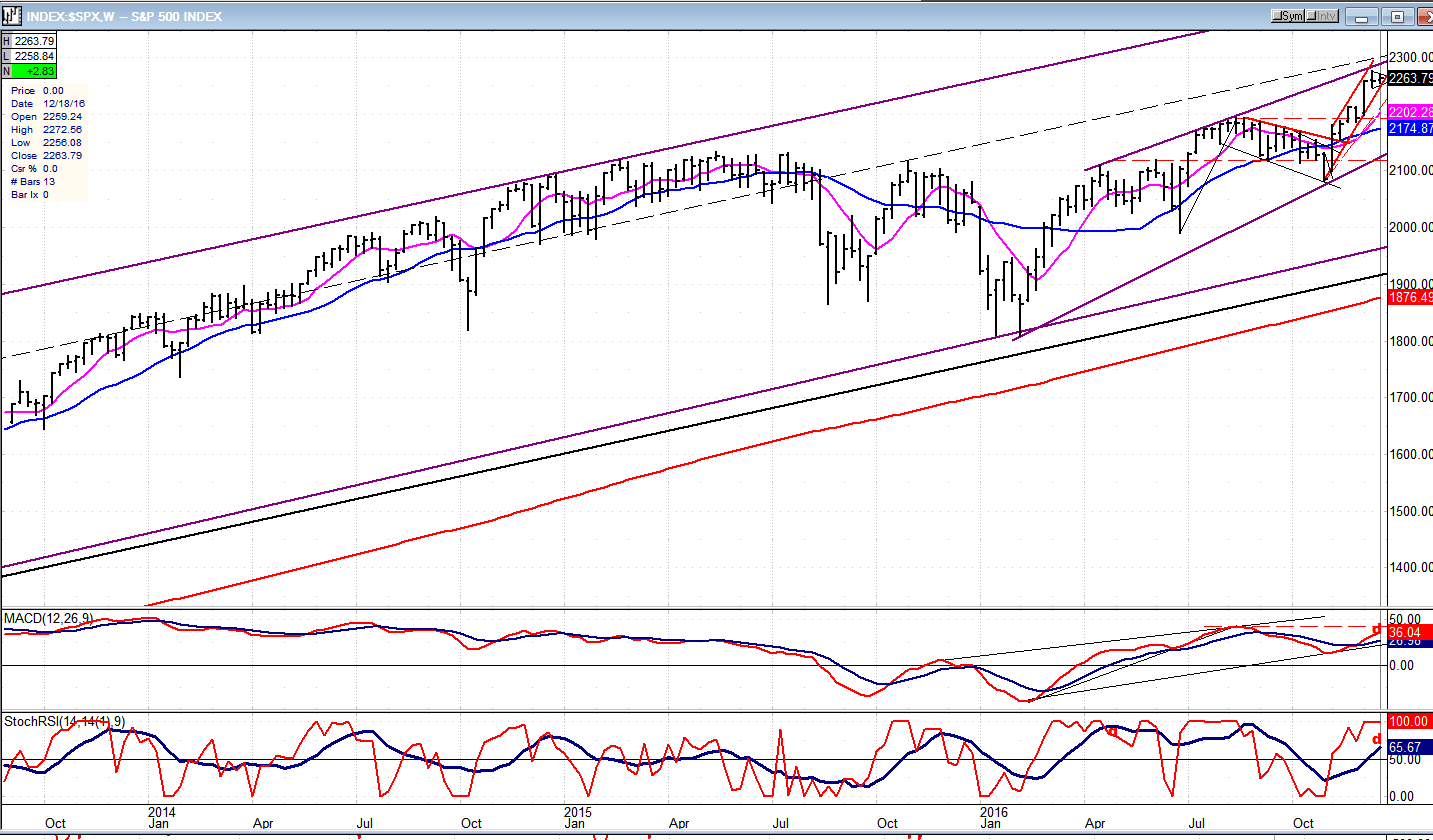
Weekly Chart
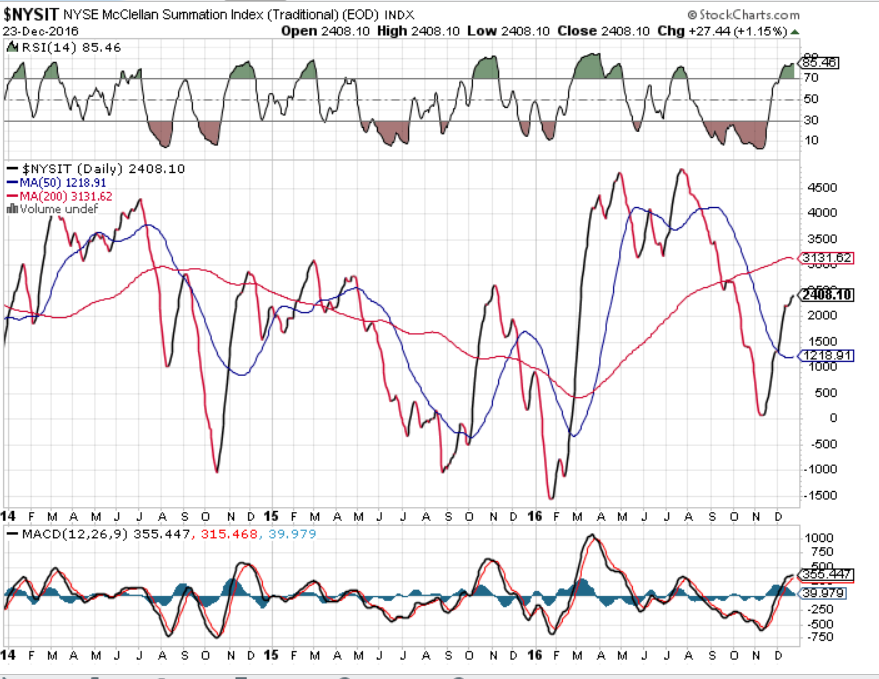
I am not going to analyze this chart from a price perspective. I am posting it primarily to illustrate the longer-term divergences that are building up. These show up in the momentum indicators in a small but significant way. Some divergence is beginning to appear in the MACD, but it is more pronounced in the SRSI’s slower MA, which I have found to be significant. But a far greater disparity shows between the price index and breadth, as shown below. Note also, that the RSI of the Summation Index has been overbought for the past two or three weeks. It normally does not stay in that area very long, so we could expect to see the A/Ds begin to worsen in another week or so.
 \
\
Daily Chart
From the 1810 low in January, the daily chart of SPX shows a pattern which could be interpreted as an ending diagonal that is nearly complete. If some weakness begins to pull prices down from this level and continues until they break the lower trend line, then we will have confirmation. On the other hand, if we only get a minor retracement and continue to move higher, that interpretation is incorrect and we will need to re-evaluate.
In addition to the larger pattern, there is a small diagonal forming in the rally from 2084. It has reached resistance at the trend line which connects the previous highs and which is the top of the large diagonal.
Looking at the oscillators, the MACD is weakening, SRSI is still declining, and the A/Ds are neutral, at best. A concerted downturn in these will be needed to signal the beginning of a price decline.,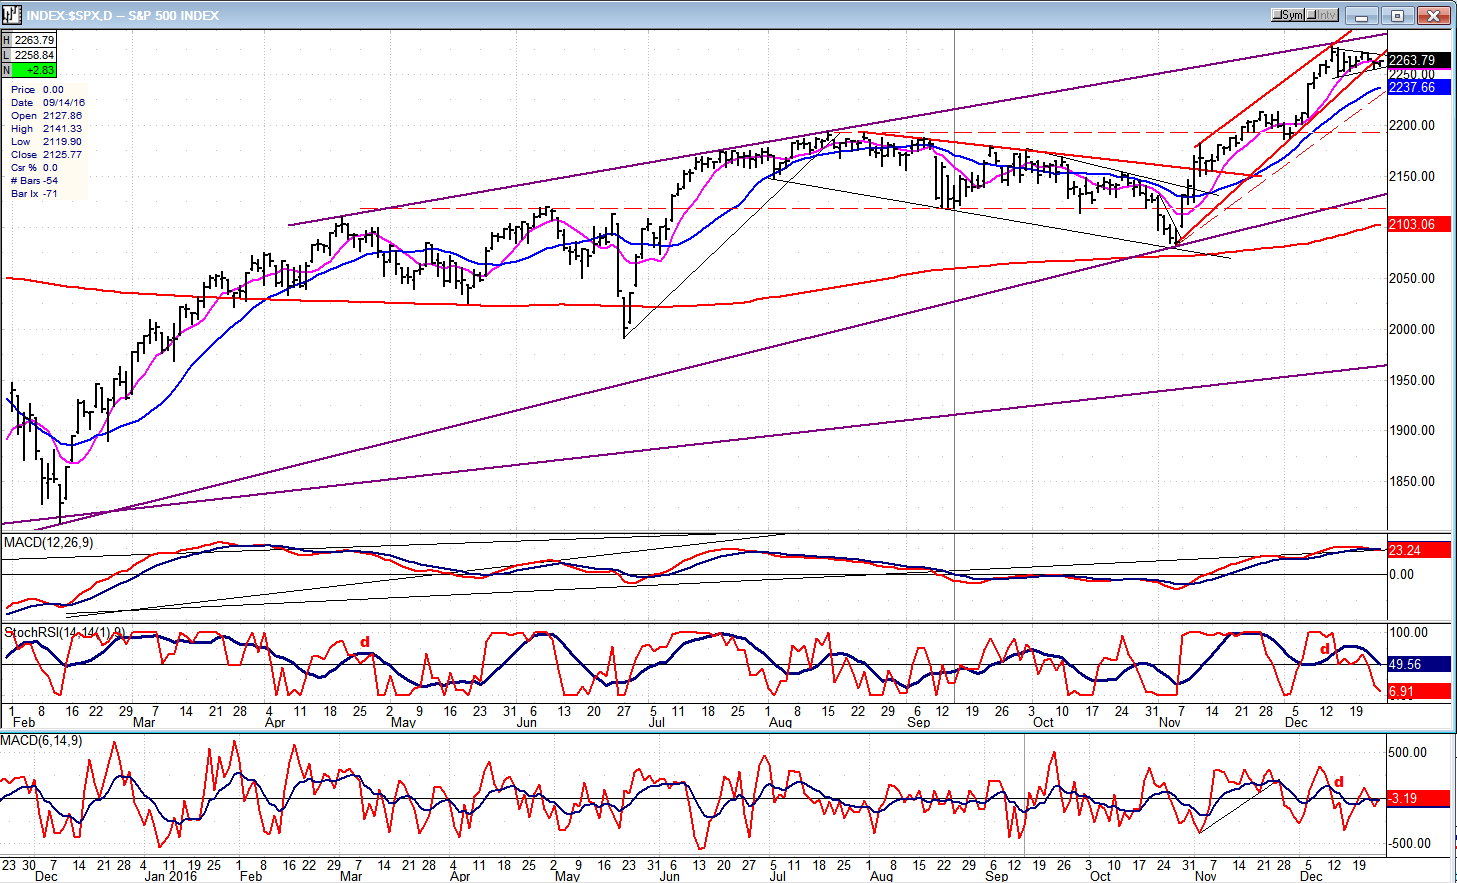
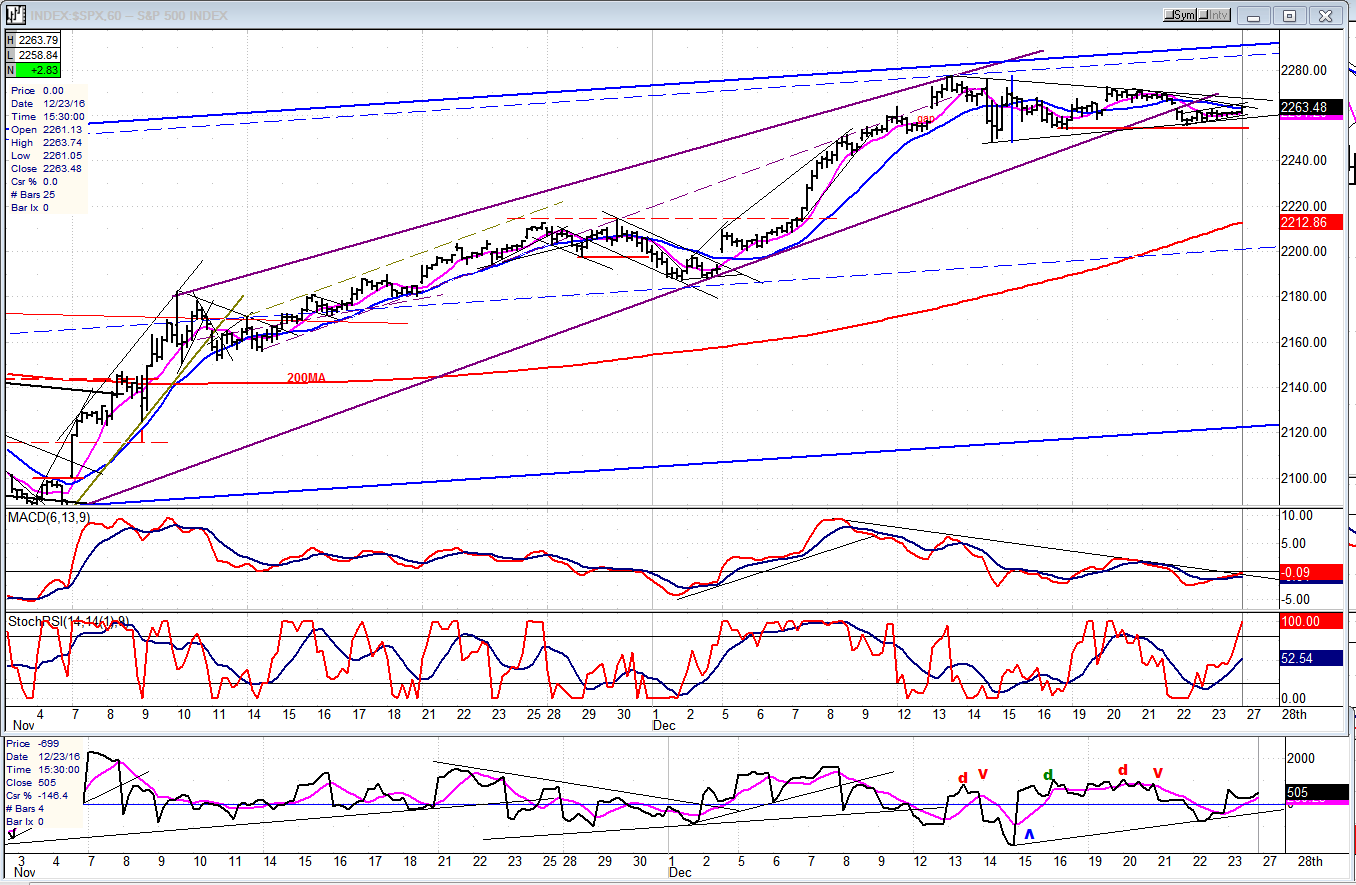
Hourly Chart
The smaller wedge from 2084 is shown more clearly on the hourly chart. Even if we draw another trend line which connects with the new low, it will still trace a diagonal pattern. Over the past week, we appear to have created a contracting triangle. This suggests slightly higher prices ahead; but they will run into the same resistance created by the top of the blue channel which stopped the previous advance.
There is a good chance that Friday brought an end to the triangle consolidation. Some buying took place at the close which triggered a buy in the SRSI and the A/D oscillators. A follow through in price on Tuesday would also create a buy signal in the MACD. The week after Christmas tends to be historically bullish, so the SPX will have another chance at overcoming the 2770 resistance and perhaps reach the next resistance level of about 2790.
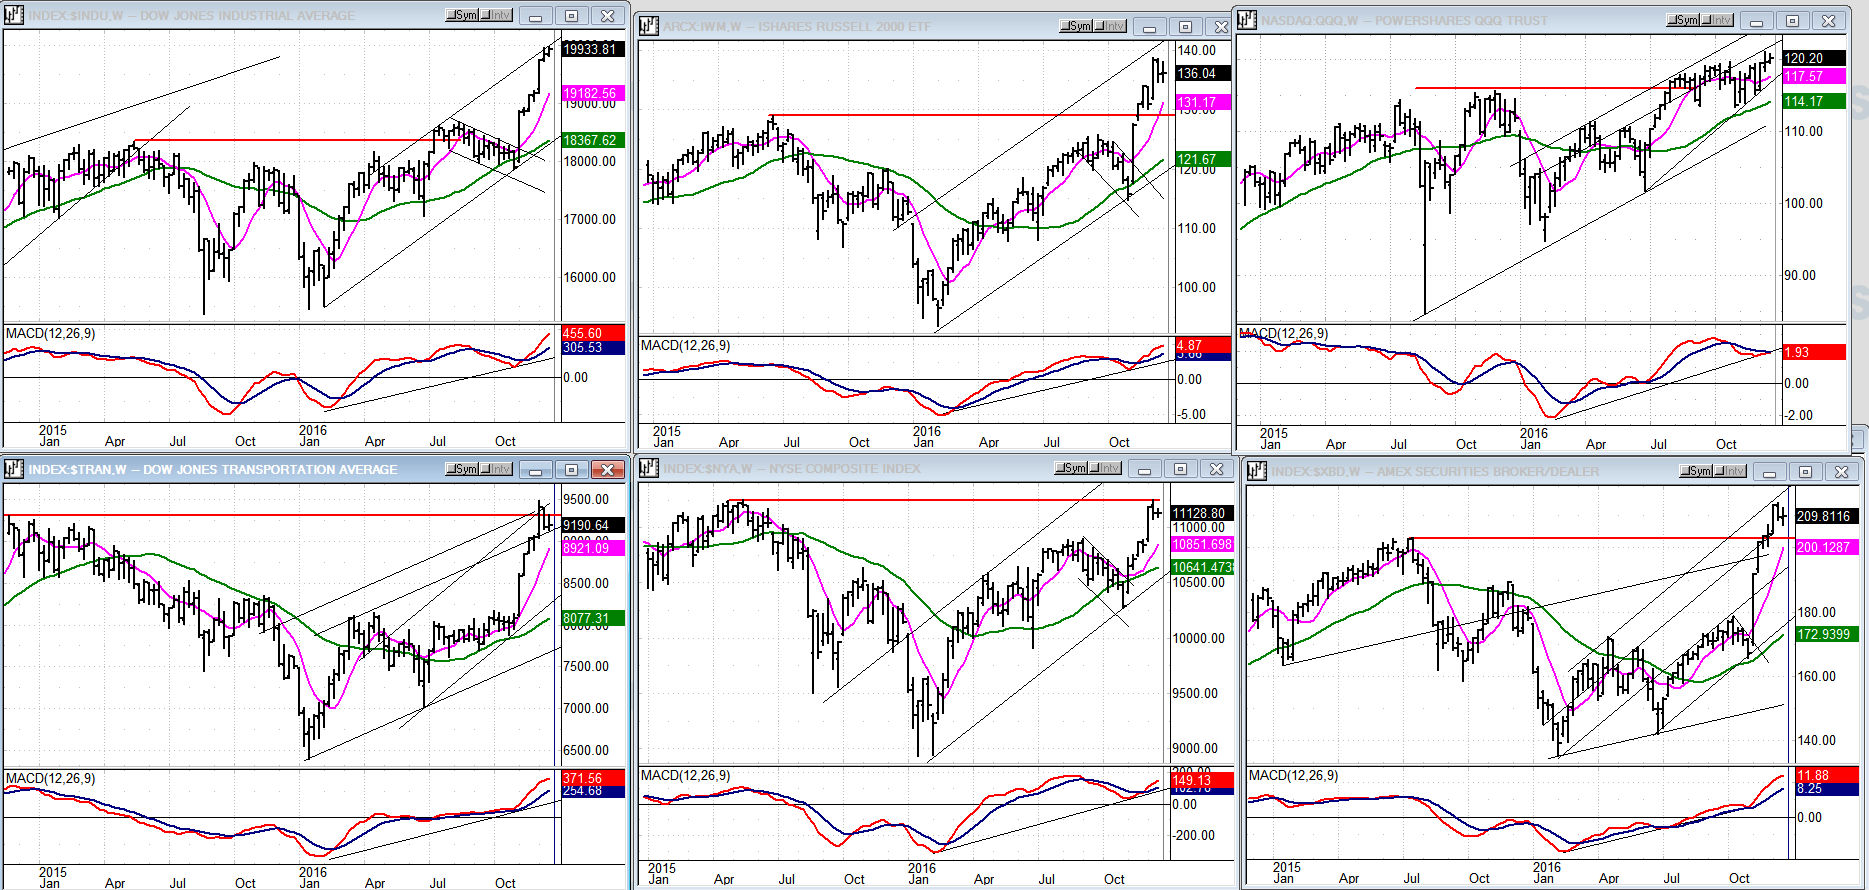
An overview Of Some Major Indexes (Weekly Charts)
Not much change in the weekly indicators of these indexes. All are neutral except for the QQQ which displays negative divergence. It’s too soon to make a valid analysis of the future trend based on these chart patterns alone.
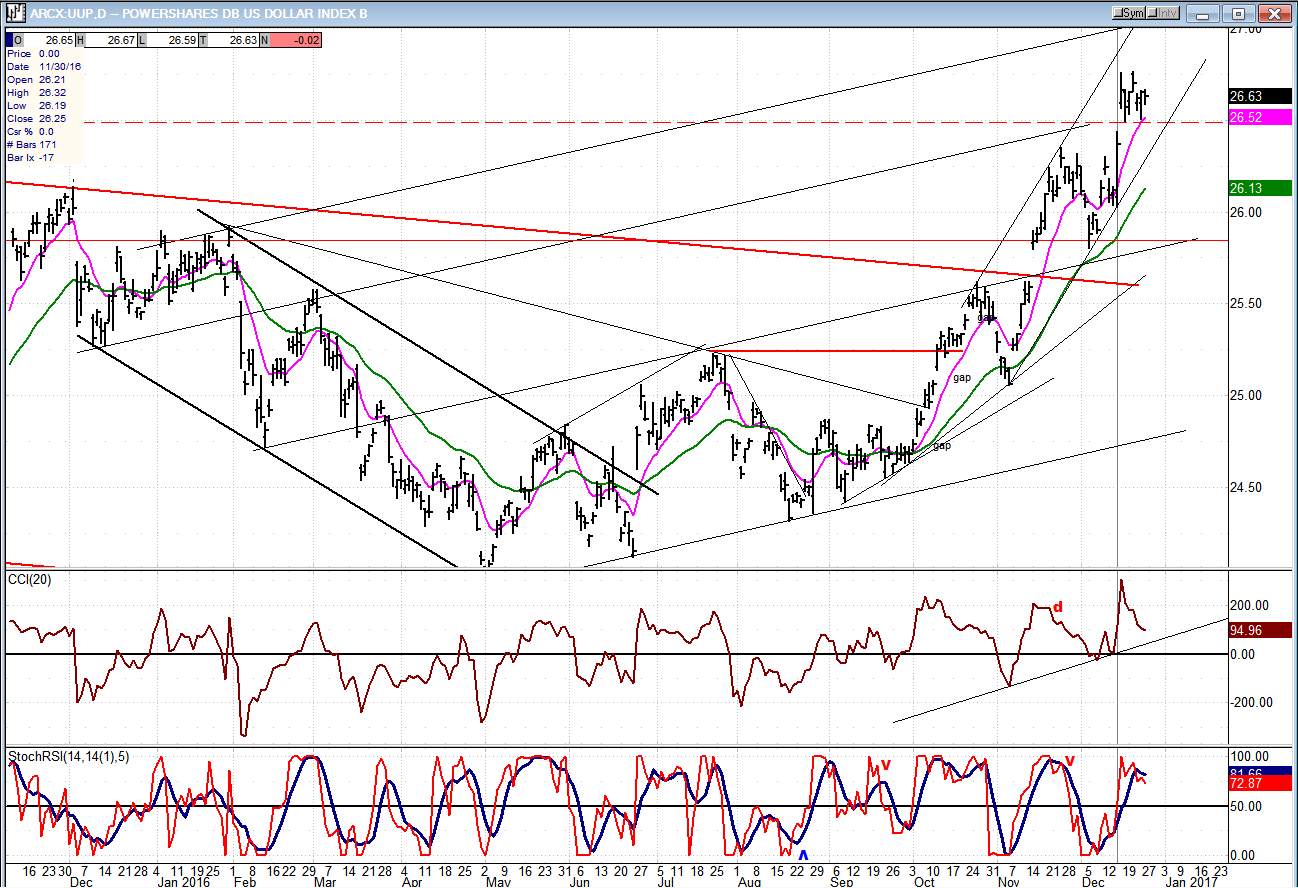
UUP (Dollar ETF)
UUP is trading at a 7-year high and appears to be consolidating for one more up-thrust which could reach its 27 projection before a lengthier correction takes place; but this would only be a consolidation in an uptrend since it has the potential of rising to 30 eventually.
GDX (Gold Miners ETF)
GDX has been going in the opposite direction of UUP. It may wait until UUP shows a more definite tendency to correct before bouncing. However, it has a long way to go before completely reversing its downtrend, since it would have to break the upper red channel line to do so.
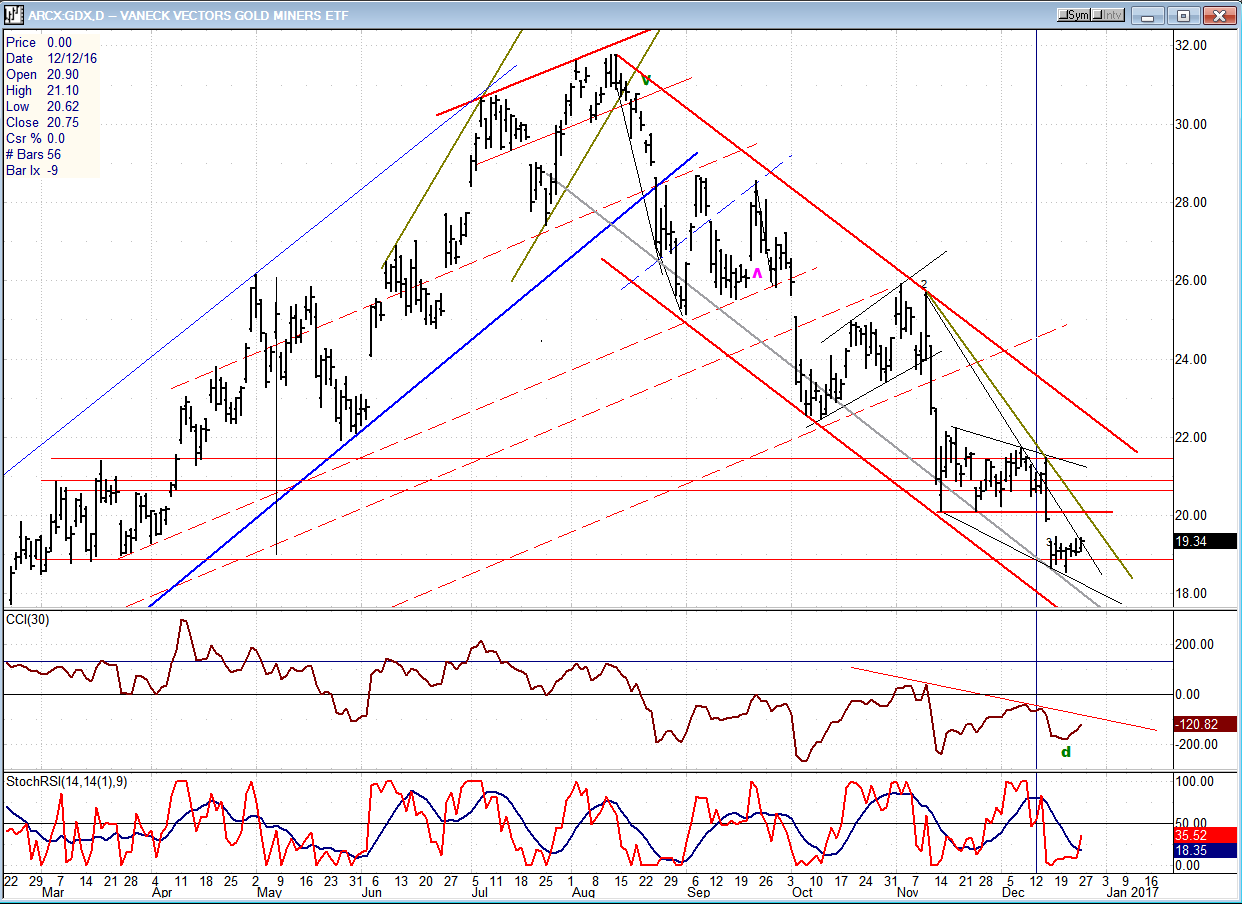
Note: GDX is now updated for subscribers several times throughout the day (along with SPX) on Marketurningpoints.com.
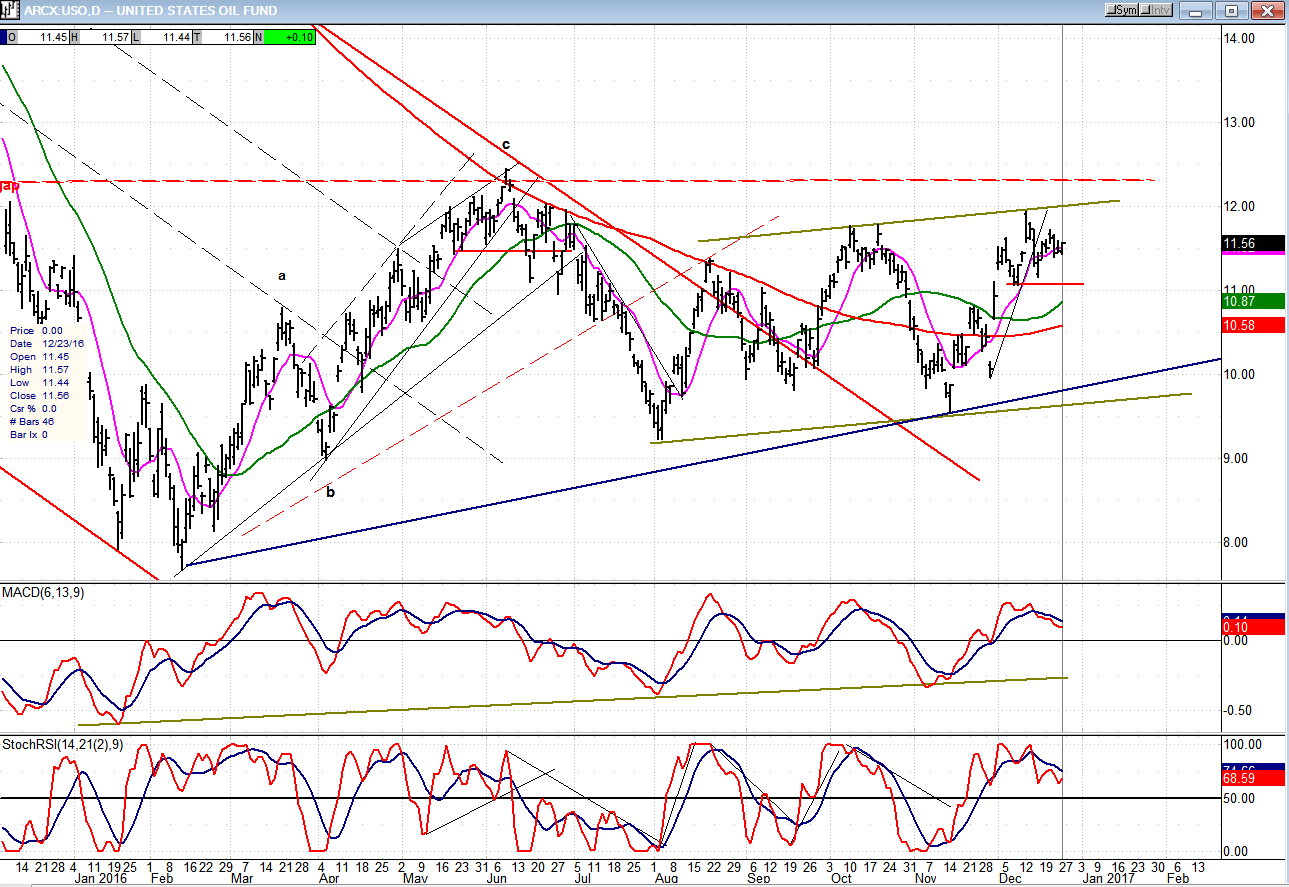
USO (US Oil Fund)
USO has moved to the upper range of its consolidation channel, but needs to go through it to show that it’s ready to start a genuine uptrend. Failing to do so would probably send it back to the bottom of the channel.
Summary
SPX continues to show the potential for making an intermediate top, but could have another small upward thrust before starting a lengthy correction. Ample warning is being given by reliable indicators, and the correction would conform to current cyclical patterns.
********
For a FREE 4-week trial, send an email to [email protected], or go to www.marketurningpoints.com and click on “subscribe”. There, you will also find subscription options, payment plans, weekly newsletters, and general information. By clicking on "Free Newsletter" you can get a preview of the latest newsletter which is normally posted on Sunday afternoon (unless it happens to be a 3-day weekend, in which case it could be posted on Monday).
The above comments and those made in the daily updates and the Market Summary about the financial markets are based purely on what I consider to be sound technical analysis principles. They represent my own opinion and are not meant to be construed as trading or investment advice, but are offered as an analytical point f view which might be of interest to those who follow stock market cycles and technical analysis.

When Andre Gratian was a stock broker years ago, a friend introduced him to technical analysis of the market. Consequently, it is not an exaggeration to say that Andre fell in love with this approach! Ever since then, it has become an increasingly important part of his professional life. Gratian has studied the works of Wyckoff, Edwards & Magee, Edward J. Dewey (cycles) and many others. However, one of my most profitable undertaking has probably been to study Point & Figure charting, which he finds invaluable in analyzing stocks and indices. If he were restricted to one methodology, this is the one that he would choose. This well-rounded background has given him what he feels to be a special insight into the stock market, facilitating the recognition of meaningful patterns and the ‘turning points’ in all trends, whether they be short or long term. Andre feels very comfortable discussing the stock market and passing on meaningful information to others. His subscribers include individuals and money managers throughout the world. Moreover, his Newsletters are currently published on several financial sites, here and abroad.


