Technical Analysis Of The Markets


Current Position Of The Market
SPX Long-Term Trend: If the market strength persists, the long-term trend may need to be re-evaluated.
SPX Intermediate-Trend: SPX intermediate P&F count to 2270 has now been met, but there are higher counts that could still be filled before a serious reversal take place.
Analysis of the short-term trend is done on a daily-basis with the help of hourly charts. It is an important adjunct to the analysis of daily and weekly charts which discuss longer market trends.
A Correction Is Under Way
Market Overview
After several attempts at rising above the 2278 level and falling short, SPX appears to have given up and started a deeper correction. A hold above 2245 would have looked like a consolidation pattern, but by dropping lower and declining below 2240 on Friday, it looks as if the intermediate top which was discussed last week is beginning to take hold.
If it is, it will take hold in stages. We are far from having a confirmation, and probably the most weakness we can hope for over the short-term will be a retracement to the 2212 level which is both a support and pivot level. A normal .382 retracement of the uptrend which started at 2084 could also take the index just a little lower, to 2203. That would hardly be enough to confirm 2278 as the top of the bull market, and the onus would then be on the next rally to make a new high and show the bull it is still alive and well.
Last week, we mentioned that if cycles have anything to say about the direction of the market for the next few months, the decline which is starting now could last until April-May. But cycles are not reliable enough as a forecasting tool and they must be confirmed through other technical means. The weekly trend may be in the process of topping. If SPX drops to the low 2200s, the weekly indicators will shift to a sell mode and this will be one of the requirements needed to suggest that we have started an intermediate correction.
There is a CIT with a bearish bias due at the end of this week, but near the close on Friday, SPX bounced twice from 2234, so it could hold here before moving lower.
Analysis (This chart and others below, are courtesy of QCharts.com.)
Daily Chart
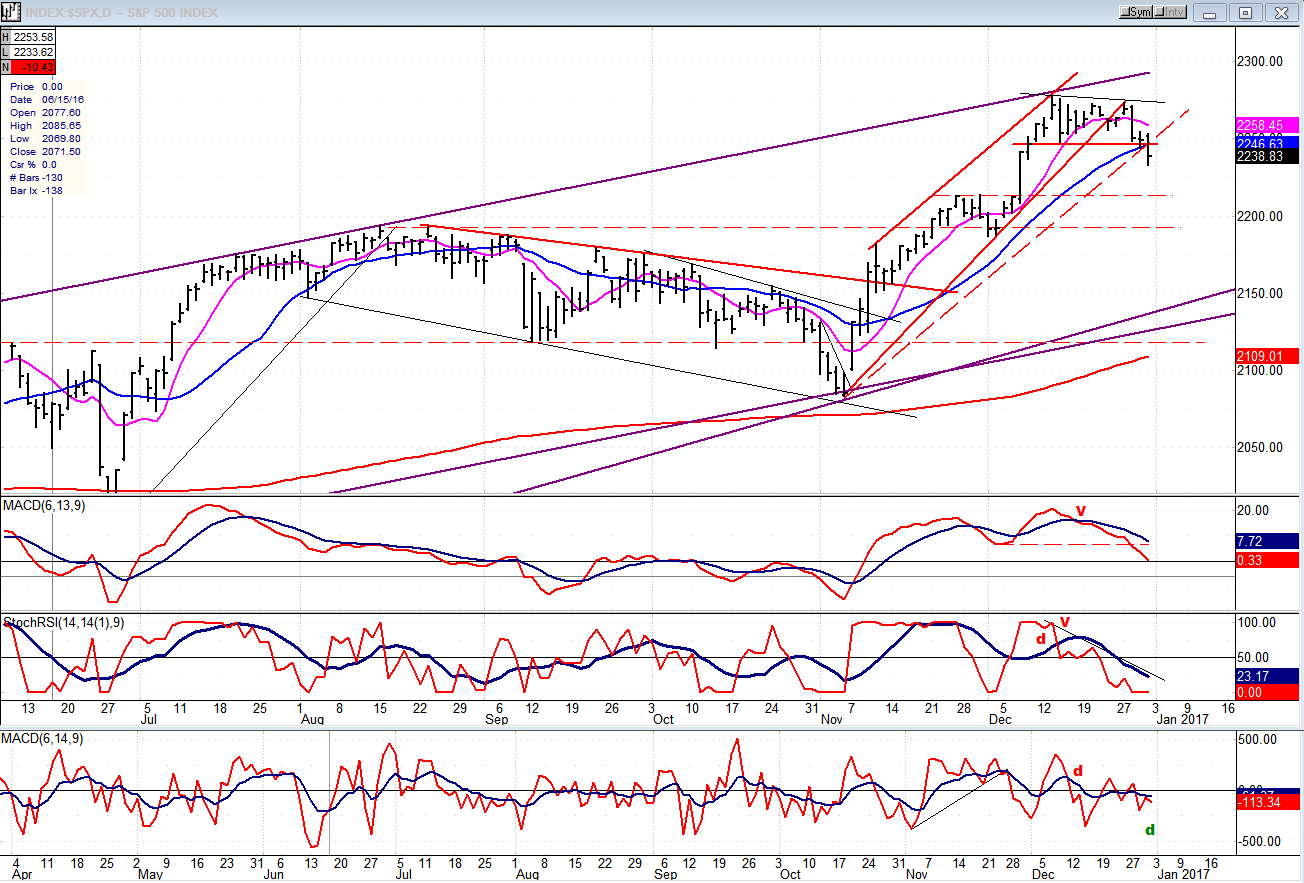
Last week, SPX broke outside of its wedge pattern from 2084. It back-tested the trend line, then moved outside of the channel and below the support line and the 21-day MA. That should be enough apparent weakness to extend its move to the dashed lines and meet its initial target of 2213, but it’s unlikely that it could push much lower without first bouncing back up.
Strong support starts just below 2200 and only when it is penetrated decisively can we expect a deeper correction to take place. The ultimate show or weakness will be when the index breaks the lower trend line of the larger wedge pattern. Incidentally, once completed, wedges tend to be retraced completely all the way down to their starting points; so, if this is truly a wedge pattern, we should expect a retracement down to the 1810 level! That looks like a tall order for now, but not impossible if cycles apply downward pressure into April/May.
The oscillators are mixed. The MACD has broken below is former low but must confirm the progressing weakness by turning negative. The SRSI has been declining for nearly three weeks, and still shows no immediate sign of turning. The A/D has started to hold and showed positive divergence on Friday. The total picture is one of limited selling pressure which must increase if we are to achieve our downside objective by the end of the week.
Hourly Chart
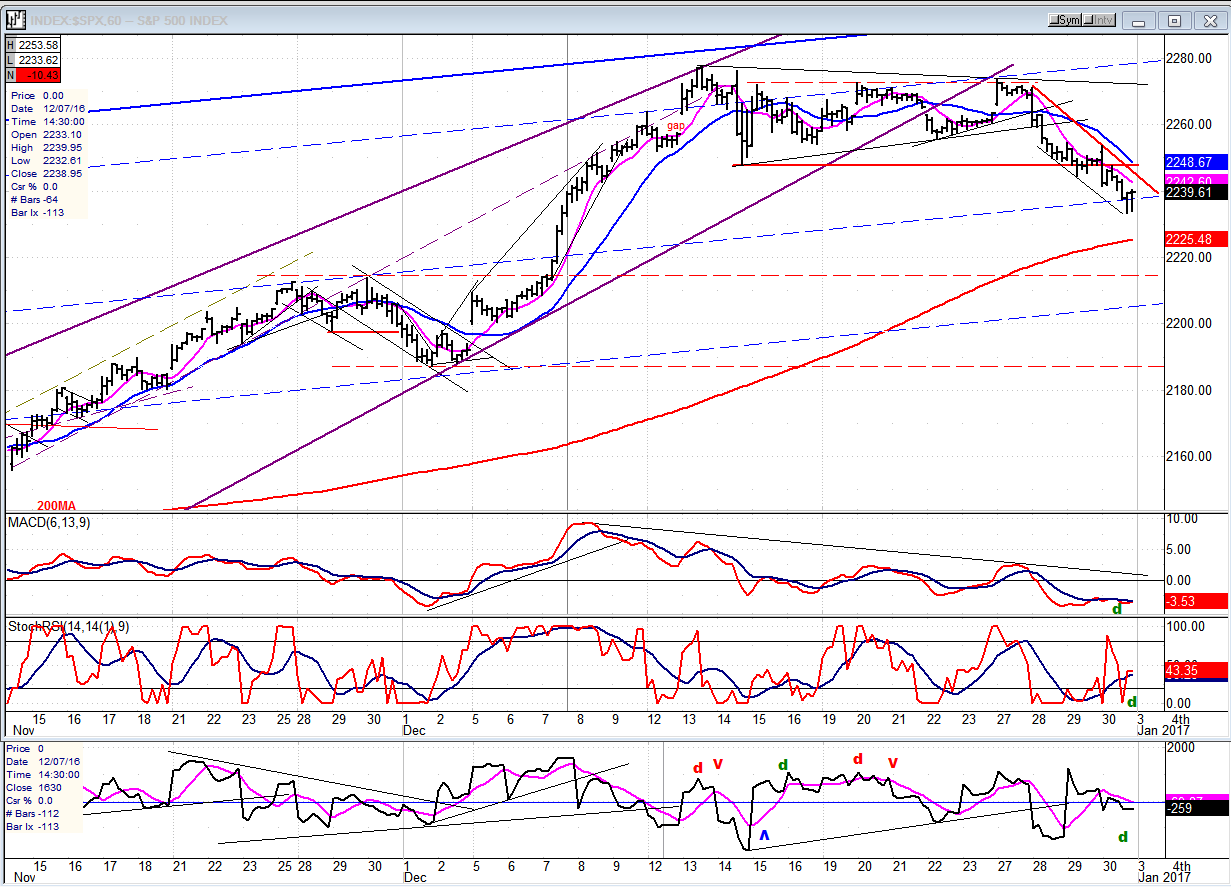
The near-term downtrend is more obvious on this chart. The triangle formation which was discussed last week and which is normally a continuation pattern, did the opposite of what was expected. It could be the first proof that we did complete a wedge, but we’ll need to see continued weakness. Breaking below the 200-hr MA would be another sign that we are on our way to the low 2200s.
However, this is not what the oscillators are forecasting! Every one of them is showing positive divergence and looks ready to turn up, suggesting that we will at least bounce before going lower.
An Overview Of Some Major Indexes (Weekly charts)
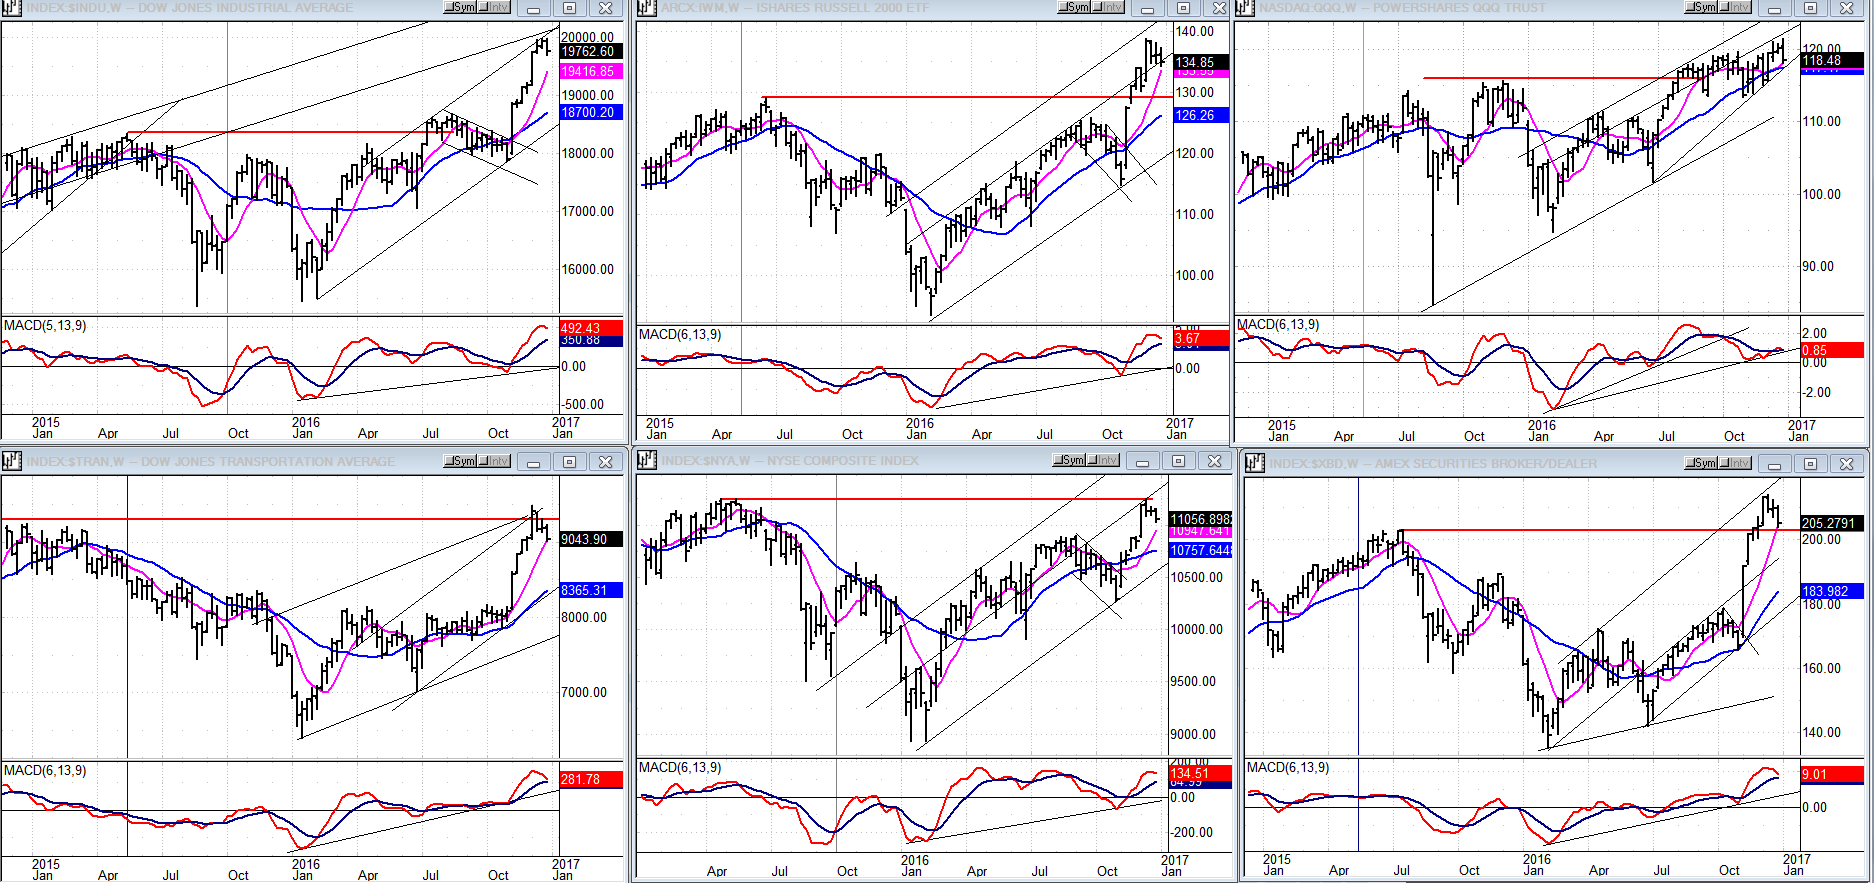
An easy way to analyze the performance of the following indexes is by looking at the behavior of their MACD oscillators. These have been adjusted to a higher degree of volatility and, consequently, to identify their reversals and crossovers more quickly.
This analysis reveals the weakest index to be QQQ (top right) which is hovering just above zero and shows significant negative divergence. That makes it the bearish leader of the pack and if the MACD becomes negative, it will have given a confirmed sell signal. The next weakest is the NYA (bottom, center) although it made a new high, its MACD did not.
Considering that QQQ is one of the best leading indexes, leading the market on the upside until a year ago -- and beginning to lag recently -- we should pay attention! The NYA, which is the major average which includes the most securities, is seemingly confirming the message of the QQQ. let’s take this as a potential warning that the market’s internals may not be as strong as they appear and keep a close watch on their behavior over the next few weeks.
UUP (Dollar ETF)
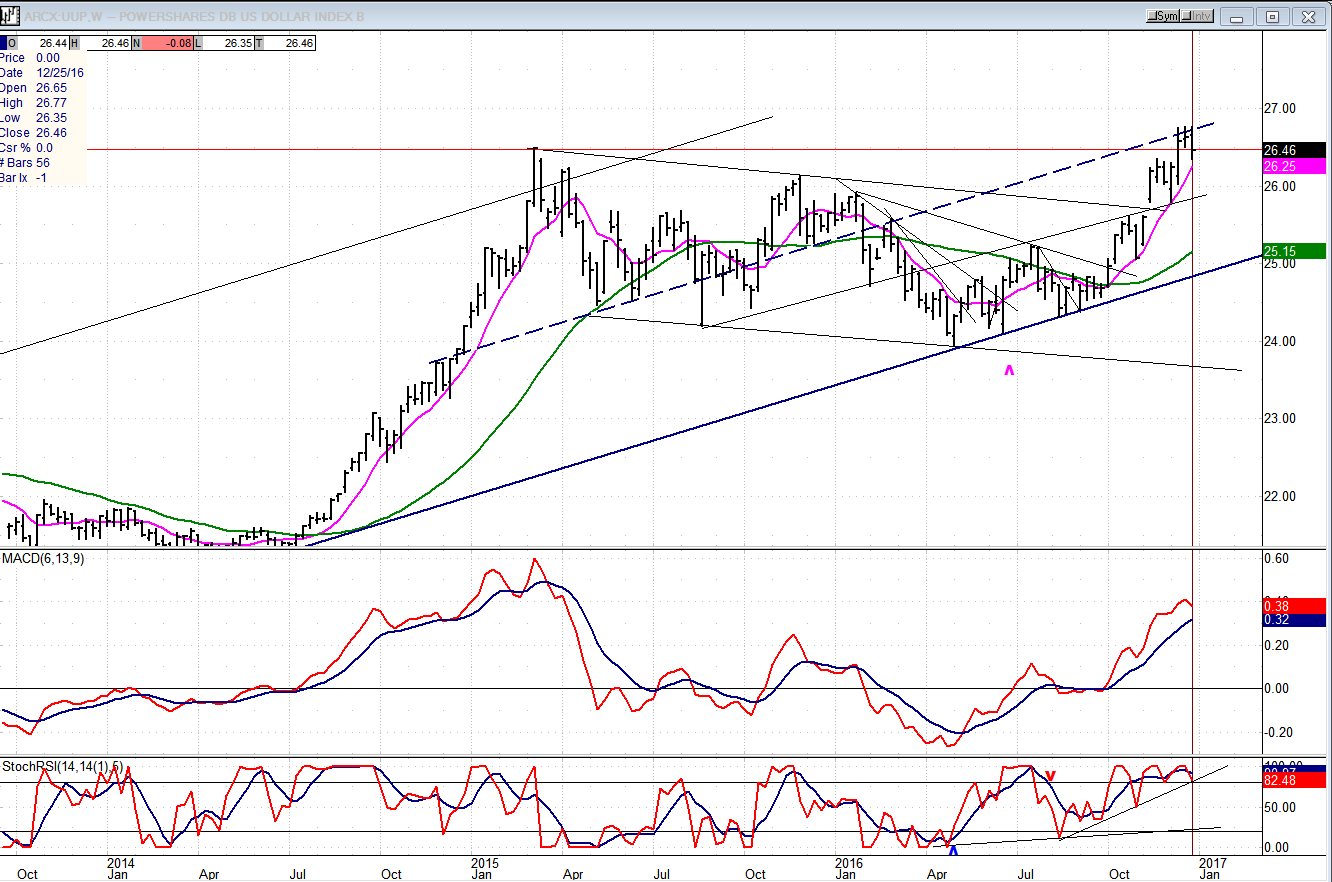
When UUP made a new high, it also reached resistance in the form of an internal parallel (dashed line) which stopped its advance, at least temporarily. There are higher potential counts, but they do not tell us when they will be reached, so let’s see if this pause lasts only a few days, or a few weeks. It could affect the performance of the next index shown below.
GDX (Gold Miners ETF)
In the past few weeks, we discussed the positive divergence which was showing in the oscillators, an indication that a low point might have been reached, but it did not tell us what would follow. Nor did the P&F chart call for anything other than additional consolidation! In fact, this turned out to be an oversold rally which went as far as challenging the top trend line of the corrective channel, where it met with profit-taking and was repelled.
What comes next may depend on the future performance of the dollar. If it starts up again, it will be a restraint on GDX, although the latter should be analyzed on its own technical merits. According to the P&F chart, if GDX can push aggressively through 22.50, it could continue until it reaches 25.50. Even if this happens, it does not mean that it has started a major reversal. Neither GDX, nor GLD appear to have met their full downside potentials, and they may have to re-test their lows successfully to prove that this is the end of the correction.
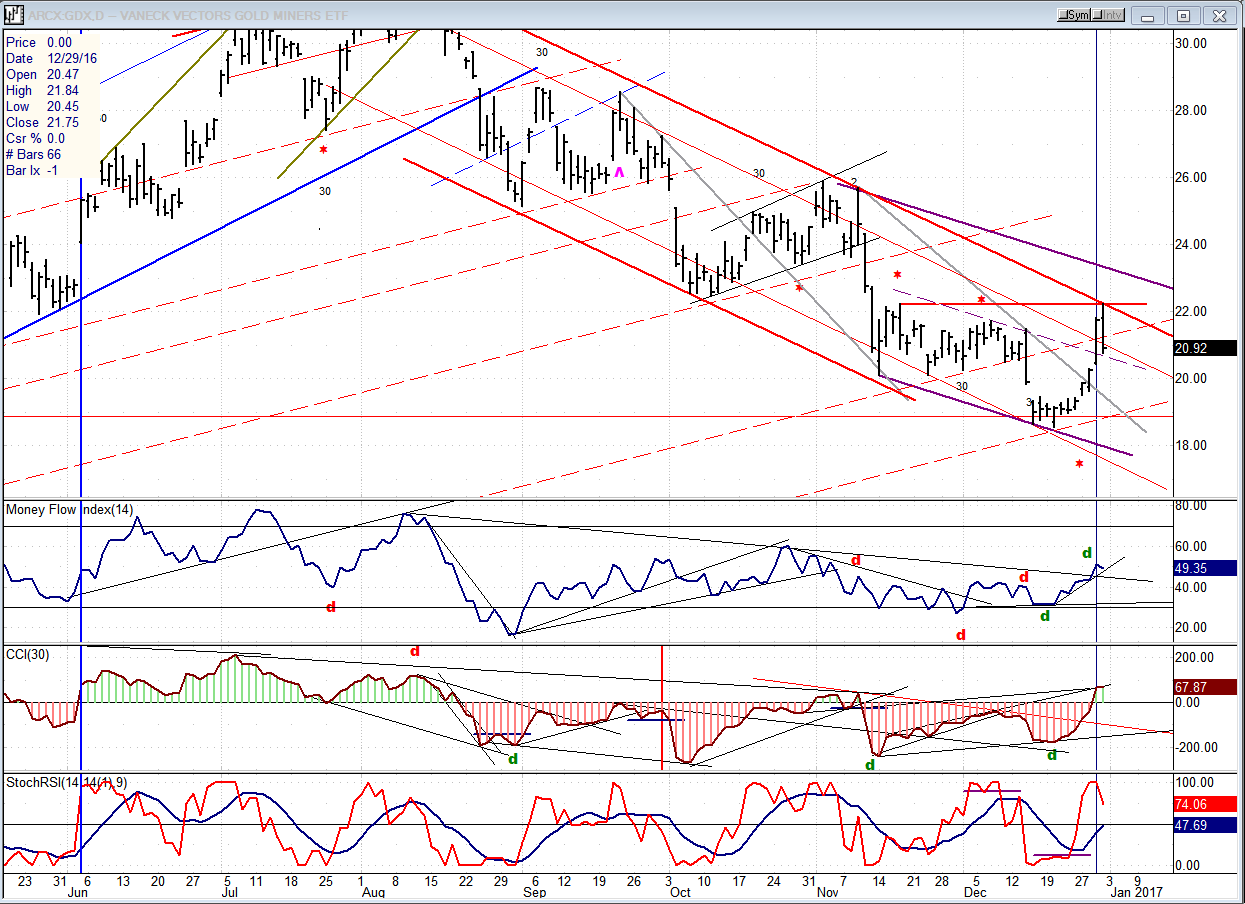
Note: GDX is now updated for subscribers several times throughout the day (along with SPX) on Marketurningpoints.com.
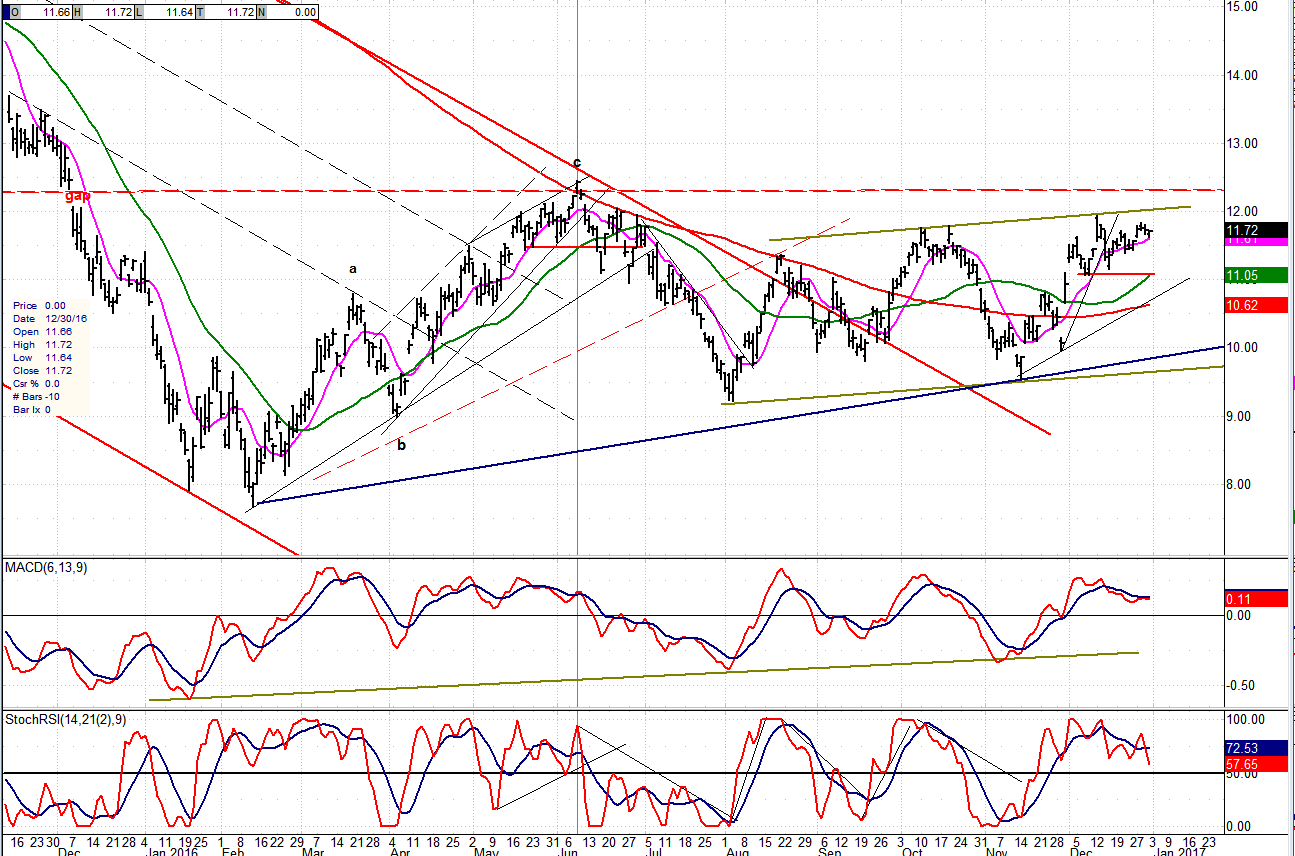
USO (US Oil Fund)
USO has risen to the top of its base pattern, but it must push past 12.50 to start an uptrend which could take it to about 16.00. If it does not do it soon, it will have to retrace to the bottom of the green channel one more time.
Summary
By trading below 2245, SPX may have gone past the consolidation stage and started a correction which could take it initially to the low 2200s.
********
For a FREE 4-week trial, send an email to [email protected], or go to www.marketurningpoints.com and click on “subscribe”. There, you will also find subscription options, payment plans, weekly newsletters, and general information. By clicking on "Free Newsletter" you can get a preview of the latest newsletter which is normally posted on Sunday afternoon (unless it happens to be a 3-day weekend, in which case it could be posted on Monday).
The above comments and those made in the daily updates and the Market Summary about the financial markets are based purely on what I consider to be sound technical analysis principles. They represent my own opinion and are not meant to be construed as trading or investment advice, but are offered as an analytical point f view which might be of interest to those who follow stock market cycles and technical analysis.

When Andre Gratian was a stock broker years ago, a friend introduced him to technical analysis of the market. Consequently, it is not an exaggeration to say that Andre fell in love with this approach! Ever since then, it has become an increasingly important part of his professional life. Gratian has studied the works of Wyckoff, Edwards & Magee, Edward J. Dewey (cycles) and many others. However, one of my most profitable undertaking has probably been to study Point & Figure charting, which he finds invaluable in analyzing stocks and indices. If he were restricted to one methodology, this is the one that he would choose. This well-rounded background has given him what he feels to be a special insight into the stock market, facilitating the recognition of meaningful patterns and the ‘turning points’ in all trends, whether they be short or long term. Andre feels very comfortable discussing the stock market and passing on meaningful information to others. His subscribers include individuals and money managers throughout the world. Moreover, his Newsletters are currently published on several financial sites, here and abroad.


