Trading Gold Price And Silver Price Along With The Pros
 share
share
 share
share
 share
share
 share
share
 share
share
For a number of years the market presence of commercial traders has dictated the direction in the price of gold and silver. With deep pockets and by trading contracts in the futures market without having to back up their contracts with metal, commercial traders acting in concert, can raise the price after a pullback, and cap a rally when their computer trading programs signal that price is ripe for a quick drop.
While no group of traders can change a long-term trend, they can control the short-term trend. We saw a clear example of this in June 2013, when out of nowhere and starting early in the morning, (before US markets opened), someone or a group of people, dumped 12,000 gold contracts (totalling about 1.5 billion dollars of gold), on a thinly traded market in the space of hours. At the same time a large number of silver contracts were dumped as well. It was obvious that no one owned this much physical metal – it was simply a case of sellers of contracts smothering physical demand with ‘paper gold and silver’. No trading system can predict the type of market action we witnessed in June 2013. Nevertheless, by studying the COT reports, we can synchronize our trading with the commercial traders, and reduce our risk of being blindsided.
The challenge facing us, is how to harmonize our trading in line with that of the commercial traders. We do this by studying the COT reports.
(Charts courtesy Stockcharts.com unless indicated).
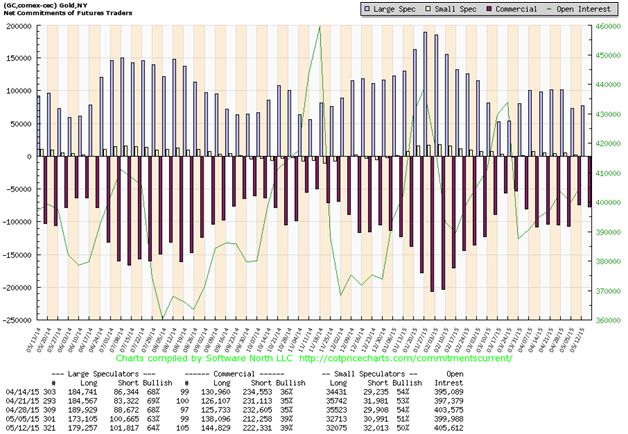
This chart courtesy Cotpricecharts.com shows the current position of commercial gold traders (bullion banks for the most part), to be ‘net short’ (short positions minus long positions) at 78,000 contracts. The COT ‘net short’ total reached a bottom on May 5th at 74,000. We are now looking for the next top, as this is where commercial traders do most of their selling. The last five tops came in at 108K, 206K, 105K, 166K and 146K. The average of the last five is 146,000. At the current level on the chart, commercials are buying. As the price of gold rises, these commercial traders tend to sell into the rally, and if we want to trade along with them, (instead of selling to them at the bottom and buying from them at the top), we need to buy near the bottoms on the chart, in order to sell near the tops. (We offer our analysis on the COT reports in our weekend report for both gold and silver).

Featured is the monthly gold chart with its 22 month moving average (blue line). This moving average has reflected a major influence on trading, as it provided support between 2009 and 2012, while causing resistance between 2013 and 2015. The supporting indicators are showing positive divergence, and the TSI is getting ready to produce its first buy signal since 2009 (green arrow). A breakout at the second blue arrow will signal the confirmation of the next gold bull market, (which appears to have started in December 2014). The purple arrow shows a breakdown at the moving average which signaled a coming drop in price.
Featured is the monthly chart for GDX, the gold and silver producers ETF. The blue line represents the 20 month moving average. Since Dec 2011, when price broke down below it, this MA has kept price in check. A monthly close above the blue arrow is likely to break that stranglehold. The supporting indicators have been showing positive divergence for quite a while, against the purple arrow. The TSI issued a buy signal in mid-2014 that has been confirmed in January of 2015 (green arrows). Ideally the breakout at 22.13 will wait until after the June lows - although the breakout could come at any time, and the testing of the breakout would be part of the June dip. (Gold and mining stocks usually produce a bottom in June). In any event this coming breakout could mark the beginning of a multi-year rise in price.
Featured is the monthly chart for GDXJ, the junior producers and explorers, and here also we notice the dominant 20 month moving average and its influence on price. The supporting indicators are showing positive divergence and the TSI, after giving a premature buy signal in mid-2014, is preparing to deliver a new buy signal shortly (green arrows). A breakout at the blue arrow is expected to mark the start of the next leg up which is likely to last several years.
Featured is the monthly silver chart with its 22 month moving average. This moving average has provided support between 2009 and 2011, while causing resistance between 2012 and 2015. The TSI is getting ready to issue its first buy signal since 2009 (green arrows). The supporting indicators are showing positive divergence with price. A breakout at the blue arrow will likely mark the start of the next silver bull market.
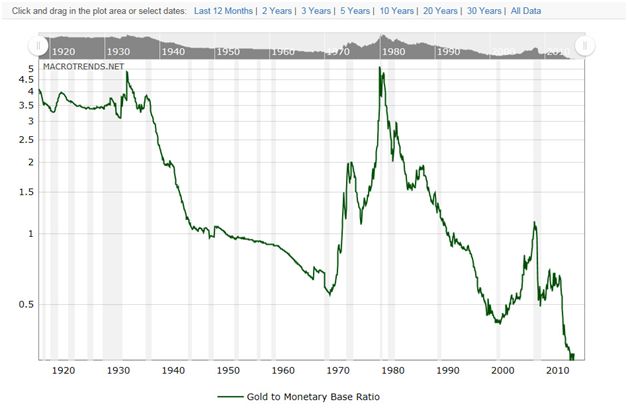
This chart courtesy www.macrotrends.net (a useful website for chart lovers), shows the ratio between Gold and the US Monetary base. It shows gold to be the least expensive in over 100 years! The time to buy gold is when this ratio is below 1.0, and sell gold when it is above 3.0 (as in 1980).
********
Peter Degraaf has been a successful investor for over 50 years. He publishes a daily market letter for his many subscribers. For a sample copy visit his website www.pdegraaf.com or send an Email to [email protected]
Disclaimer: Please do your own due diligence. Peter Degraaf is not responsible for your trading decisions.
share
share
share
share
share
 Peter Degraaf became interested in silver and gold when the Governments of the US and Canada proceeded to remove silver coinage from circulation in the mid 1960s.
He noticed the effect of Gresham’s law: “Bad money drives out good.” He became a coin dealer, attending coin shows all over The US and Canada. In 2001 he semi-retired from coin sales and concentrated on investing in precious metals. He mastered the art of technical analysis and applies this to his investments. In 2001 he started publishing a daily and weekly market report. His website is at http://www.pdegraaf.com/.


