Pivots Almost In Place


Perhaps the time has come to shake off the summer doldrums…and for the markets to stop acting in the strange fashion (as discussed last week). Some initial signs from last week are that markets are in a transition to become ‘normal’ – or as normal as markets can be. Two markets showing such promise are gold and silver, where the attempts to shake loose the longs failed to achieve desirable results. The gold longs that ran for cover were fewer than what it would have been a year ago; that this is so contrary to massive Open Interest could not have been expected. This behaviour is promising a return of the 2016 bull market. On the other hand, putting my head on the block by calling an-all time high on the S&P500 was a risk that I thought to be reasonable and – at least so far – my neck is safe!
It is election year…and the fight is different from previous campaigns. To be sure there is more dirty washing being hung out to view. That may explain the signs of such extraordinary intervention in some US markets – the unexpected strength of Wall Street, the US dollar and the Treasury market. No stone is left unturned to keep the Democrats in the White House. If the call for a top in the S&P500 holds to begin a bear trend, that would make life even more difficult for the Administration than publication of more hacked emails.
This will probably be a week of wait and see…that is to say whether the early signs of markets in transition will be prophetic. By Friday we should have a good idea whether gold and silver have resumed their 2016 bull market - and whether Wall Street is holding to its recently announced top in the S&P500. But perhaps most of all, whether Friday’s steep collapse of the dollar is going to extend lower or not. Very interesting times!
Euro-Dollar
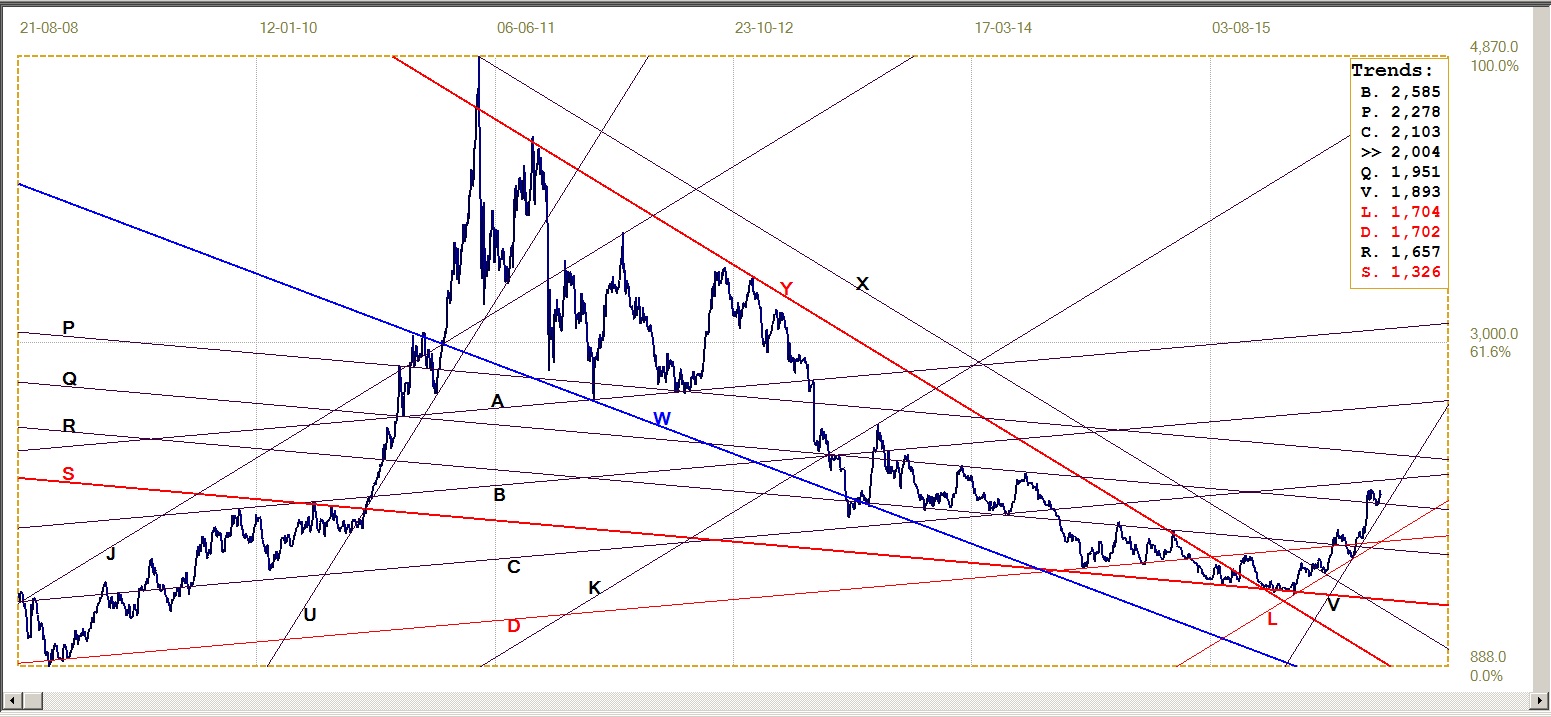
The euro has held at and then rebounded from the tentative support line that was added to the analysis after the euro had broken below the initial steep bull channel. That support, at line L ($1.0974), is now not at risk, following dollar weakness late last week.
On the other hand, the euro has run into resistance at line V ($1.1160) at the top of the steep bear channel UV. The range between resistance at lines V and support at line L is narrowing quite rapidly and we should know by the end of this week in which direction the break is to happen.
The rebound higher off line L and a possible recovery back above bear channel UV (which was at $1.1191 last week) would signal a significant change in the fortunes of the dollar – much in line with the discussion earlier that markets are in a period of transition. A break higher would be part confirmation of the tentative conclusion.
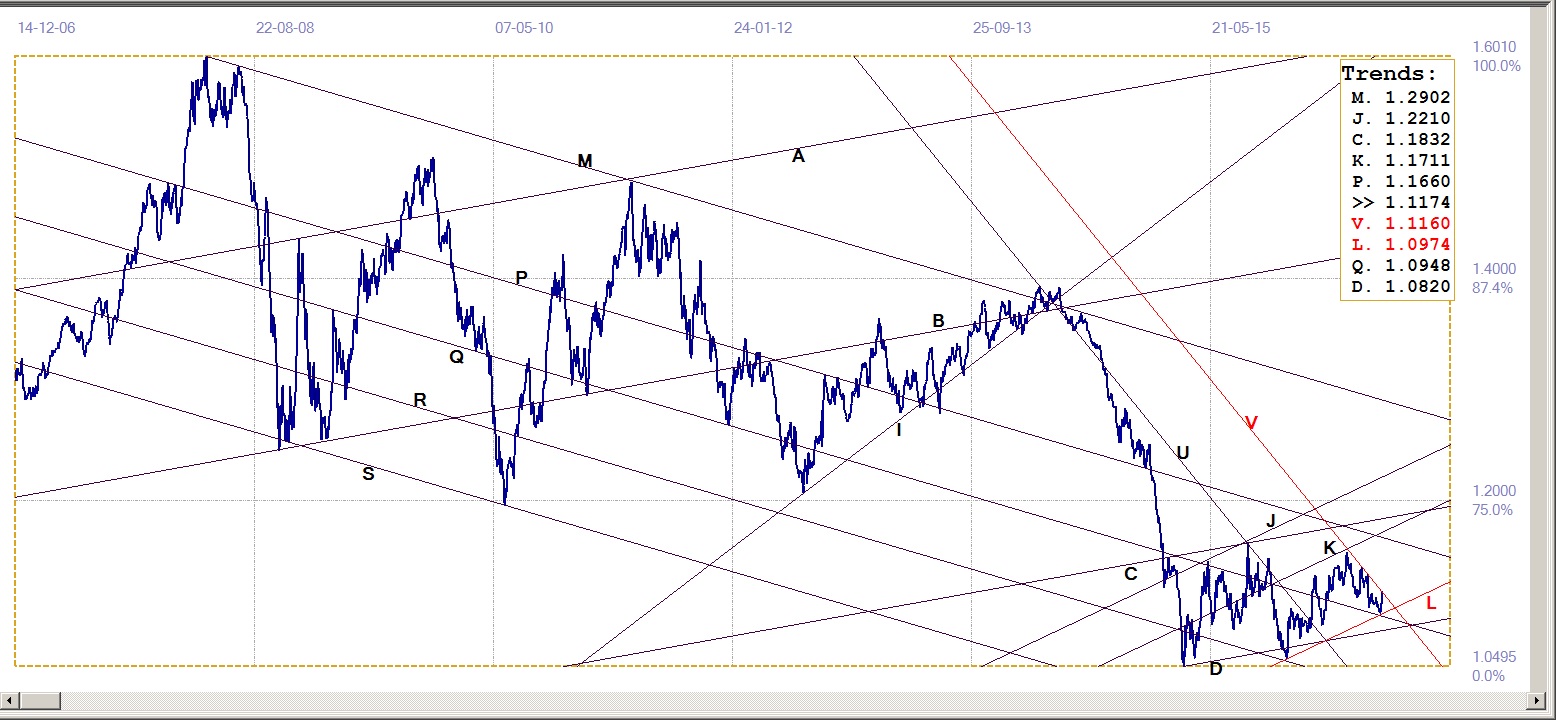
Euro-dollar, last = $1.1174 (www.investing.com )
Dow Jones Industrial Average (DJIA)
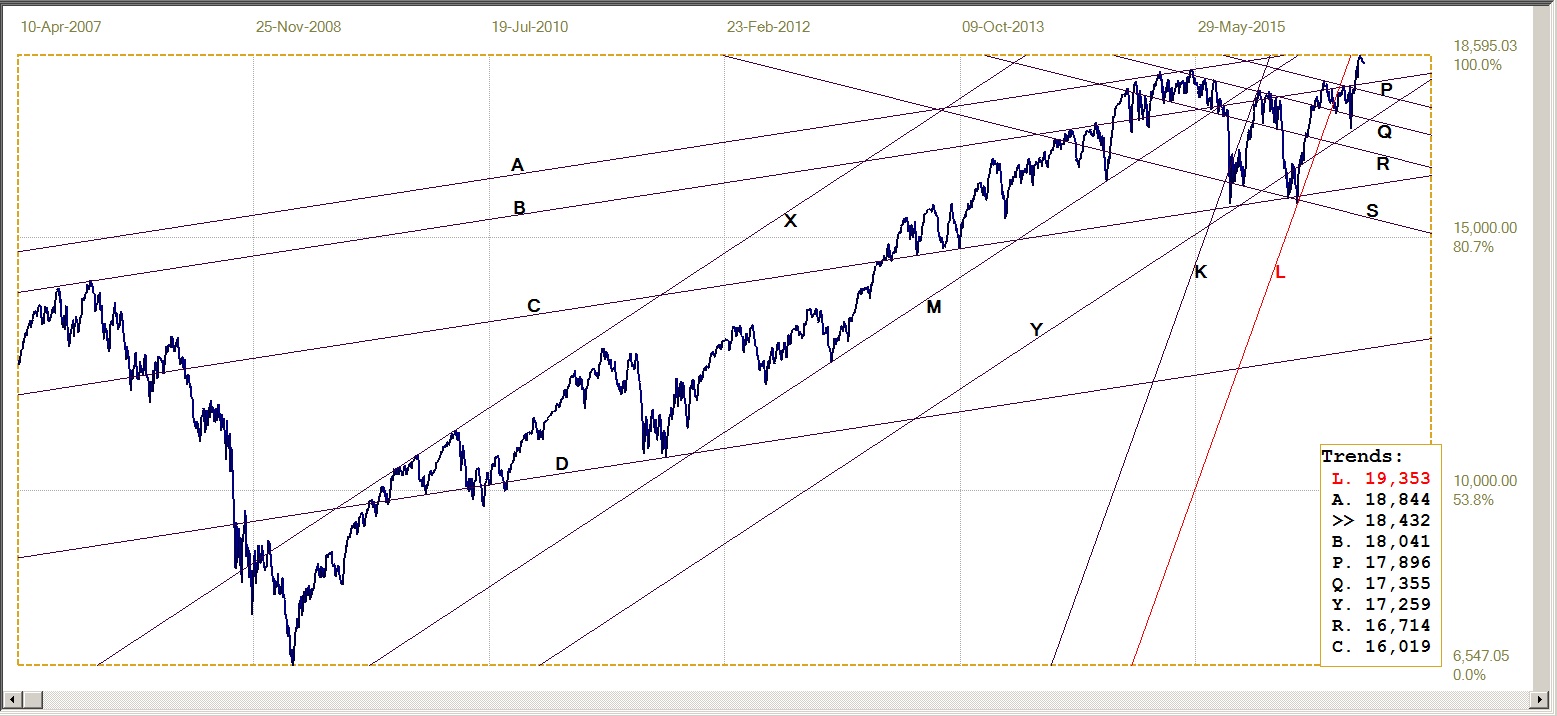
Dow Jones Industrial Index, last = 18432 (money.cnn.com)
The DJIA retreated slightly off the all time high of the previous week – not nearly enough to signify a change in the bull trend, merely a small correction. However, even a major bear market can begin with ‘merely a small correction’ if the time is right! Technically, in terms of this analysis, the DJIA has not met and reversed off resistance at one of the resistance lines. Nevertheless, given that the SP500 had an equally small correction this week, off its own all time high at significant resistance – as shown in a separate report last week – it is possible that the DJIA is reacting to the broader market sentiment as expressed in the S&P500.
This week should provide some further insight into the future of Wall Street – both in terms of the DJIA and the SP500. If the bearishness continue, this would make the technically founded assumption that the equities market has topped out more credible and an opportunity to short, with a tight stop loss.
Gold PM Fix - Dollars
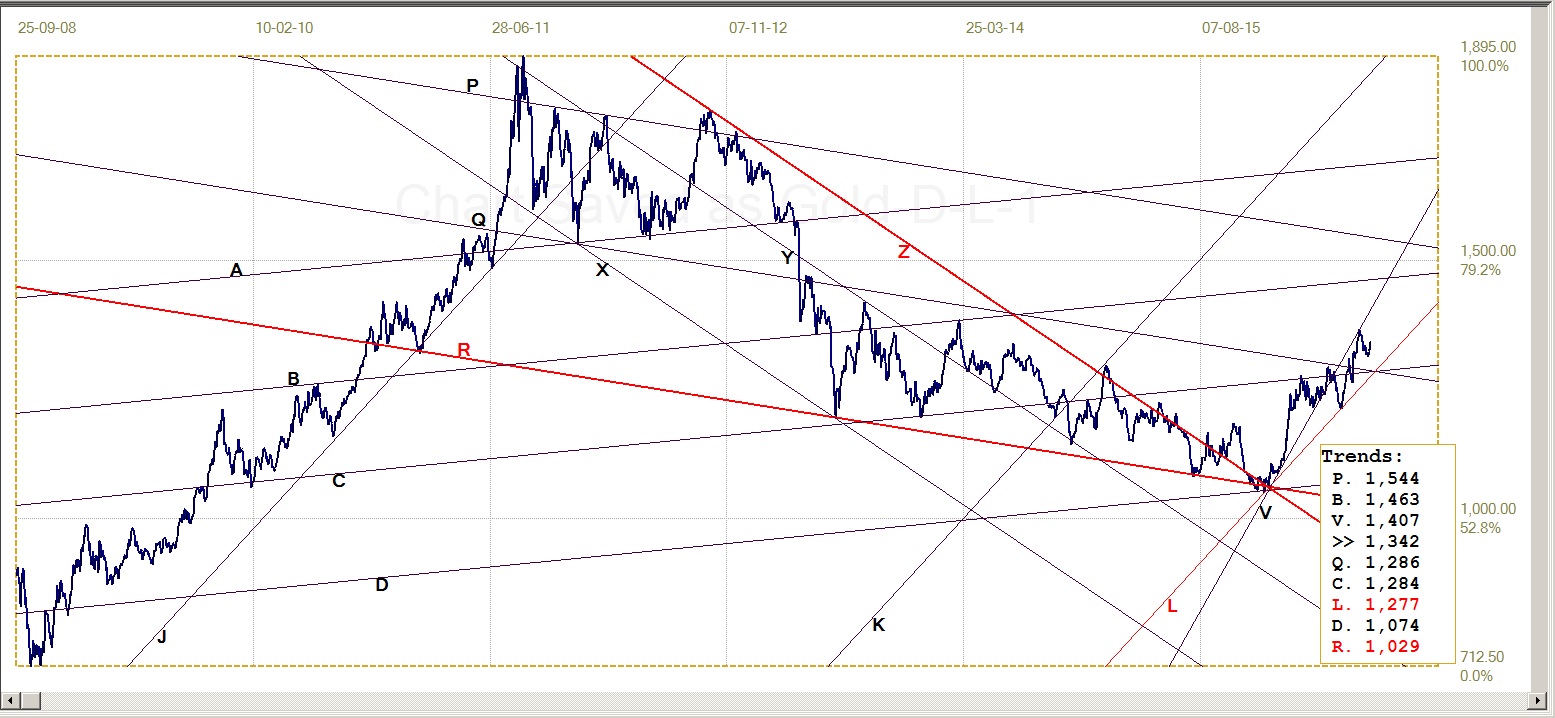
Gold price – London PM Fix, last = $1342.00 (www.kitco.com )
The break below the initial steeper bull channel of which line V ($1407) is the lower boundary, the new lower bull channel, KL ($1277) took over as main bull channel. The rebound off line L showed the new channel to be effective, following which the gold price broke above resistance at lines C ($1284) and Q ($1286), to confirm the rebound. The rally off line L continued to reach and test resistance at line V, but failed to break higher.
That was when both gold and silver came under intense attack again, with changes late last week showing that the bull could be back after option expiration and FND. It was no surprise to see an attack happening and no surprise to see a new bull.
Gold PM Fix – Euro-gold
Two weeks ago, when the attack on the precious metals prior to option expiration started, the euro price of gold pulled back from its recent higher to end right at the support of line R (€1204). Last week, a mostly steady if lower gold price was offset by a weaker euro so that the euro price of gold fluctuated closely around that line of support, dipping only briefly and a little below it at times.
Now gold and the euro are both improving – with Friday’s price still slightly below the key support – and gold has to rally more than the euro for the rising trend to resume. Whether this will happen, also should be known this week.
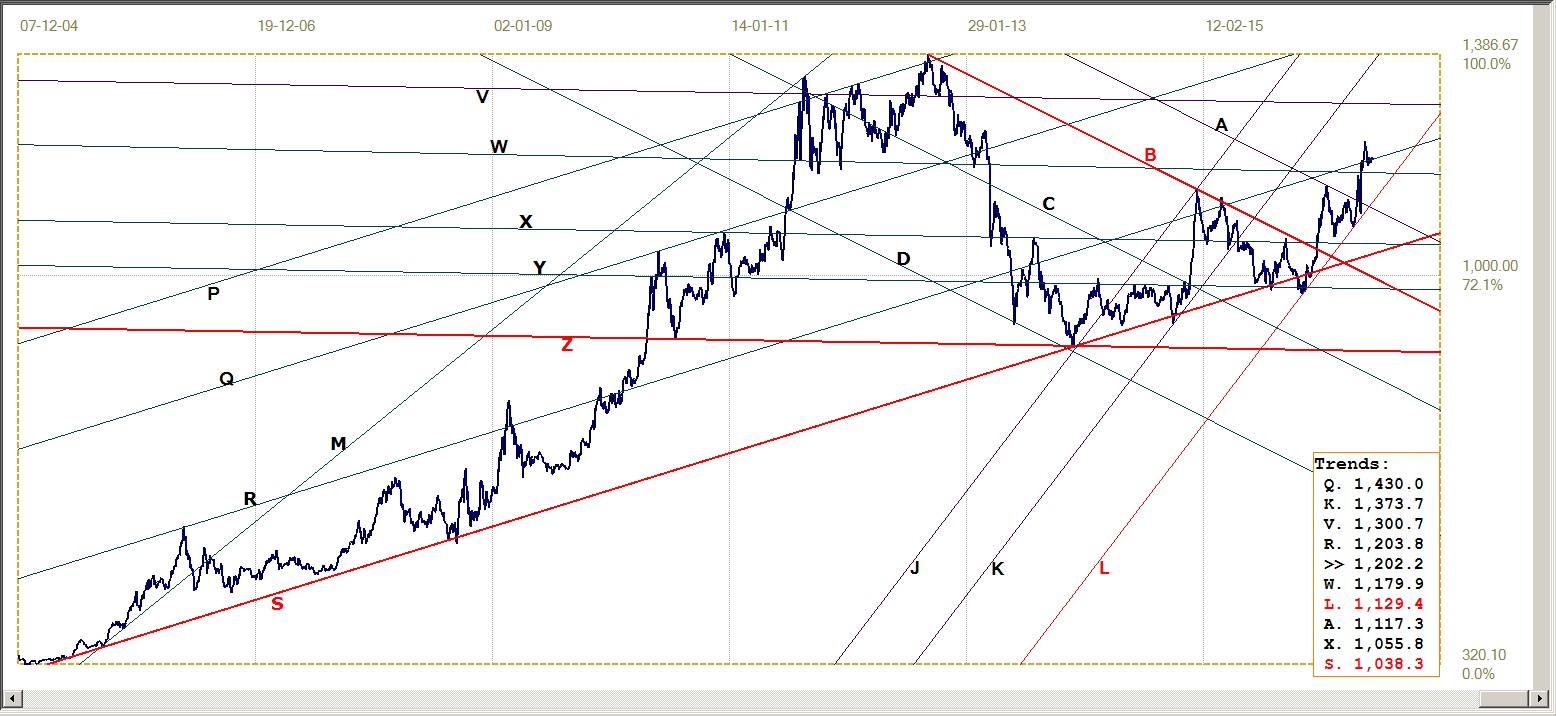
Euro gold price – PM Fix in Euro, last = €1202.2 (www.kitco.com)
Silver Daily Fix Chart
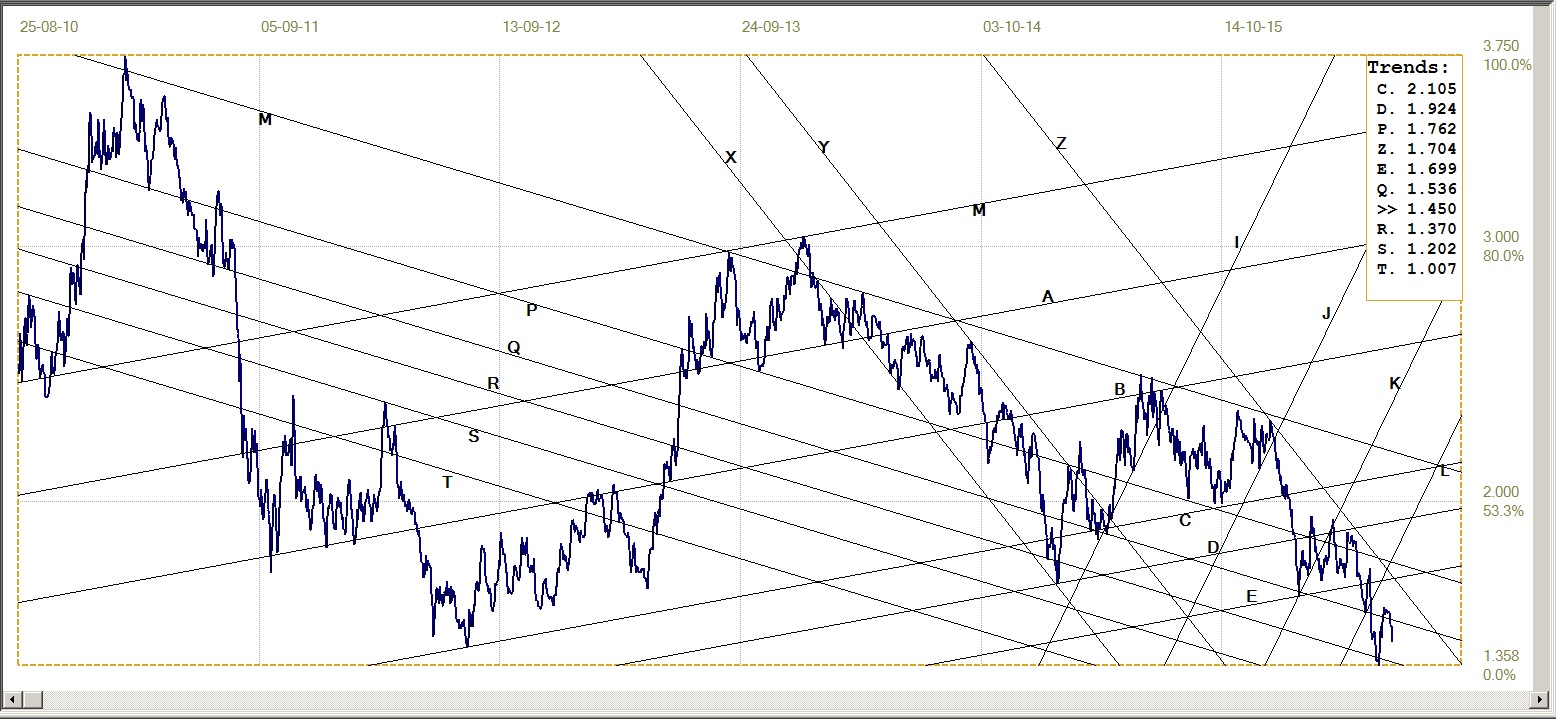
Last week, silver performed much better than gold by still holding near the previous support at line Q ($19.51). Even of greater importance is that, while silver also recently broke below its initial steep bull channel – of which line V ($18.93) was the lower boundary – it has recovered back into the steep bull channel. Silver too, just like gold, held steady at the shallower bull channel after the break below the steep bull channel, but its recovery is more convincing.
It now remains to be seen whether a new rally, as expected after option expiration and FND, can manage to break above the resistance at line C ($21.03) or whether a more sideways trend to test support at line V again is on the cards.
Silver daily fix, last = $20.04 (www.kitco.com )
U.S. 10-Year Treasury Note
U.S. 10-Year Treasury note, last = 1.450% (www.investing.com )
After a minor and brief break below line R (1.370) to set a new bullish all time low for the yield on the 10-year Treasury, it rebounded steeply higher to break above market support at line Q (1.536%) – important support over the long term – and expected to herald a new bear trend. The Brexit panic was presumed to be over and normal markets could resume.
However, the yield did not extend much further, but settled in a sideways knot. It then reversed direction and broke as steeply below the resistance at line Q as the previous rally. With Wall Street still holding around its all time high last week, this rally was not a panic flight out of equities into Treasuries, but must have another cause – perhaps that all is not the plain sailing after Brexit, that the authorities - financial and political – want us to believe? This week might be still to early for any hard news of trouble brewing in the wake of Brexit, or in anticipation of some other event.
West Texas Intermediate Crude. Daily Close
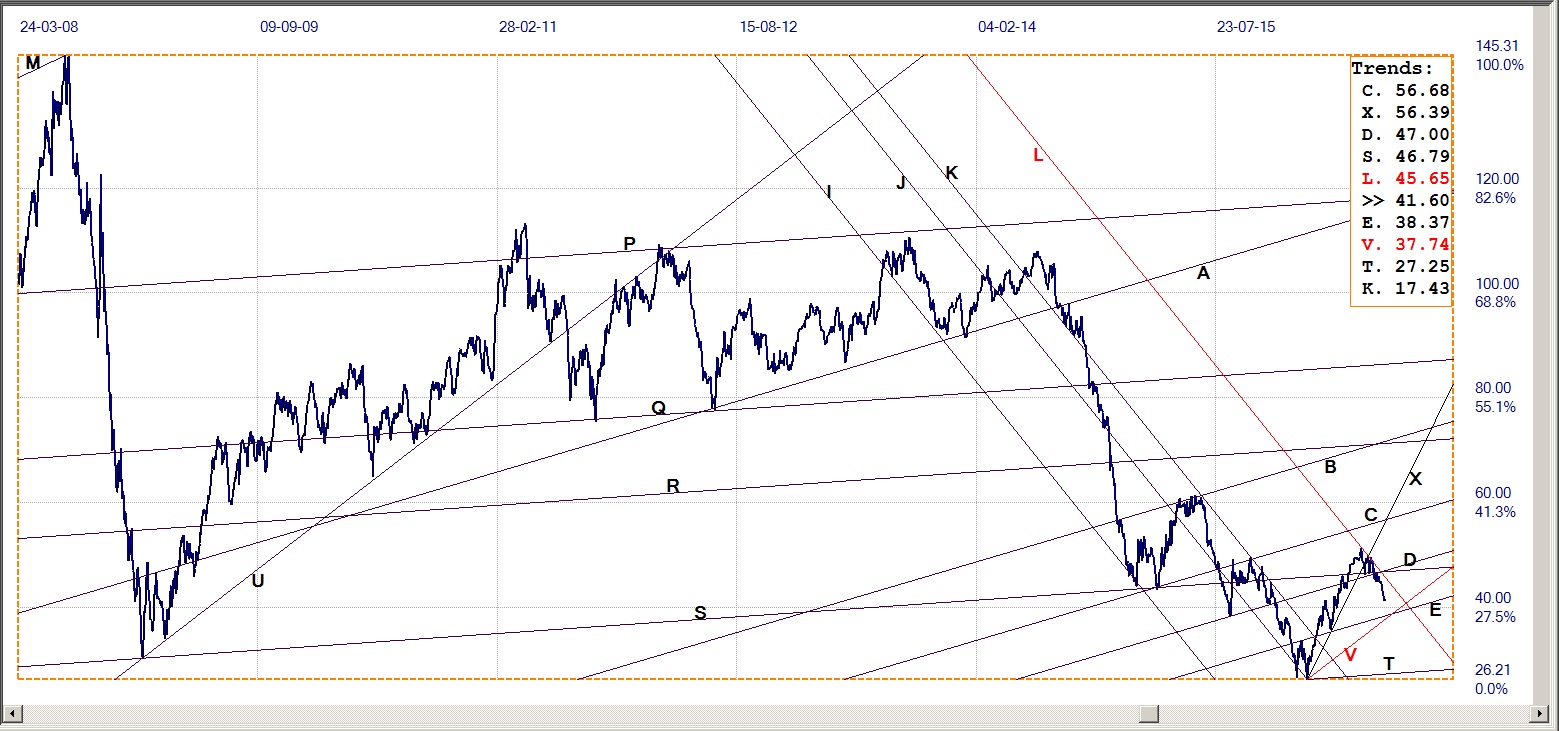
WTI Crude – Daily Close, last = $41.60
With the psychologically important $50 level – and very important for shale drillers as well as the banks to which they owe billions – now history, the price of crude is slipping lower bit by bit. It briefly held just above support at lines S ($46.79) and D ($47.00), then broke lower to become more bearish. Holding sideways for a while, the price then slipped lower again to move clear of the previous support. Similar to what was done when gold and silver broke below their steep bull channels – at line X (56.39) – line V is now the bottom boundary of a shallower bull channel that may act as support for the new bear trend. Line E ($38.37) is also possible support.
With signs that the global economy – perhaps outside of China – is steadily cooling off, demand for oil still has to contend with increasing supply from Iran and other producers that have experienced problems and are slowly recovering their output. It now remains to be seen whether the technical support at lines E or V can hold or whether the bear is still in place – bringing bad news to oil producers, exploiters of shale oil and the banks that have funded the latter.
©2016 daan joubert, Rights Reserved
chartsym (at) gmail(dot)com


