Gold Meme’d Gets Bean’d!


Gold — in having the prior week been “meme’d” — this past week got “bean’d”. And anticipatedly so, for as you by now well know, Gold had gotten — and indeed still is — “ahead of itself”, a phrase familiar to those readers of The Gold Update who’ve been with us when first coined it some 14 years ago.
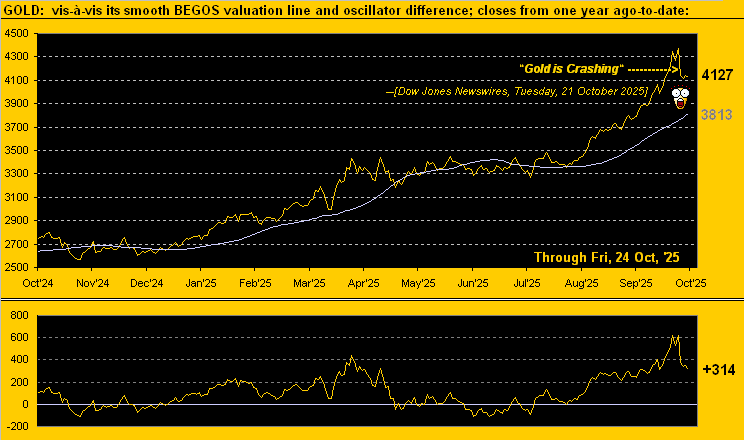
On the heels of last week’s piece “Gold Goes Meme!” wherein price had traded to as high as 4392, this past week saw a scant six points of further upside on Monday to the now latest All-Time High of 4398 before getting “bean’d” and falling -377 points (-8.6%) to Wednesday’s low of 4021. As noted Tuesday on “X” (@deMeadvillePro), Gold’s intra-day fall of a full -300 points was far and away its worst same-day points-loss in history. Silver also that day suffered her historically seventh-worst intra-day points loss of -4.50.
It happens. Certainly so when suddenly — to again reprise — “…everyone’s become a Gold expert…” (Recall the urban legend of JFK’s pop “Jumpin’ Joe” knowing ’twas time to sell back in ’29 when the shoeshine boy began giving him stock tips).
“But you’re no Kennedy, mmb…”
Squire can’t resist the infamous, historical dig. But Gold in recent weeks reached that silly state of investor euphoria: “Well, the Big Banks are loadin’ up, ya know…” Gold last crossed above our BEGOS Markets’ smooth valuation line back on 20 August (price then 3392). Since just that date, the herd has taken Gold up to last Monday’s record high of 4398. ‘Twas an increase for Gold of +1,006 points (+29.7%) in just 43 trading days! (Imagine having been Long 100 Gold contracts [margin requirement $1,650,000] for a trading profit of $10,060,000 [+610% account gain] in only two months; pretty good juju, that!)
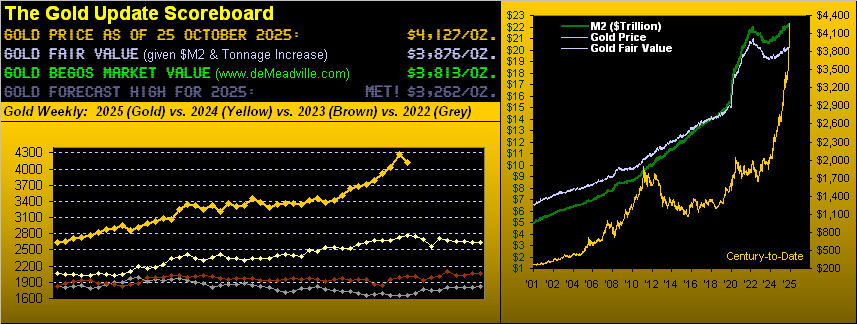
Nonetheless, as herein depicted three weeks ago, Gold en route has well surpassed its Fair Value (now 3875 per the opening Scoreboard). Thus justifiably “ahead of itself” indeed is our Gold, settling out this most recent week yesterday (Friday) at 4127, which is +252 points above that Fair Value. Moreover, Gold is now +314 points above its smooth valuation line as we below see, wherein Gold’s movements are valued relative to those of the five primary BEGOS Markets (Bond / Euro / Gold / Oil / S&P 500). Note therein Dow Jones Newswires’ Tuesday assessment of the (by then) -6.9% correction being a “crash”:
“So, mmb, where does price go from here?”
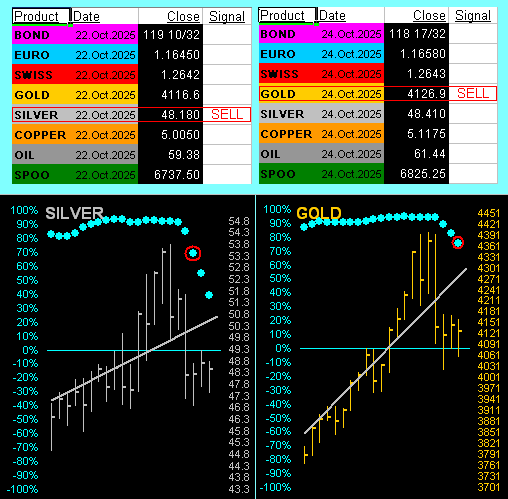
Likely lower still for both precious metals, Squire, at least within the vacuum of our linear regression calculus. A function of the night work is our internal table of BEGOS Markets’ “Baby Blues” signals which alert us to potential change in near-term trend as consistency thereto begins to break apart. The table at left is per Wednesday’s close confirming a “SELL” for Silver. This is because her “Baby Blues” in the one-month chart beneath the table fell below the key +80% axis per the red encircled dot. Then come Friday at right so, too, was confirmed a “SELL” for Gold. To be sure, both metals’ trends remain positive by their respective grey diagonal lines, but less steeply so. And as the trading herd later begins to figure that out, we “ought” see still lower prices:
“But how about some actual numbers, mmb…”
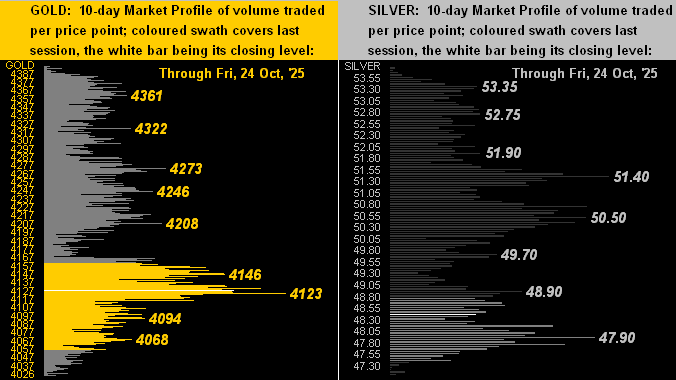
Squire, let’s initially acknowledge per the above pair of charts that price for the present has ceased falling; rather, ’tis for the moment consolidating per the rightmost three bars for both metals. But assuming the “Baby Blues” continue to descend, the recent price declines likely are not at an end. Let’s first consider the aforeshown chart of Gold’s BEGOS Market Value. Should Gold (4127) work lower as value (3813) works higher, a back-of-the-napkin jot finds the mid-point at 3970. Such breaching below the 4000 milestone could then encourage buying. As for Silver (48.41) — whilst broadly she remains very attractively priced relative to Gold — the Gold/Silver ratio average across the past 21 trading days is 83.3x. Thus priced to that average, Gold at 3970 would place Silver at 47.66.
So hardly any substantive downside damage there. However, should the correction distance be further down, we came up with a few retracement levels, courtesy of our old mate Leonardo “Fibonacci” Bonacci basis Gold’s last consolidation area which spanned from April through August. We’ve thus three paired Gold/Silver downside ideas: 3985/47.84 … 3857/46.30 … 3729/44.77 … just in case you’re scoring at home.
Rather, if Gold instead merely zooms higher from here, that’s fine. Just be wary (again) “Gold has gotten ahead of itself”, each ounce willingly bought being an ounce willingly sold.
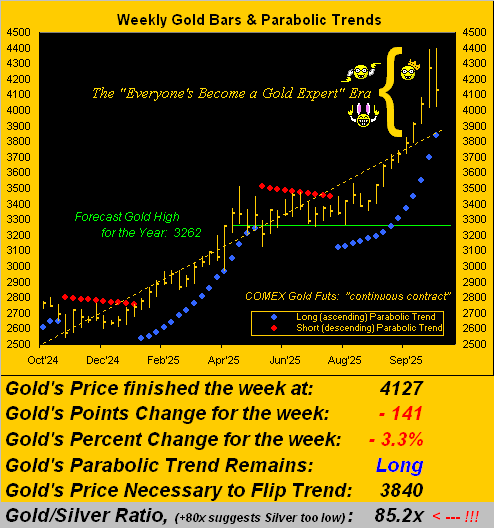
For 2025, 43 trading weeks are now complete. Therein, Gold has compiled 31 up weeks (+2.2% average gain) and 12 down weeks (-1.9% average loss). Indeed, 11 of the past 13 weeks have been up. Year-to-date, Gold is now +56.4%, still bettered by Silver +65.3%. And as we go to Gold’s weekly bars from a year ago-to-date, the aforementioned “consolidation area” appears relatively contained mid-chart by the red-dotted parabolic Short trend, during which stint price didn’t materially drop a wit. As for the ongoing blue-dotted parabolic Long trend (now 14 weeks in duration), note the “flip-to-Short” (bad idea) level for the ensuing week is 3840, some -287 points south of here (4127). So given Gold’s “expected weekly trading range” is now 165 points, a second consecutive down week ought not thwart the Long trend:
Now to the 10-day Market Profiles for Gold on the left and for Silver on the right. Not surprisingly, price is well-down in both cases, Gold notably just a few points above its most volume-dominant supporter of 4123. As for Sister Silver, she looks safe down to her denoted 47.90 level … but should Gold fold, Sister Silver too shall further her downside mode:
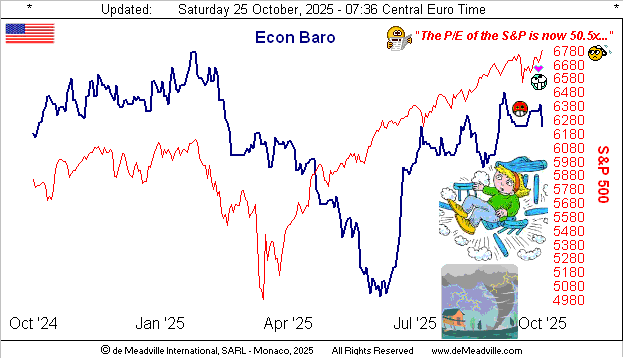
Meanwhile, the Economic Barometer remains unfulfilled: 39 metrics are to have been received since the start of the StateSide government “shutdown” effective 01 October. But with 26 thus far missing, just 13 have been received — including a surprise on Friday: September’s Consumer Price Index was issued; (more on that in the wrap). Otherwise, amongst all 13 of the incoming metrics, just five improved period-over-period. Lookin’ a bit rickety, our Baro, as we ever-anticipate for stocks  “Stormy Weather” –[Arlen/Koehler, ’33]. And yes, Virginia, if you actually perform the math (a science apparently unemployed by the modern-day money manager), the price/earnings ratio of the S&P 500 settled yesterday at 50.5x, (which for you WestPalmBeachers down there means portfolio theory is a thing of the past):
So as teased, we wrap with yesterday’s surprise release of the CPI, (both the headline and core readings a bit hot for the Fed’s liking). But our immediate response was: “Did the ‘shutdown’ just end?” Quickly we checked … but … no. Yet, after all, the CPI like so many Econ Baro metrics is released by a federal government agency, in this case the Bureau of Labor Statistics, which did not first report the scheduled Producer Price Index.
But then we found out what happened with respect to the CPI: in order for the Social Security Administration (which is not fully “shutdown”) to keep benefit check payouts in pace with inflation, “They gotta have that CPI, baby!” We thus give a tip of the cap to whoever he/she/it was that snuck into the otherwise shuttered BLS — perhaps heroically in the wee hours on personal time — to gather, crunch, arrange and release the data. ‘Tis most appreciated and deserving of a year-end bonus.

As to a potentially negative near-term course for Gold, appreciate what ’tis, indeed add to your load!
Cheers!
…m…
www.TheGoldUpdate.com
www.deMeadville.com
and now on “X”: @deMeadvillePro
********

Mark Mead Baillie has had an extensive business career beginning in banking and financial services for two years with Banque Nationale de Paris to corporate research for three years at Barclays Bank and then for six years as an analyst and corporate lender with Société Générale.
For the last 22 years he has expanded his financial expertise by creating his own financial services company, de Meadville International, which comprehensively follows his BEGOS complex of markets (Bond/Euro/Gold/Oil/S&P) and the trading of the futures therein. He is recognized within the financial community of demonstrating creative technical skills that surpass industry standards toward making highly informed market assessments and his work is featured in Merrill Lynch Wealth Management client presentations. He has adapted such skills into becoming the popular author each week of the prolific “The Gold Update” and is known in the financial website community as “mmb” and “deMeadville”.
Mr. Baillie holds a BS in Business from the University of Southern California and an MBA in Finance from Golden Gate University.


