Bear Market Foot Prints In US Equities


 There are today several indisputable Bear Market Foot Prints in the US stock markets. Indeed they were telltale barometers in forecasting the stocks Crash in 2001-2003 and again in 2007-2008. Unfortunately, these same Bear Market Foot Prints are again visible…and are strongly suggesting Stock Bears will run amok in Wall Street. Specifically, these Bear Market Foot Prints are:
- Transportation Index
- Prominent Stock Leaders (Yahoo, WMT, CAT, AAPL, BAC, CS and LNKD)
- DOW/US Bonds With Bearish Triple Top
- DOW Index with Full Stochastics Indicator
- S&P500 with Full Stochastics Indicator
- NASDAQ Composite Index With Bearish Double Top
- New York Stock Exchange Index
- Number of NYSE Stocks above their 200-day Moving average
- Raw Materials And Natural Resources
- NYSE Margin Debt
Here below you will find a detailed description of each Bear Market Foot Print…and why each is foreseeing materially lower US stock values in 2016…and possibly well into next year. Indeed the imminent Stock Market Crash may even surpass the damage reaped in the 2001-2003 stock rout and the 2007-2008 debacle in equities.
Transportation Index
Market history demonstrates that the Transportation Index often leads the general stock markets. Indeed this is again the case in forecasting a US Bear Market in equities. During the bear markets of 2000-2003 and 2007-2008, the Tranies Index was an early beacon signaling the crash in the US equities. And again recently the Tranies Index has signaled the birth of an impending Bear Market in US stocks.

Prominent Stock Leaders (Yahoo, WMT, CAT, AAPL, BAC, CS and LNKD)
During all bear markets there are high-profile momentum stocks in different industries that tend to lead the general market trend. Below are listed seven Leader Stocks, which historically have paved the way to lower equity values. And it is sadly apparent that these Leader Stocks are again recently pointing to a developing bear market. Here are their charts since 1999. Indeed some of them show material recent declines.
Yahoo

WALMART

CAT

APPLE

BANK OF AMERICA

CREDIT SUISSE GROUP


DOW/US Bonds With Bearish Triple Top
This is a technical indicator that clearly pinpoints stock market tops. The supporting theory dictates stocks will necessarily rise faster than bonds in a Bull Market (thus the indicator rises). However, when sophisticated investors determine stocks have peaked, they will begin dumping their equities (thus stock values fall), and begin to buy bonds (increasing the value of bonds). Thus the DOW/US Bonds indicator will begin to decline in a Bear Market. Moreover, the corresponding chart shows a historically very negative pattern, which is the BEARISH TRIPLE TOP of this technical indicator. This implies the on-coming Bear Market may well be more severe than the previous two shown in this chart.

DOW Index With Full Stochastics Indicator
Below are the four major US Stock Indices (DOW, S&P500, NASDAQ and New York Exchange) showing how the Technical Indicators heralded the beginning of each BEAR MARKET (since 2000)…and is AGAIN announcing today a new BEAR MARKET. The vertical white lines pinpoint the beginning of each bear market (when the Full Stochastics fell below 80 level).

http://stockcharts.com/h-sc/ui?s=$INDU&p=M&yr=20&mn=0&dy=0&id=p07293210459&a=437661841&listNum=2
S&P500 With Full Stochastics Indicator

http://stockcharts.com/h-sc/ui?s=$SPX&p=M&yr=20&mn=0&dy=0&id=p59494386313&a=437662765&listNum=2
NASDAQ COMPOSITE INDEX With A Bearish Double Top

New York Stock Exchange Index

Number Of NYSE Stocks Above Their 200-day Moving Average
This technical indicator accurately predicted the BEAR MARKETS of 2000-2003 and 2007-2008. To be sure, it is again today forecasting a new BEAR MARKET in US equities.

Raw Materials And Natural Resources
The pillars of the US Economy are built upon its Raw Materials and Natural Resources (i.e. Copper, Crude Oil, Steel, Aluminum, Coal and Natural Gas). The chart below clearly demonstrates that the values of these commodities have been relentlessly tumbling during the past two years. In deed and fact the decline in price of these six commodities has fallen an average of -45% since early 2014. OBVIOUSLY, THIS IS NOT INDICTIVE OF A HEALTHY ECONOMY. Rather, it spells encroaching Economic RECESSION. Consequently, Institutional Investors are pulling in their horns…and slowly but methodically selling their equites in anticipation of an impending full-blown BEAR MARKET IN US STOCKS.

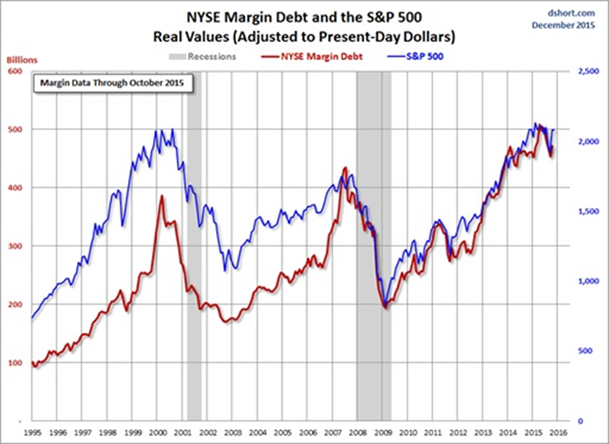
NYSE Margin Debt
One of the primary causes of the dramatic 1929 Crash in US stocks was the NYSE Margin Debt. Hapless investors were allowed to buy equities with only 5% margin (where the brokerage house lent the innocent, naïve investor the other 95%) to speculate in stocks. And once the market peaked, Brokers began calling in the loans, which forced these ignorant speculators to dump equities au masse…thus forcing stock values even lower…which created an avalanche of selling and MORE MARGIN CALLS. The rest is history as the DOW Index tumbled -89% from peak to trough. However, we all know today’s PERCENT maximum margin allowed is NO where near 95%. Nonetheless, too many speculators have run up the NYSE Margin Debt to record levels (see chart below). Needless to say, record levels coincided with the beginning of the 2000-2003 and 2007-2008 BEAR MARKETS. And today the NYSE Margin Debt is again at an all-time record high…which may well lead to a major selloff in US equities.
And lastly there is a hair-raising fundamental sign that the heretofore bulls are morphing into growling BEARS:
“Insider Trading 29 January 2016: Insiders Sold Almost 10 Times As Much Stock As They Purchased”
“Insider buying declined last week with insiders buying $27.94 million of stock compared to $56.58 million in the week prior. Selling on the other hand increased with insiders selling $267.17 million of stock last week compared to $112.27 million in the week prior”. (Read complete commentary at: http://econintersect.com/pages/investing/investing.php?post=201601312022 )
BEAR MARKET FORECAST Based Upon The Above Bear Market Foot Prints:

 The probability is high US equities are hell bent for leather to severely tumble this year…and possibly into 2017. The charts suggest the DOW Index may fall to 8000 support, while the S&P500 Index might decline in concert to it 800 support. (See the DOW Index and S&P500 Index charts above)
In this event hordes of investors may again flock to the traditional safe havens of GOLD AND SILVER.
Related Research
Stocks To Crash Worldwide In 2016
The Bear Is At The Door (Part 1): Momentum Stocks Getting Crushed
All The Stock Charts Spell: B-E-A-R M-A-R-K-E-T
Legend Warns Global Panic Is Coming
The Looming Global Bear Market In Stocks
Stock Bears Are Preparing To Run Amok…Worldwide (Part 2)
How Much Will The DOW Index Correct In The Developing 2015-2016 Bear
More from Gold-Eagle


