Is That Gold’s Inverse H&S Or Reversal?


In yesterday’s Gold Trading Alert, we commented on gold’s breakout above the previous highs and described the completion of the inverse head-and-shoulders pattern in the following way:
Q2: As you can see today, gold future formed inverse head and shoulder pattern with neckline 1700 and depth about 250.
This imply gold can go to 1950.
A2: Yes, it does imply that and that's probably why gold shot up so high once the previous highs were broken. Still... We have very little trust in this formation. One thing is that the breakout above it is not confirmed, and the other thing is that the recent rally was something that was very much in tune with the analogy to 2008. There was some strength, gold even broke to new highs, but... That's pretty much it. Neither silver, nor miners broke to new highs, or were close to doing so - that's exactly what we saw in 2008, before the final slide in gold.
Let’s take a look at gold’s breakout to new 2020 highs.
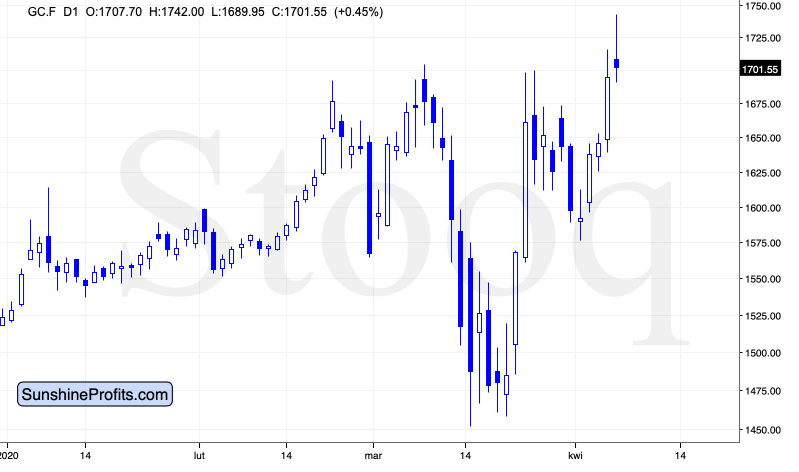
Gold has indeed moved sharply above the previous 2020 highs, but it also moved sharply back down. This could be viewed as a small pullback and a verification of the breakout… But only if the price of gold rallies and closes higher for the next two trading days. This seems doubtful due to the above-mentioned factors but also due to the short-term situation in the USD Index.
And what happened in the following hours? Did gold move as we had forecasted?
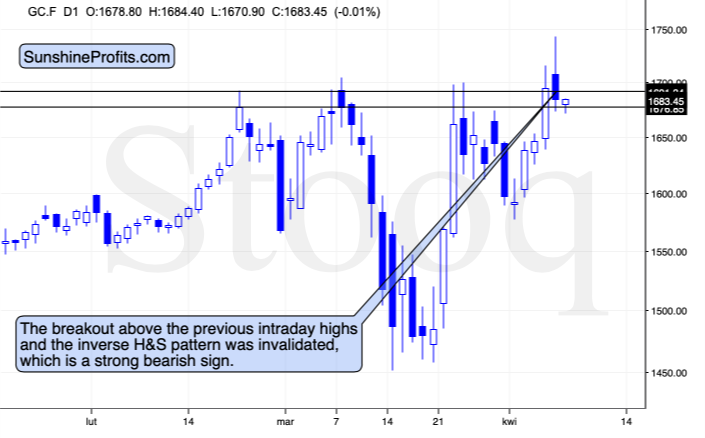
Gold declined (forming a huge reversal) and closed the day below the previous 2020 intraday highs, effectively invalidating the breakout above them. Gold still closed the session above the previous highs in terms of the daily closing prices, but the intraday invalidation is already significant. It’s particularly significant given that the USD Index moved initially lower yesterday. Gold didn’t use this move to rally – it only softened its intraday decline.
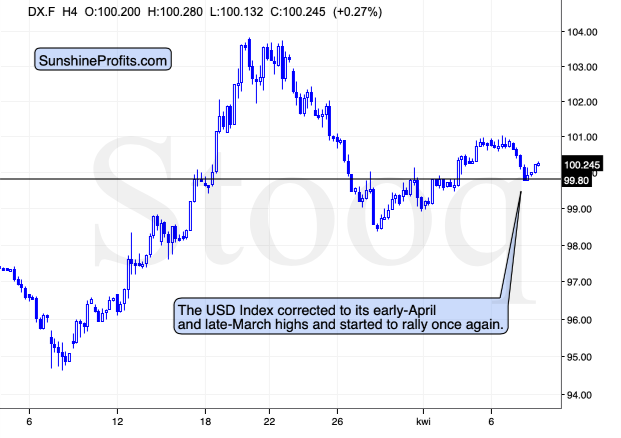
Since yesterday’s decline in the USD Index seems to have already ended, its correction after bouncing from the support provided by the previous highs, it seems that the pressure on gold will now be negative.
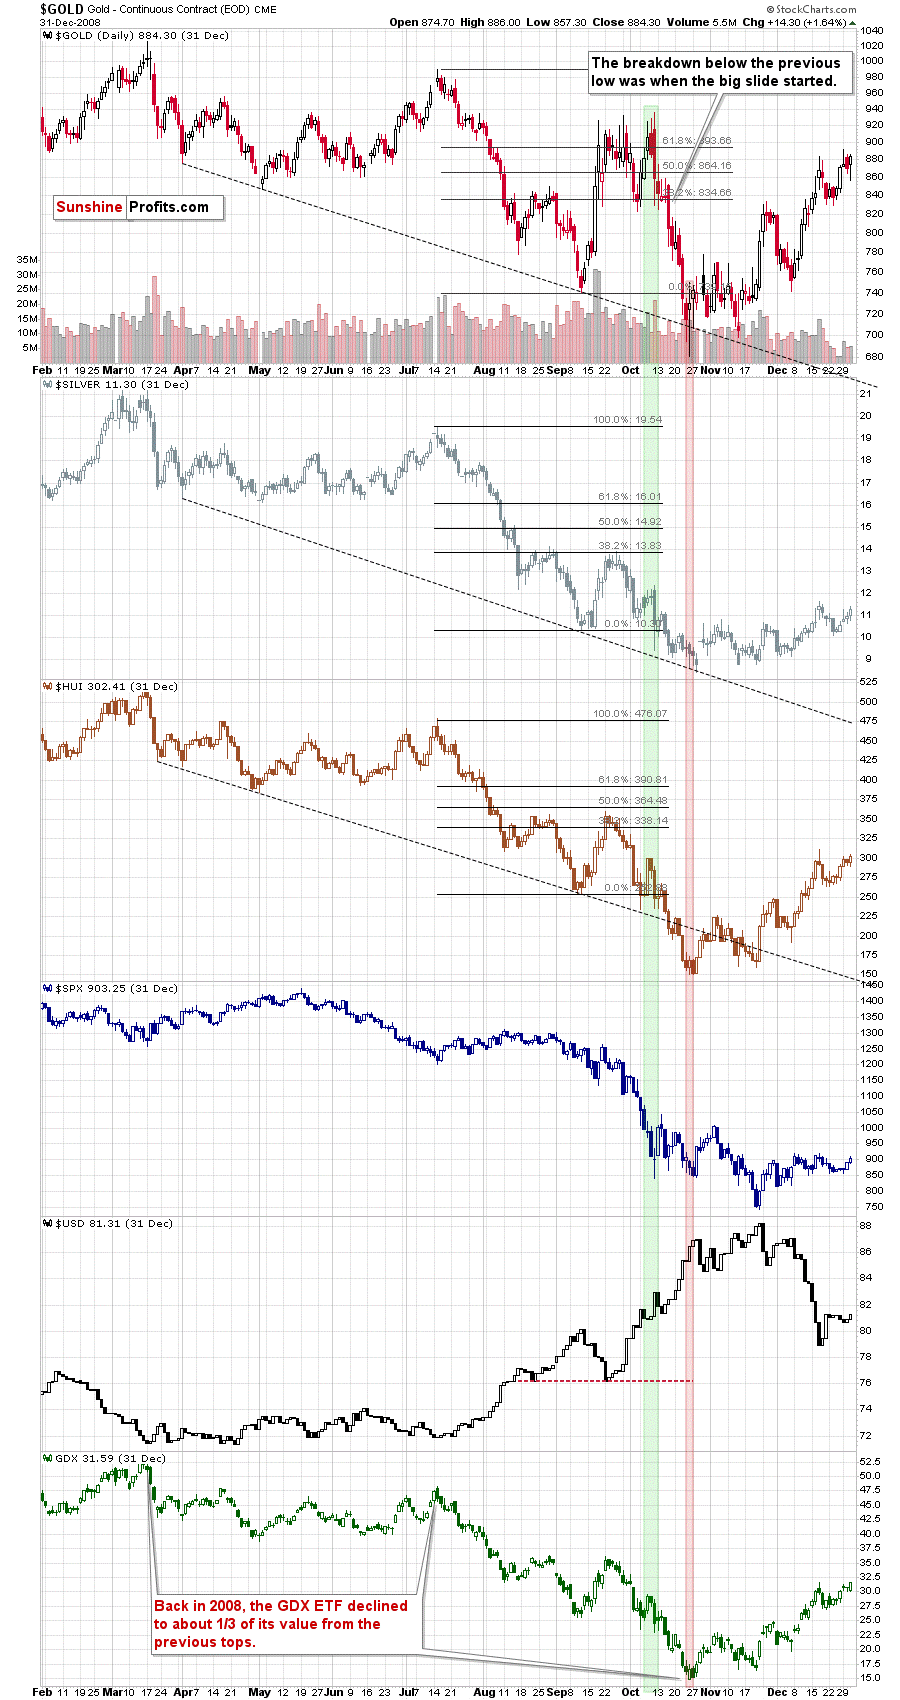
The 2008 – 2020 link remains intact, not only fundamentally, but also technically.
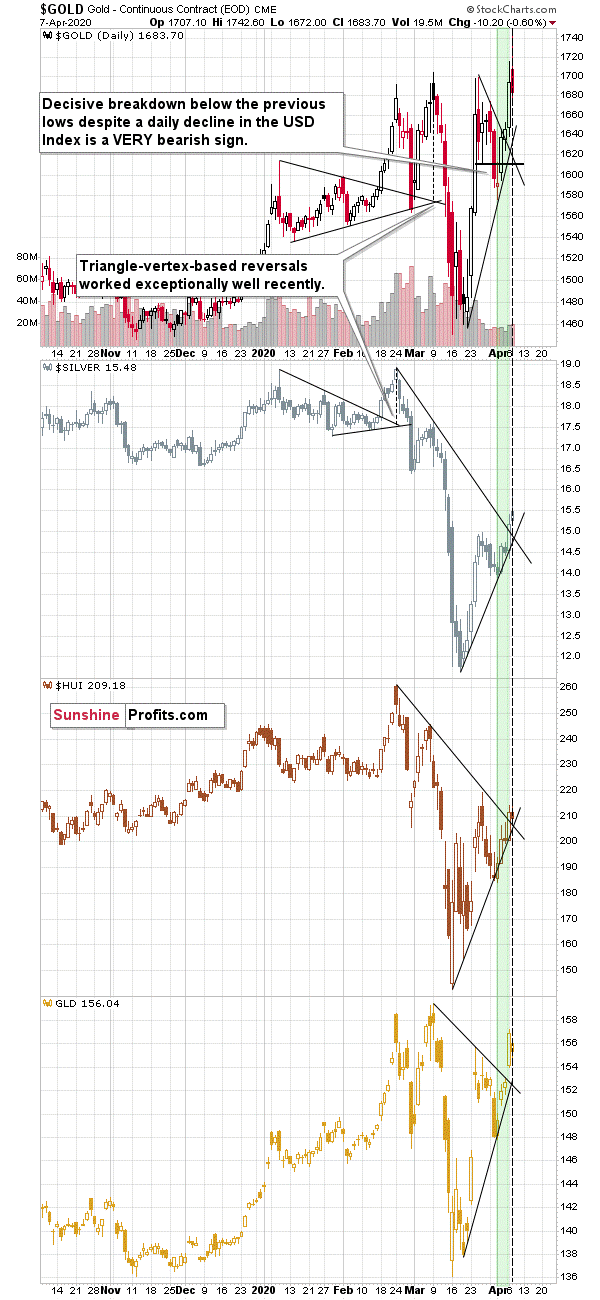
In Monday’s Alert, we commented on the above chart in the following way:
Silver moved higher, but not above its recent high, and miners corrected about half of their most recent downswing. It seems that the two periods in 2008 and 2020 (both marked with green) are indeed very similar.
Note: silver might exceed its recent high temporarily as the market might focus on the industrial demand due to the upcoming infrastructure projects. That’s unlikely to be anything more than a temporary development.
As you can see, there are there are triangle-vertex-based reversals early this week in all key parts of the precious metals sector: in gold, in silver, and the mining stocks. We also get the same indication based on the GLD ETF.
This means that – based on this trading technique - it’s very likely that we’ll see some kind of reversal today or tomorrow. Based on the analogy to 2008, it’s likely to be a local top, even despite the rally in the USD Index.
That’s exactly what happened. GLD seems to have topped on Monday, while gold futures and silver futures topped on Tuesday. Miners topped on Monday in terms of the daily closing prices, but they topped in intraday terms yesterday.
The triangle-vertex-based reversals seem to have worked once again – especially in case of gold, and it seems that we were closing the long positions in gold extremely near to the top and the same goes for the timing of increasing the short position in the miners (after temporarily limiting it).
Please note that the top is likely in also based on the analogy to how the situation developed in 2008. The next slide is likely to be particularly volatile.
The final note on the link to 2008 is that back then, gold made more than one attempt to break above previous highs, so while it is not inevitable this time, we shouldn’t be surprised if we see something like that. Still, given the size of the rally that immediately followed the fake breakout to new 2020 highs, it seems that the rally is already over after all.
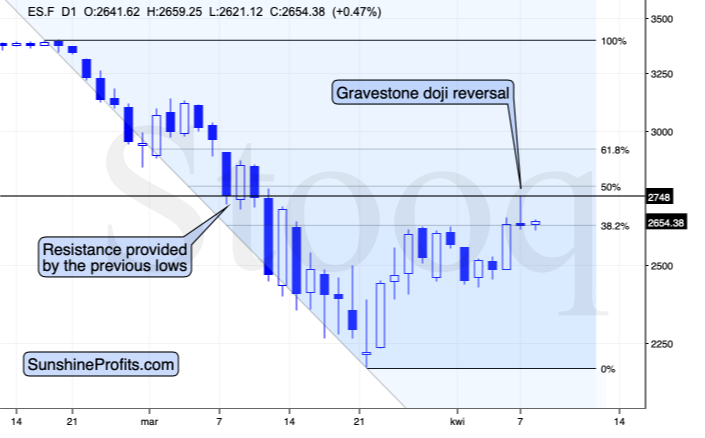
The stock market rallied yesterday… Up to a point. Then it reversed and ultimately created the gravestone doji reversal, which is a major bearish indication for the short term.
The S&P 500 seems to have topped between the 38.2% and 50% Fibonacci retracement levels.
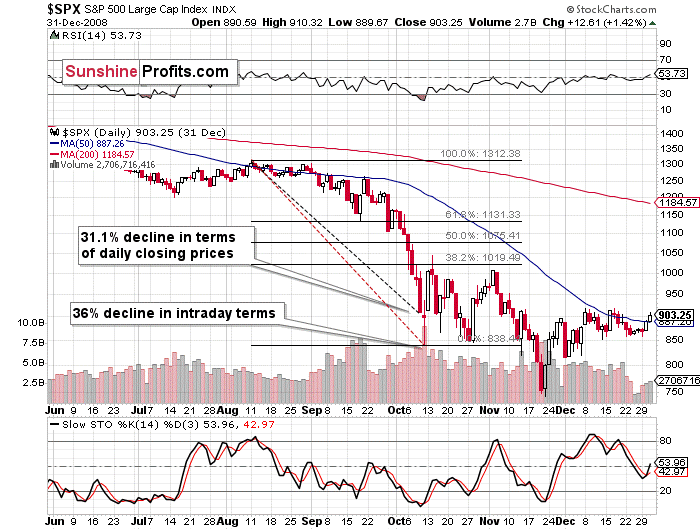
That’s exactly where it topped after the most volatile decline of 2008. The mid-October 2008 top was also formed on an intraday basis, which makes these cases even more similar.
Summing up, it seems that the precious metals market is about to slide. Still, the move lower might not remain in place for a long time – we expect a big rebound within the next couple of weeks, similarly to what we saw in 2008.
Thank you for reading today’s free analysis. Its full version includes details of our current position in the mining stocks and we also provide more specific time target with regard to the upcoming bottom, which complements greatly our preceding profitable long gold position. We encourage you to sign up for our free gold newsletter – as soon as you do, you'll get 7 days of free access to our premium daily Gold & Silver Trading Alerts and you can read the full version of the above analysis right away. Sign up for our free gold newsletter today!
Przemyslaw Radomski, CFA
Editor-in-chief, Gold & Silver Fund Manager
Sunshine Profits - Effective Investments through Diligence and Care
* * * * *
All essays, research and information found above represent analyses and opinions of Przemyslaw Radomski, CFA and Sunshine Profits' associates only. As such, it may prove wrong and be subject to change without notice. Opinions and analyses were based on data available to authors of respective essays at the time of writing. Although the information provided above is based on careful research and sources that are believed to be accurate, Przemyslaw Radomski, CFA and his associates do not guarantee the accuracy or thoroughness of the data or information reported. The opinions published above are neither an offer nor a recommendation to purchase or sell any securities. Mr. Radomski is not a Registered Securities Advisor. By reading Przemyslaw Radomski's, CFA reports you fully agree that he will not be held responsible or liable for any decisions you make regarding any information provided in these reports. Investing, trading and speculation in any financial markets may involve high risk of loss. Przemyslaw Radomski, CFA, Sunshine Profits' employees and affiliates as well as members of their families may have a short or long position in any securities, including those mentioned in any of the reports or essays, and may make additional purchases and/or sales of those securities without notice.
********
 Przemyslaw Radomski, CFA, is the founder, owner and the main editor of SunshineProfits.com. You can reach Przemyslaw at: http://www.sunshineprofits.com/help/contact-us/.


