The Half Year Crystal Ball


They say that experts can discover much insight into someone’s personality and his or her emotional state from observing and analysing the clues provided by their so-called ‘body-language’ Similar clues about the underlying beliefs and sentiment in financial markets are available from changes in price and volume over the longer term, but also during intra-day trading. While nothing ever can be certain where financial markets are concerned, the exploration of such clues is nevertheless an interesting exercise. The end of the half year is an important mile post for many markets; Wall Street and the precious metals are no exception. Let’s take a look.
Without claiming to be an expert in this field, it still is fun to take a closer look at aspects of these two markets and perhaps discover something of interest that helps to anticipate the future. Always an advantage, to have a bit of a preview of what is coming over the horizon and which might arrive next week or next month. Then to wait as time passes to see how reality unfolds and compares to the crystal ball.
The key fact to keep in mind is that Friday was the last day of the half year. We all know full well how important option expiration on Comex is and triple witch days for Wall Street. However, it is said that the volume of over the counter (OTC) contracts in precious metals exceed the positions on Comex by far. Similarly, investment funds are rumoured to employ a staggering amount money to ensure that a short list of a few stocks outperform the market at the close of trading at the end of the quarter or half year. Their standings on the funds’ roll of honour will determine how many new investors they attract and this in turn would determine the kind of bonus they can expect later. Strong incentives for the fund managers to perform well.
No wonder that stock market indices tend to end a quarter on a high note, with an almost across the board increase in prices of those stocks favoured by investment funds. Of course, knowing this, large sellers stand ready on these particular days to offload into strong demand, expecting prices to hold up despite their heavy selling. Which is why triple witch days typically see high trading volumes and usually this is also true of end of quarter trading.
Yet, on Friday, trading in the Dow 30 stocks did not follow the near routine pattern of high volume and a steadily rising trend throughout the day. The day started off as was to be expected, rising strongly after having gapped higher at the open; with the typical high turnover as the market sets initial direction. Then, as the turnover started to decline, the trend gradually leveled off to turn bearish, still on quite low volume. The bear trend turned steeper, but without volume spikes associated with fresh support. Only near the end of the day two tall volume spikes, higher even than at the open, showed there was a big effort to limit the steep decline.
These facts clearly showed that starting not long after the open supply grew larger than demand which – given the relatively low and steady turnover through most of the day – implies that ramping buyers were not out in force and that large sellers held back not to trigger a full sell-off until near the end of trading. At that late time, the increased urgent selling was almost matched by fresh support for the market as shown by a large increase in volume, yet even this was not enough to stop the slide that had moved well into the bullish gap that had opened the day’s trading.
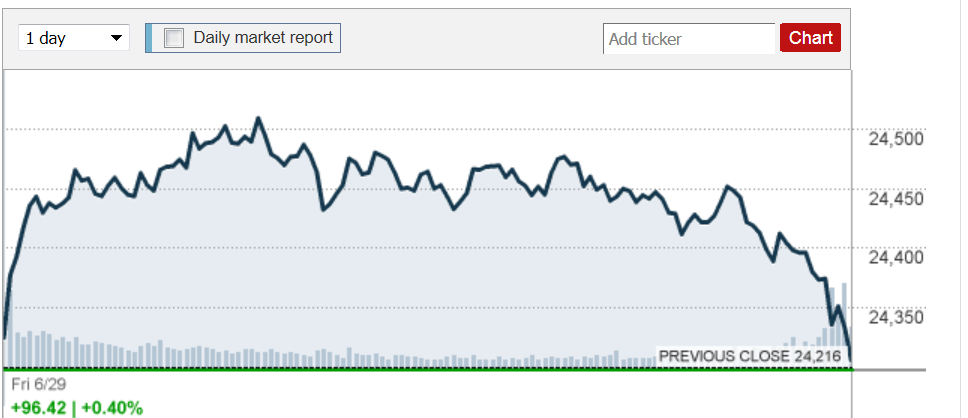
Dow 30. Friday 29 June 2018 (money.cnn.com shortly before the close)
There are various scenarios to explain the differences from the usual end-of-quarter behaviour. Such days are typically dominated by the ramping of selected shares by funds reaching for better positions on the ranking order. This time, it seems, the funds were apprehensive about increasing their exposure over a weekend at the end of a half year and with international politics balanced on a knife edge. There is no confidence that the market can hold its position let alone continue the long term bull market.
The large increase in volume late in the day, shows that sellers were getting very concerned and were willing to sell at best simply to close positions that were at too high risk. The buyers who tried to stem the steep fall as panic selling increased late in the day were probably those who come to support the stock market whenever it threatens to end the day on a too weak note. After what has happened during the day, it is doubtful whether the funds that are normally responsible for the ramping of the market would risk increasing their exposure so late in the day.
The volume for the day at about 323 million is much lower than the three month daily average of almost 376 million, providing evidence of the lack of commitment in the continued health of the stock market. This week, as the market begins a new quarter and half year, should show whether this conclusion based on the trading on Friday – implying that the bear market is to extend – is close to the mark.
Friday also saw the gold and silver at new lows not seen since the recovery that had started in December last year. The charts also shows that while the recovery in the price of gold seemed to be the start of a strong rally, at least until the attack of the past few weeks, the price of silver had barely moved high before it was trapped in a very narrow sideways range around $16.50. Why the difference?
There has been much speculation about an answer to that question, but there are just not enough facts available to support meaningful analysis, so anything more than the conclusion that the difference is important and that silver appears to be the bigger threat should the price take off, is not much more than guesswork. It is, however, clear from the much tighter control over the price of silver of the past few months now that the tide appears to be turning, that the perceived magnitude of the threat, whatever it might be, is increasing substantially.
Logically, one would expect that rising demand for silver, both for its applications in electronics and other wise, including as a lower cost entry into the PM safe haven, is placing pressure on the price seeing that fresh supply cannot easily respond to growing demand, so that above ground reserves have to be exploited. If reserves are getting close to running out, it would be critically important to prevent any sign by bullish price behaviour that the silver supply-demand relationship is unbalanced. It also follows that time is running out for the manipulation to suppress PM prices – a conclusion often stated more as a wish than based on any hard facts.
The determined action of the past few weeks to push PM prices as low as they were when the half year ended, might also be associated with open positions in the OTC market that threatened to upset the supply-demand relationship even more should they expire with a firm bullish bias. If such positions, say, were the main reason for the sustained attack, then the pressure on the metals might be relaxed, even with July 4th and the NFP during the coming week, just to prevent too many Comex calls being purchased at these low prices. What happens to the price of silver this week and during the rest of July might provide some clues to better answer the question.
This week, as July 6 approaches, should also improve clarity of understanding what is happening with respect to the Trade War with China; or is it Europe or perhaps the rest of the world? That something has to be done to make the US less reliant on mainly China, but also other on other imports for strategic reasons or simply to keep Americans working in America is certain. The question is how to accomplish this in the most effective manner without too many perhaps overwhelming negative side effects on many fronts. Doing so while at the same time having to wage many battles on the home front is a tough task with probably little certainty of success.
The second half of 2018 is expected to offer reasons for even greater volatility in the markets. It would not surprise if the question of the financial situation of the bottom 80% of US households would move closer to centre stage and into the MSM spotlight. Would be interesting to see how they explain it, if they do get to treat it as the gorilla in the dining room, which it is.
Euro-Dollar
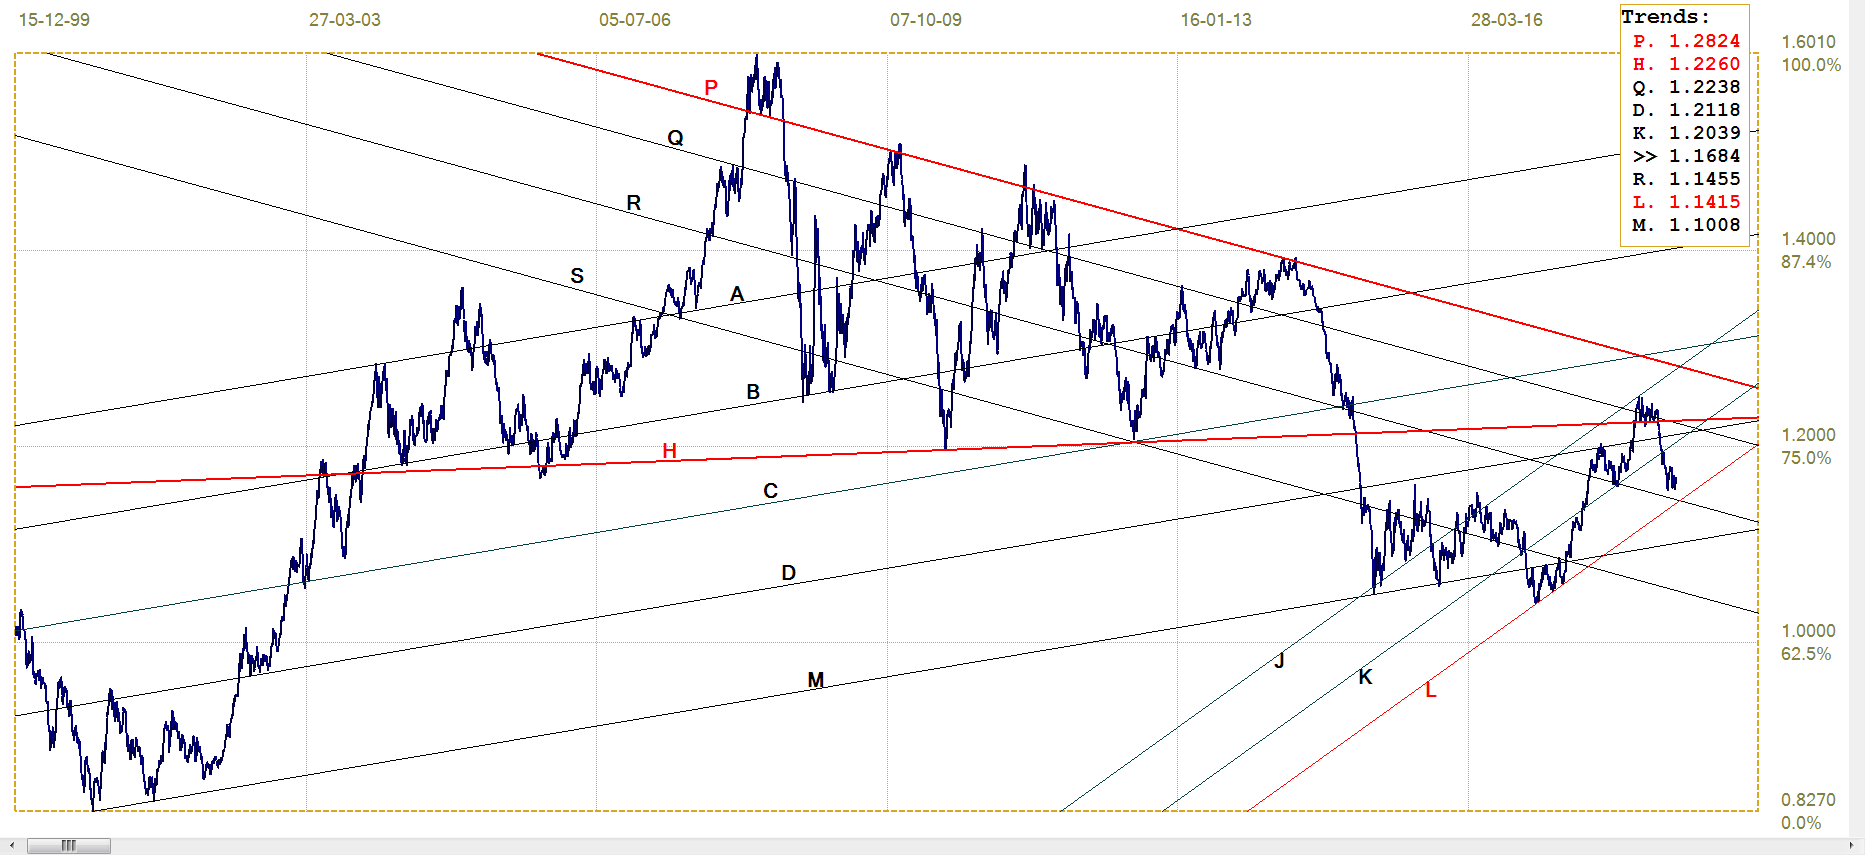
Euro-dollar, last = $1.1684 (www.investing.com)
It is beginning to look as if a semi-unified Europe is becoming a failed experiment. When history looks critically at what happened, it will probably find a case of very good intentions being ripped apart by the human failing of wanting your cake while also eating it. One of the Maastricht treaty conditions sets 60% of GDP as the upper limit for the national debt of member countries. In late 2017, the national debt of Greece, Italy, Portugal, Belgium, Cyprus, Spain, France and the UK ranged from the 177% for Greece to the 86.5% of the UK, with only Cyprus as one of the minnows in that union. Even the disciplined Germans at 65.1% are above the limit.
After the red bullish triangle failed to break higher at the end of its leg 5 in May of 2014, the euro broke lower from the triangle at the end of that year to signal severe problems for the euro currency. Now the recovery of support along line M has failed to hold the brief break back into the triangle and it seems it is written that there are more dark days ahead for the euro.
Unless, of course, the dollar listens to the many reports of its own demise which are a staple content of the financial web. For the time being, the best the euro can do without direct assistance from the dollar is to hold its own against the US currency.
DJIA
As discussed above, Wall Street had quite a difficult time over the half year end on Friday. After falling 4.7% in a straight line (1203 points) from 25 321 on 12 June to 24 118 on 27 June, the stock market turned bullish on the last two days of the week – anticipating the half year end? yet what happened on Friday surely has to be a disappointment for the funds and the bulls.
The break below the steep support line S (24 517) on Monday sets a bearish trend in motion and the recovery late in the week did not come close to correcting that bearish break. Line S has been broken before, followed by a recovery, but the good support that held when it was recently tested shows that the new break lower might be significant.
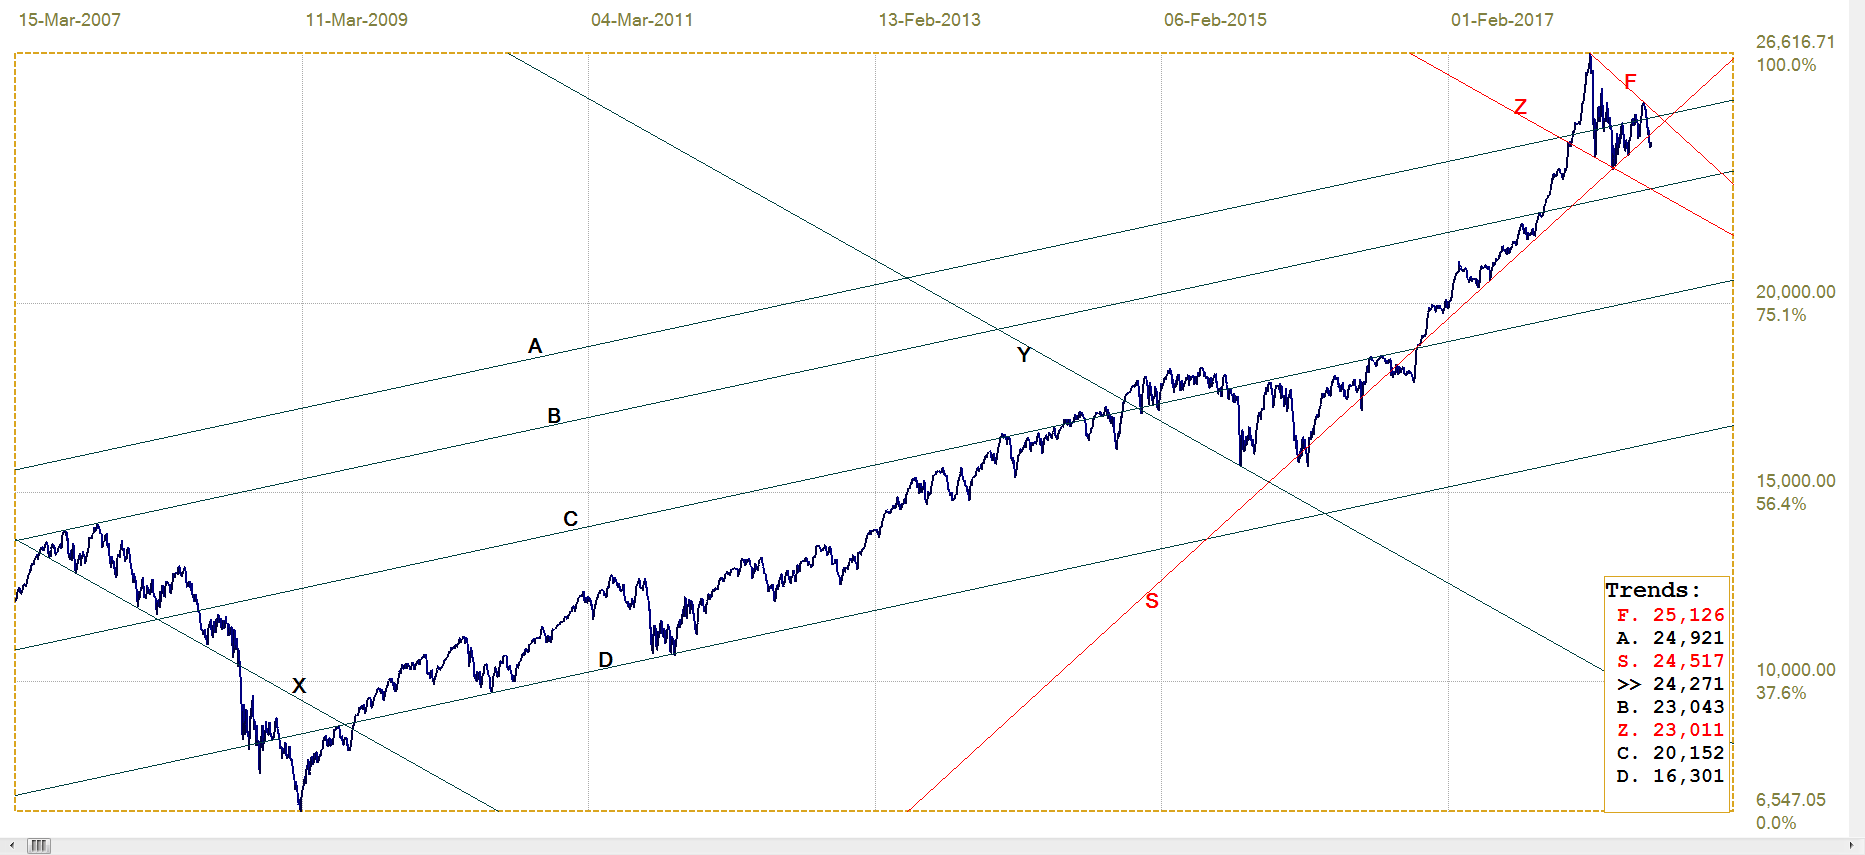
DJIA, last = 24271.41 (money.cnn.com)
Gold PM fix - Dollars
August is now the big month for gold on Comex, with the open interest standing at 322 538 according to the preliminary report for Friday. The total trading volume for Friday is just short of 250k or more than 75% of the OI. Better than three out of four contracts on the OI were transacted on Friday. That is massive trading volume compared to the market position for which there are two possible explanations, or a combination of the two.
The first is there are a large and relatively stable population of punters who play the gold futures, perhaps a number of times during the day, intending to take only a small profit – or loss – before exiting the market again. This would imply owners of the end of trading OI consist of a core of long term investors with quite a large a population that changes over time and occasionally risk over-night positions.
The other is the majority of the OI consist of shills for the banks who during the day trade quite often to give the impression of an active market. This would explain why after a decade or more of longs being fleeced by the banks, they still return to donate to the banks’ and their traders’ profits. The truth probably is a combination of the two explanations but it does not reveal what their balance is.
This continued willingness to make donations to others’ profits struck me some years ago when I first mentioned here the possibility of shills for the banks as one reason for the sustained activity despite the predatory practices of the banks. This does not however serve as a complete explanation for the near consistently high OI for silver, unless that too is a way to sow confusion about the true state of affairs in that market.
With its new intermediate low last week, the price of gold extended the break below line T ($1297) to reach support at lines D ($1255) and L ($1253). Channel JL is divided evenly by line K, with a ratio of 502:498, which validates the position of line L. This week, with 4th of July and the NFP on Friday hanging over the PM markets, is likely to see more pressure on the gold price and it would be an accomplishment if the price can remain close to or even above the new support.
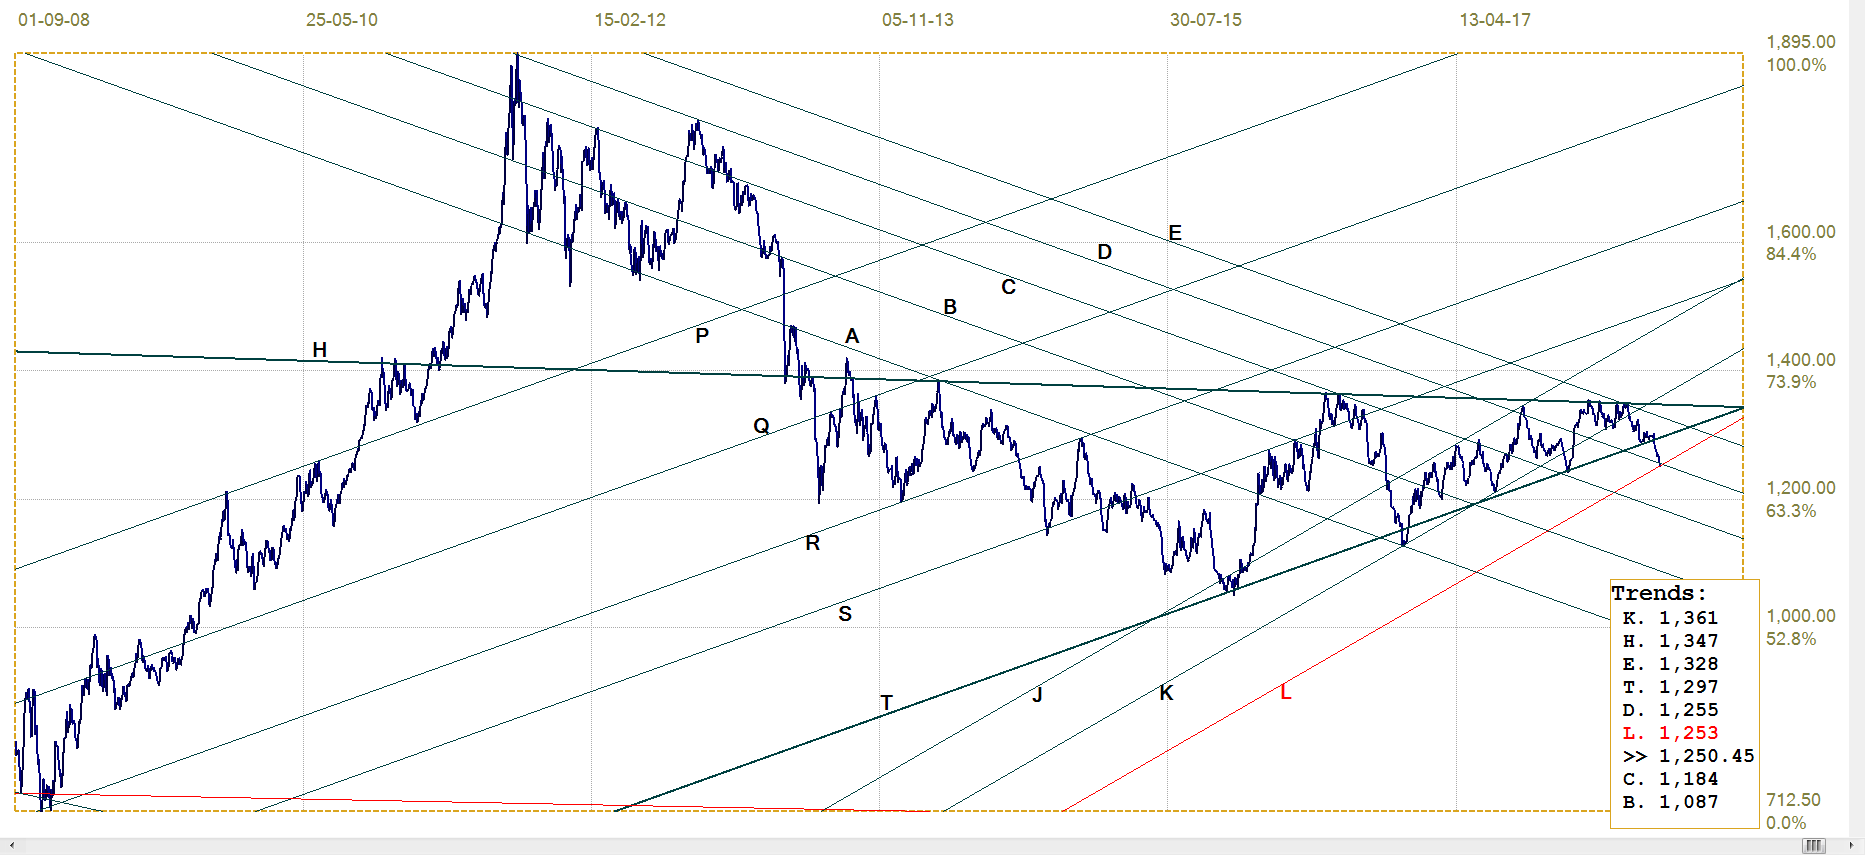
Gold price – London PM fix, last = $1250.45 (www.kitco.com )
Euro-gold PM fix
A week ago it seemed that despite the lower dollar price of gold, the weaker euro managed to keep the price of gold could near the support along lines Z (€1090) and T (€1090. This is at least a glimmer of light for gold, but to keep some value in a suffering currency like the euro is not much of a performance. Last week this was not to be. The dollar gold price sank to a new intermediate low and a brief recovery in the value of the euro two weeks ago failed to extend or to hold.
With weak gold and the euro back at a tight double bottom, the euro price of gold sank below earlier support of lines Z and T to move quite far down towards support at line C (€1058). If the euro price extend lower to reach that support, it will set a new intermediate low since the start of the 2015 rally in the euro price of gold.
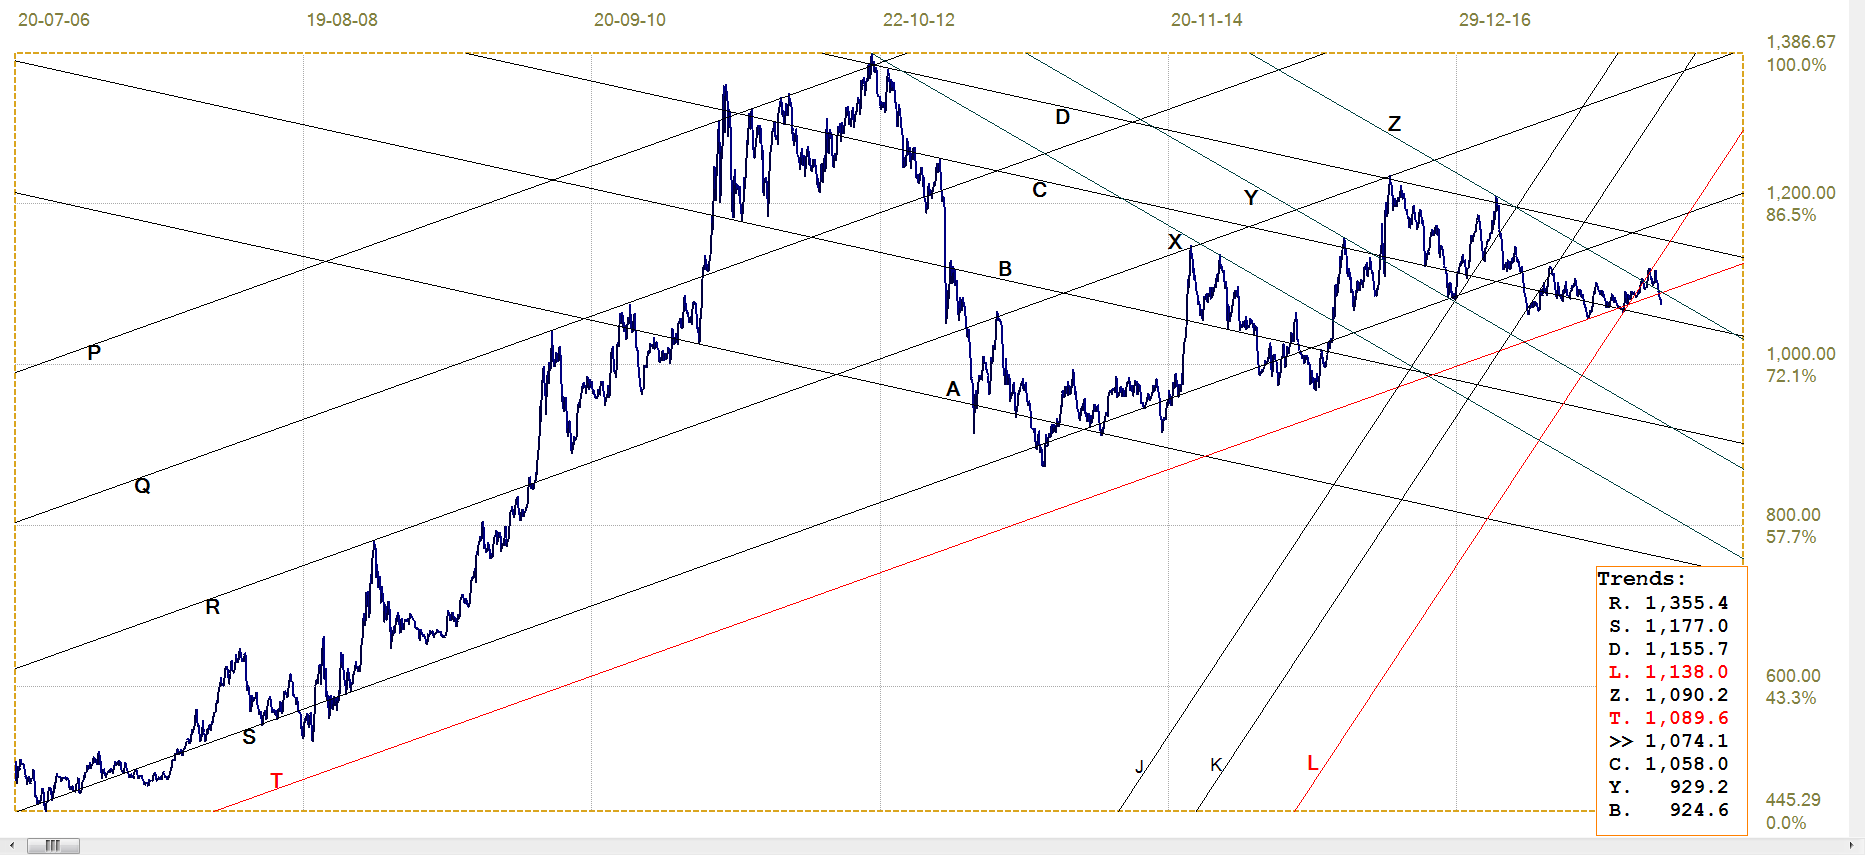
Euro gold price – PM fix in Euro, last = €1074.1 (www.kitco.com)
Silver Daily London Fix
Recent changes in the price of silver appear on the chart to be of no consequence as they are so small. Yet the changes, particularly in percentage terms with the price of silver so low, are substantial but they only appear small because the range of the silver chart from the low at $8.88 in 2008 to the high at $48.7 in 2011 represents an increase of 548%. That performance required only thirty months to complete and perhaps offers an indication of what can be expected from silver when it finally breaks free of the current stranglehold.
The break lower is bearish, with line T ($15.82) as the next level of support. While it is within reach, a sustained break lower is considered unlikely. The PM markets are noted for the strange things that have happened, but I find it near impossible to accept that the price will be allowed to settle much lower given the increased risk of igniting a real feeding frenzy, which the banks can ill afford.
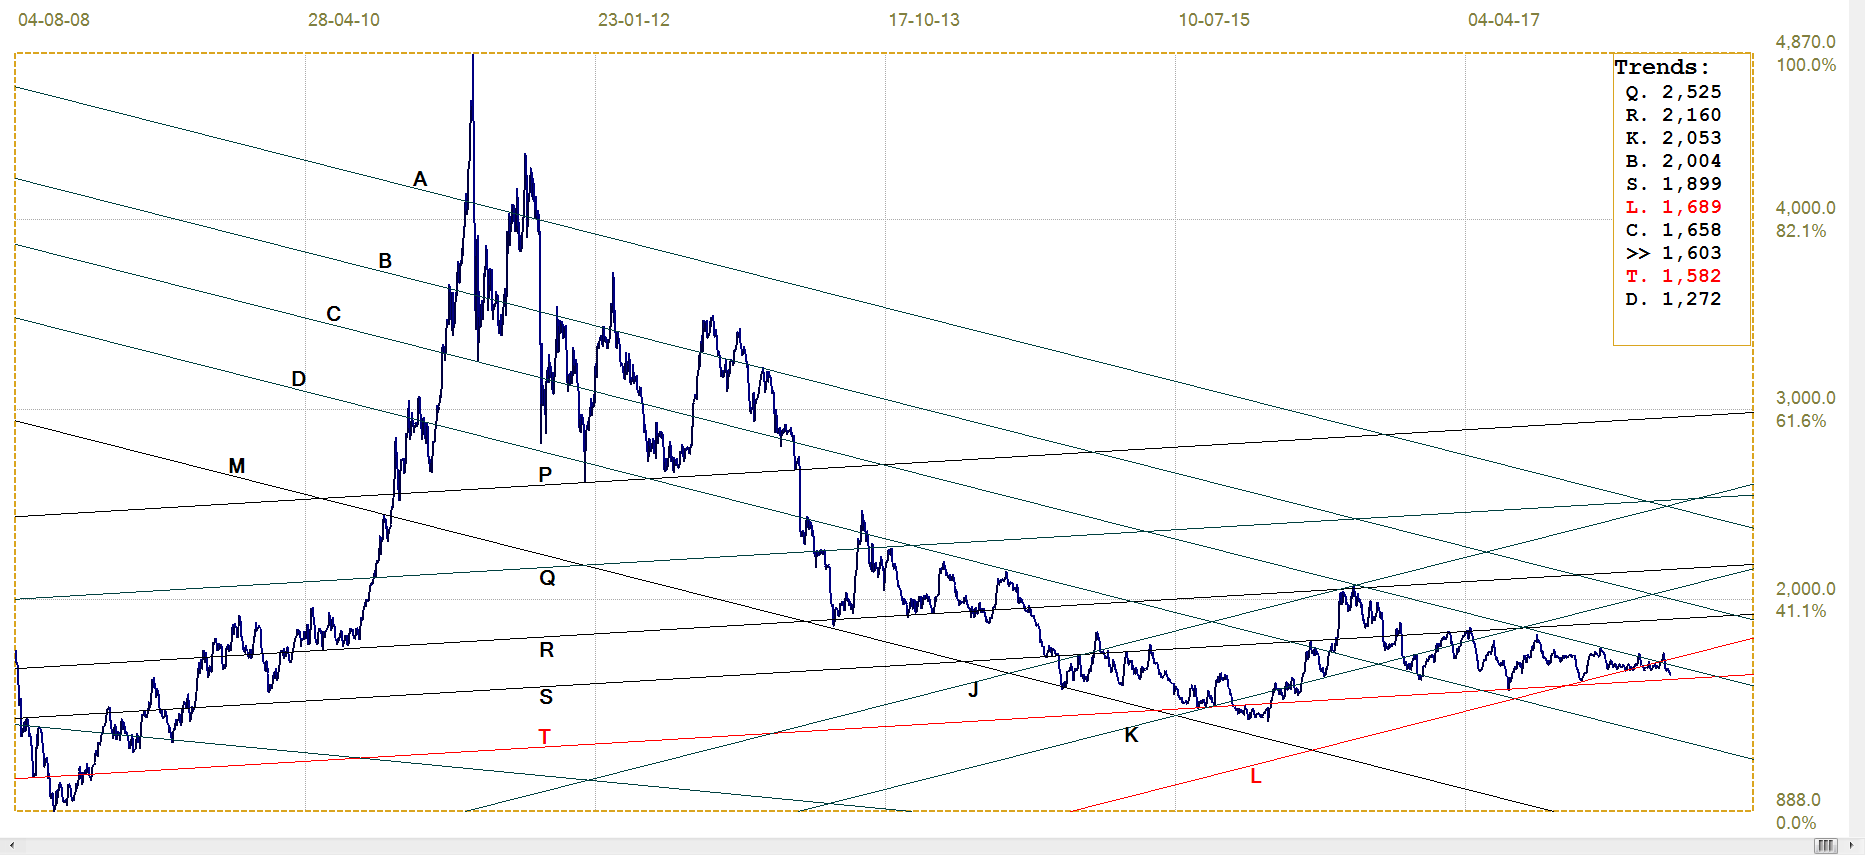
Silver daily London fix, last = $16.03 (www.kitco.com)
U.S. 10-year Treasury Note
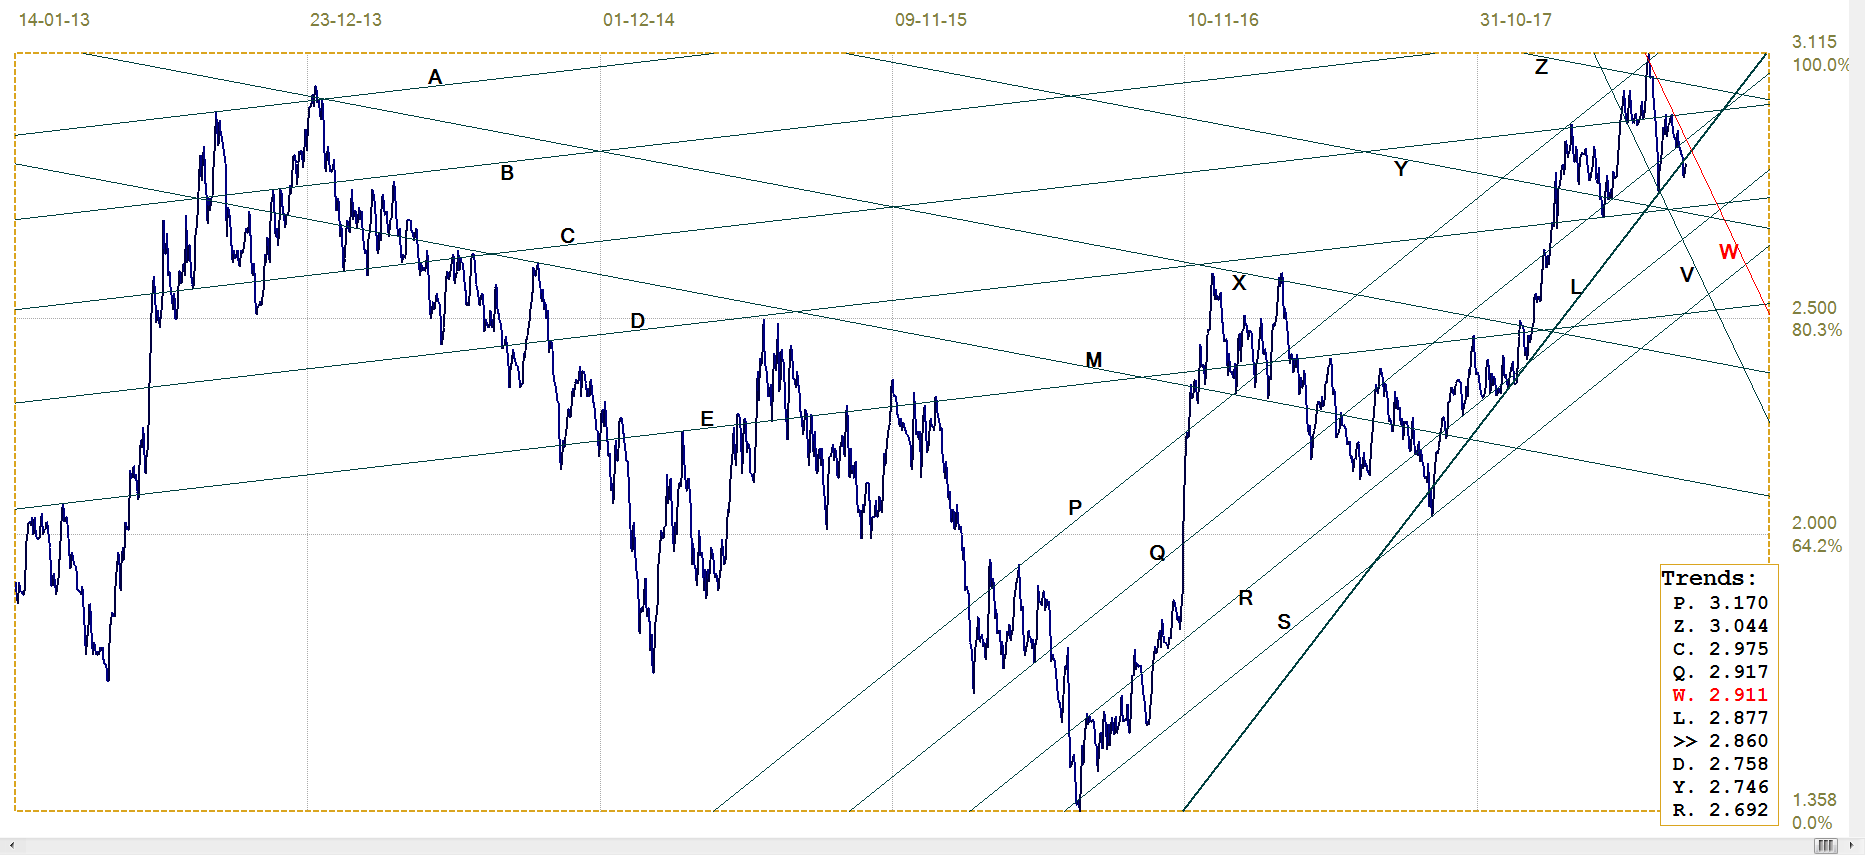
U.S. 10-year Treasury note, last = 2.860% (www.investing.com )
The simplified analysis shows that the yield on the 10-year has held closely to the bear channel PQRS and until last week remained mostly above line L (2.877%). The rally that started off the yield high at 3.115% has kept to a new bull channel, VW (2.911%) to break below lines Q (2.917%) and L.
The bull channel is still intact, but with the high volatility in the major US markets and the intentions to increase rate probably two times more in 2018, it is doubtful whether the bull channel will remain in place for very much longer.
West Texas Intermediate crude. Daily close
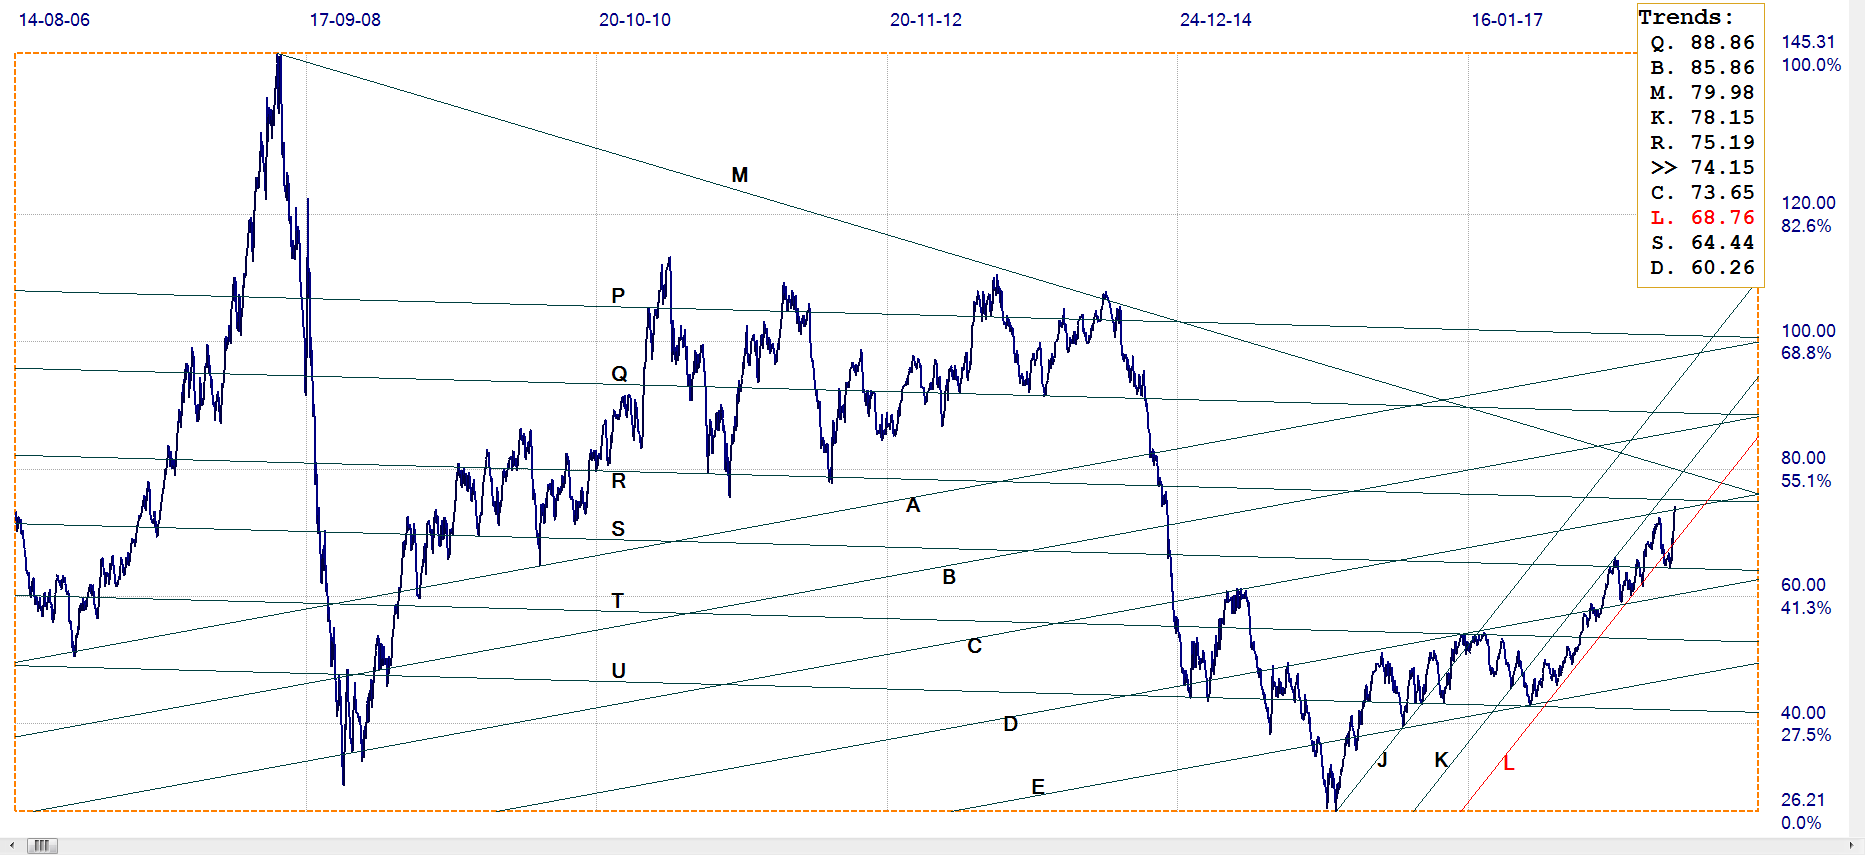
WTI crude – Daily close, last = $74.15 (www.investing.com )
With one recent exception, the price of crude has held well to the new bull channel JKL ($68.76). The break lower was brief and soon returned to the channel after a rebound off support at line S ($64.44) in a move that is known as a ‘goodbye kiss’ – a return for a final touch on a trend line that has been penetrated.
The recovery into channel KL ($78.15) has reached a new intermediary high, and it might be fuelled by a disbelief in the new OPEC undertaking to increase production which, in turn, would release more of US production for local consumption, to result in lower US prices. The close just above line C ($73.65) and short of resistance at line R ($75.19) has to break higher to remain bullish.


