Current Price of Gold Today (Euro)
Gold Prices per Ounce, Gram, and Kilogram
| Gold Price Now | Change | ||
|---|---|---|---|
| Gold Price per Ounce | €3,747.54 | +25.03 | |
| Gold Price per Gram | €120.49 | +0.80 | |
| Gold Price per Kilo | €120,483.51 | +804.81 | |
| As of Jan 2, 2026 06:55 AM ET | |||
| Gold is by +0.67% |
The latest price of gold per ounce, gram, and kilogram using real-time interactive gold price charts. View the price of gold for different currencies around the world and various time periods. Historical gold prices are provided for context and to help inform investment decisions.
Gold Eagle has been a premier destination for gold prices since the dawn of the internet, founded in 1997. We publish gold market news, gold price forecasts, and commentary that provides insight into the current and future price of gold, precious metals, and the state of the economy in general. Our authors and analysts are some of the most respected in the world.
Gold Price Performance per
| Timeframe | Rate | Change | % |
|---|---|---|---|
| 1 Week | 3,662.97 | +84.57 | +2.31% |
| 2 Weeks | 3,530.93 | +216.61 | +6.13% |
| 30 Days | 3,595.93 | +151.61 | +4.22% |
| 6 Months | 2,832.63 | +914.91 | +32.30% |
| 1 Year | 2,593.31 | +1,154.24 | +44.51% |
| 5 Years | 1,570.98 | +2,176.56 | +138.55% |
| 10 Years | 980.90 | +2,766.64 | +282.05% |
Gold Price Charts
By hovering your mouse within the graph of the Gold prices chart you can also view the price of Gold for specific days.
Price of Gold FAQ
What impacts the current price of gold per ounce?
- Strength of US dollar
- Industrial and commercial demand
- Gold supply
- Fed actions / monetary policy
- Geo-political events
- US interest rates
- Inflation expectations
- Investment demand
For a detailed explanation, read What Affects The Price of Gold.
How does the price of gold perform during recessions?
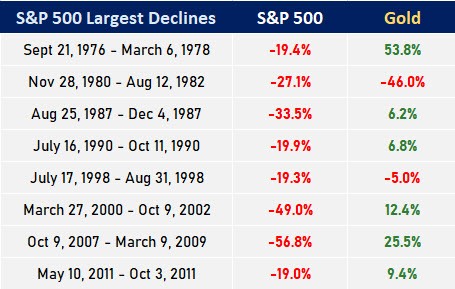
Gold prices typically increase during economic recessions. One way to analyze gold prices during a recession is by comparing its performance with the S&P 500. Below are the dates of the largest declines of the S&P 500 and the performance of gold prices during the same period. This data shows that gold increased significantly in 75% of these recessions.

Is the price of gold different in other countries?
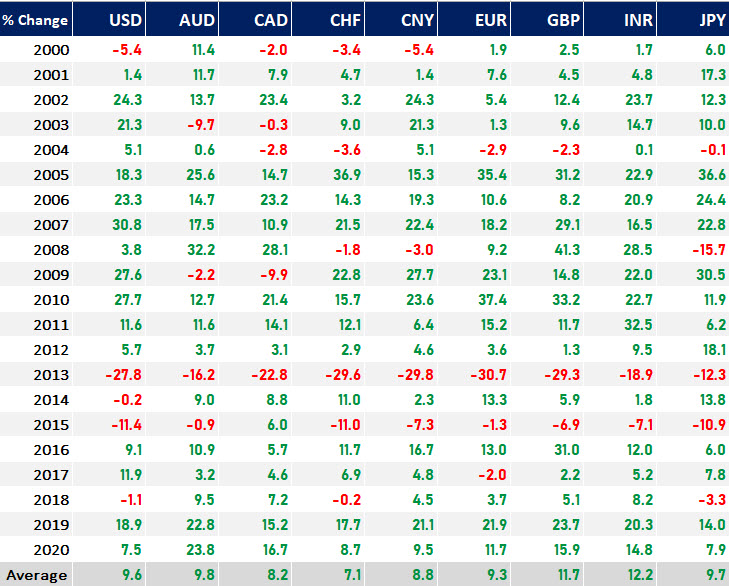
The current price of gold is the same, all things considered, in other countries. The US gold price is converted to the currency in that country based on the current exchange rate. In other words, no matter where in the world you purchase gold, the actual value of that gold in US dollars is the same. The below chart shows the annual gold price performance versus various fiat currencies.

How many grams are in an ounce of gold?
There are 31.1034807 grams in one troy ounce of gold. A troy ounce is a larger system of measurement for precious metals known as Troy weights. A regular ounce of gold is equal to 28.35 grams.
How does the current gold price compare to historical gold prices?
The price of gold has increased approximately 4,750% since 1935 when President Franklin D. Roosevelt raised the value of gold to $35 per ounce. This is compared to today’s gold prices (June 2020) that are hovering around $1,700.
If you compare the goldprice today (June 2020) with the prices at the beginning of this millennium (January 2000), the price of gold has increased approximately 496%. This is 3x the increase of the Dow Index during this period.
Is the price of gold too volatile for the average investor?
Gold is no more volatile than the stock market. Gold prices can have sudden ups and down just like other commodities but it is also known to go through long periods of time with relatively quiet price activity. Overall, gold is viewed by many financial experts as a long-term store of value which is why so many recommend having gold as part of your investment portfolio.
Is it true the price of gold goes up when the stock market goes down?
The price of gold is negatively correlated to the stock market most of the time. When the markets go down gold prices often go up. That being said, there are times when the price of gold and the stock market both go up or down in unison. Overall, however, time has shown that gold prices are not tied to the movements of stocks and bonds and it is for this reason the gold should be an important consideration to protect the long-term value of your investment portfolio.
Do current gold prices vary by country?
The price for an ounce or gram of gold remains mostly the same regardless of which country you are in. The price is determined by converting the current spot gold price for an ounce or gram of gold into the country"s currency. For example, the current spot gold price for 1 gram of gold would be converted into Indian Rupees according to the current exchange rate.
How is the current price of gold per ounce determined?
There are many factors that contribute to the current price of gold. Chief among these factors is the strength of the US dollar. Traditionally gold has an inverse relationship to the value of the dollar. In other words, when the value the US dollar is strong, gold prices go down. Related, the strength of major economies also has an inverse relationship to the price of gold - at least when an economy has a significant downturn. All of this is due to the “safe haven” status gold has traditionally had in the investment world. Gold prices are historically far more stable over the course of time than economies and other classes of investments.
Supply and demand, of course, also play a key role in the price of gold per gram or ounce. There is only so much gold to be mined and gold mining is not cheap. When gold demand outstrips gold supply, the price of gold goes up. The chief areas of gold demand are in gold jewelry. In 2017, 46% of demand for gold was for jewelry. There is also the use of gold in industry for such things as electronics and medical devices.
How much is an ounce of gold?
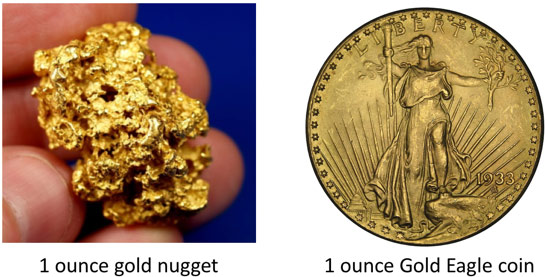
The price of gold per ounce is perhaps the most common way investors monitor the gold market. The image below shows a 1 ounce gold nugget and a 1 ounce gold coin - in this case a gold eagle coin. The Gold Price Now chart at the top of the page shows the current value of gold in US dollars. You can also get the price of gold in other world currencies by selecting a different currency from the drop down menu below the chart.

What is the gold/silver ratio?
The gold/silver ratio is the relationship between gold and silver prices. Investors often consider the historical gold/silver ratios to analyze how they are priced relative to one another.
Featured Gold Price Articles
In this compelling conversation with Tom Bodrovics of Palisades Gold, VON GREYERZ partner, Matthew Piepenburg, bluntly dissects the empirical realities from the main stream fantasies regarding the risk-asset and economic narratives making the current headlines. He touches upon risk asset facts, the deep implications of debt-to-GDP levels globally, the real rather than sensational consequences of ongoing de-dollarization and the now undeniable fact that gold is replacing the UST as a global reserve asset.
The conversation opens with a candid assessment of the common denominator (and common sense) reality of unsustainable debt and its now obvious ripple effects on all the current narratives and debates regarding stocks, bonds, currencies, deflation/inflation and sound vs. fiat money, all of which culminate in a realistic and sober discussion of gold.
As Piepenburg reminds, the outsized risks in credit and equity markets (from scary “private credit pools” and “low-yield” junk bonds to dangerously narrow/tech-meme-driven stock indexes) can no longer be relegated to the cynicism of “gold bug” thinking, as even the finest minds in the stock and bond markets are drawing the same clear conclusions.
Piepenburg makes an equally blunt case for the risks facing paper money in a global backdrop of open currency debasement. He shares his views on how even the “smartest money” in the room continues to deny or avoid these realities by measuring their wealth in currencies (melting like ice cubes) and chasing yield in increasingly more dangerous corners of the credit and equity markets.
Toward this end, Piepenburg gives his views on family office dynamics and allocations derived from direct managerial experience and a host of recent conversations around the world with many principals in this space. Their relatively low allocations to physical gold in a world otherwise replete with debt, risk-asset and currency risk is fascinating yet otherwise understandable given how fundamentally misunderstood gold remains as an asset class.
Piepenburg holds nothing back in explaining just how and why gold is in fact intentionally misunderstood by many of the most sophisticated investors.
**********


